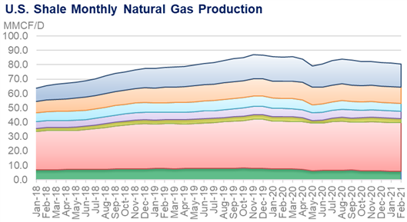
The latest edition of the EIA’s Drilling Productivity Report, published on Tuesday, shows cumulative natural gas production from seven key U.S. onshore regions falling by 0.47 Bcf/d from January to February. This extends a downtrend that goes back to last January.

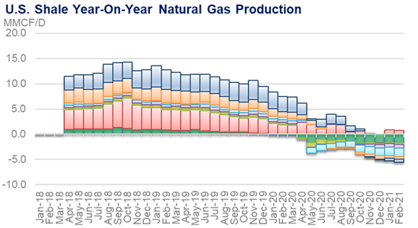
The year-on-year change is -4.81 Bcf/d, with two regions accounting for 71% of the total drop: Anadarko and the Eagle Ford. The natural gas production out of these two regions is heavily tied to oil prices, as the majority of production comes from oily plays. With oil prices recovering to over $50/bbl there is hope that rigs get deployed to these regions and natural gas production follows.
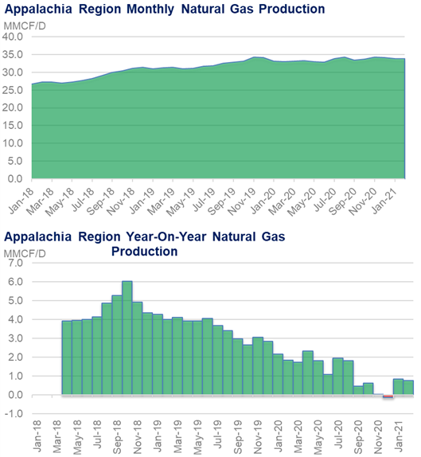
The Appalachian region continues to show strong production with YoY gains. The rationale behind growth despite only 28 rigs operating in the Marcellus (vs. 35 LY) is the strong well performance and reduction in DUC inventory. The Appalachian DUCs dropped by 12 (596 to 584) from Nov to Dec, and the new-well gas production per rig increased by 273 Mcf/d (27.37 MMcf/d to 27.65 MMcf/d). All other regions saw natural gas new well production per rig stay flat or drop.
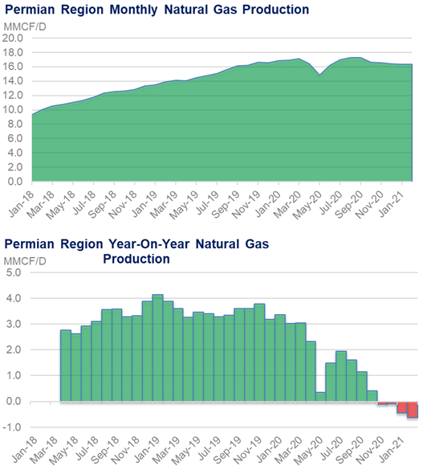
The Permian region oil and gas production has been relatively flat over the past few months, and the EIA does not expect this to change too much in February. Permian Basin rigs in West Texas and New Mexico continue their upward trend after hitting a low in August. For the week ended January 22, WTI Midland prices averaged near $54/bbl which is above the average break-even of $43-45/bbl. According to Platts, “The recent surge in oil prices is positive for activity but unlikely to have a significant impact as operators are expected to continue to keep some capital discipline”. So the positive price movement might not spur more production out of the Permian, but for 2020 we can expect producers to at least maintaining current levels.
See the attached PDF that goes through the rig and oil/gas production trends for each region.
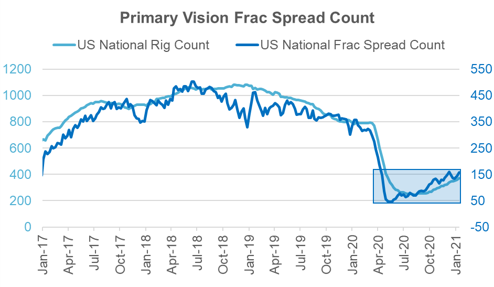
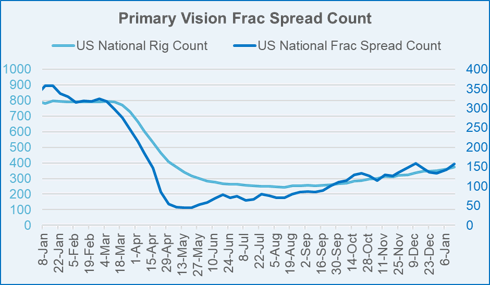
Lastly, we take a look at the latest Primary Vision Frac Spread Count.
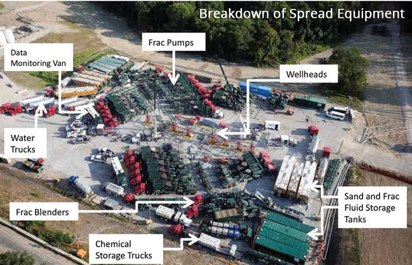
“A frac spread (or sometimes referred to as a frac fleet) is a set number of equipment that a pressure pumper (oil field service company) uses for hydraulic fracturing.
This includes a combination of fracturing pumps (also referred to as frac pumpers and/or pumping units), data trucks, storage tanks, chemical additive and hydration units, blenders and other equipment needed to perform a frac stimulation.”
Source: Primary Vision
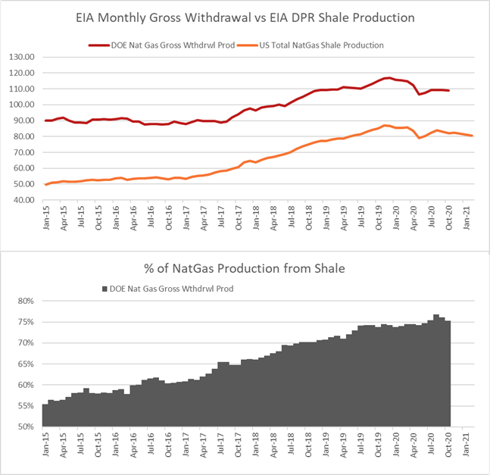
The count has been on a steady incline since hitting at low in mid-July when the current was 64. The Frac Spread Count is more of a real-time indicator for oil and natural coming online from shale plays vs. rig counts. Since Shale production now makes up 75% of total natural gas production, we keep a close look at the frac count.
The current count as of Jan 15th is now 250% of that low point – at 158.
This has not proven to be a great leading indicator of oil and natural gas production in 2020. We believe this is in part to the highly volatile well results last year coming from massive increases in well productivity as producers only tapped the best acreage, and shut-in well and resumption of these wells. That being said, we do keep a close eye on rig and frac spread counts to give us an indicator of which way producers are trending.
Fundamentals for the week ending Jan 22: Our early view for the upcoming storage report is a -133 Bcf withdrawal for the lower 48. This would take storage levels to 2876 Bcf (+73 YoY, +239 vs 5Yr). The industry estimates for this report range between -153 to -125 according to The Desk.
For this past week, supply was higher week on week, with production out of the South Central region recovering from the previous week. Our belief is cooler weather and snow pockets of TX and LA led to freeze off production during week ending Jan 15. All other regions showed relatively unchanged production. Power and ResComm usage dropped considerably as weather warmed up across the South Central and Midcon regions. Power was lower by 2.5 Bcf/d WoW, and RC was lower by 3.6 Bcf/d WoW. Deliveries to LNG facilities averaged 10.6 Bcf/d, down 0.3 Bcf/d WoW. LNG feedgas flows fell off this past week, mainly on a drop at Sabine Pass. Reports of dense sea fog along the Gulf Coast and maintenance on a pipe compressor stations that feeds Sabine were the issue.
Net the balance were looser by 8.3 Bcf/d week-on-week.
Expiration and rolls: UNG ETF roll starts on Feb 10th and ends on Feb 16th.
Feb futures expire on Jan 27th, and Jan options expire on Jan 26th.
This email, any information contained herein and any files transmitted with it (collectively, the Material) are the sole property of OTC Global Holdings LP and its affiliates (OTCGH); are confidential, may be legally privileged and are intended solely for the use of the individual or entity to whom they are addressed. Unauthorized disclosure, copying or distribution of the Material, is strictly prohibited and the recipient shall not redistribute the Material in any form to a third party. Please notify the sender immediately by email if you have received this email by mistake, delete this email from your system and destroy any hard copies. OTCGH waives no privilege or confidentiality due to any mistaken transmission of this email.