PDF’s attached
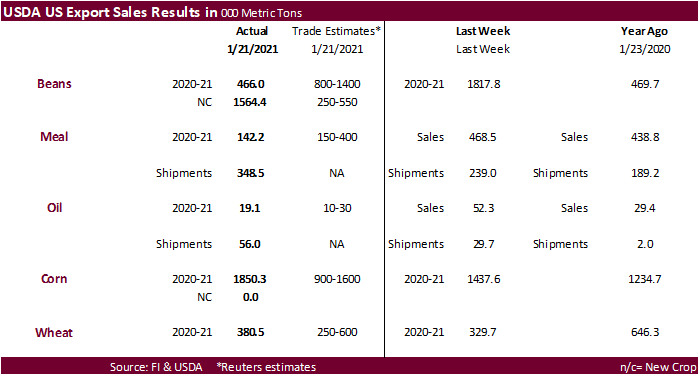
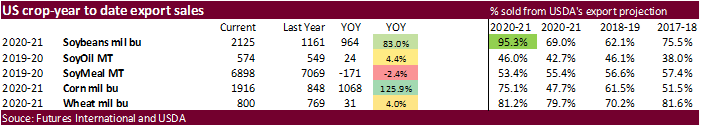
USDA export sales for new crop soybeans knocked it out of the park but old crop failed to live up to expectations, despite USDA 24-hour sales announced. Corn sales were above expectations and may provide support. Meal and soybean oil shipments were excellent. Wheat was within expectations.
U.S. EXPORT SALES FOR WEEK ENDING 1/21/2021
|
|
CURRENT MARKETING YEAR |
NEXT MARKETING YEAR |
||||||
|
COMMODITY |
NET SALES |
OUTSTANDING SALES |
WEEKLY EXPORTS |
ACCUMULATED EXPORTS |
NET SALES |
OUTSTANDING SALES |
||
|
CURRENT YEAR |
YEAR |
CURRENT YEAR |
YEAR |
|||||
|
|
THOUSAND METRIC TONS |
|||||||
|
WHEAT |
|
|
|
|
|
|
|
|
|
HRW |
109.4 |
1,356.2 |
1,824.5 |
146.8 |
6,001.4 |
5,901.5 |
142.5 |
164.5 |
|
SRW |
14.4 |
443.1 |
409.4 |
46.8 |
1,156.6 |
1,735.1 |
64.5 |
209.5 |
|
HRS |
136.2 |
1,894.3 |
1,589.9 |
163.7 |
4,513.2 |
4,427.6 |
9.0 |
54.0 |
|
WHITE |
122.5 |
2,398.1 |
1,209.5 |
147.6 |
3,349.8 |
3,015.5 |
0.0 |
36.1 |
|
DURUM |
-2.0 |
168.0 |
190.4 |
0.8 |
489.8 |
623.8 |
0.0 |
0.0 |
|
TOTAL |
380.5 |
6,259.7 |
5,223.6 |
505.8 |
15,510.8 |
15,703.6 |
216.0 |
464.1 |
|
BARLEY |
0.0 |
13.3 |
17.9 |
0.4 |
17.2 |
30.8 |
0.0 |
12.5 |
|
CORN |
1,850.3 |
29,648.7 |
11,034.5 |
1,414.0 |
19,021.3 |
10,508.3 |
0.0 |
803.4 |
|
SORGHUM |
185.0 |
3,358.6 |
360.8 |
118.6 |
2,398.7 |
779.4 |
63.0 |
541.0 |
|
SOYBEANS |
466.0 |
12,271.2 |
6,215.9 |
2,194.5 |
45,562.3 |
25,388.1 |
1,564.4 |
3,613.0 |
|
SOY MEAL |
142.2 |
2,845.9 |
3,623.4 |
348.5 |
4,052.3 |
3,445.3 |
90.0 |
168.9 |
|
SOY OIL |
19.1 |
233.7 |
224.6 |
55.9 |
340.0 |
324.7 |
0.0 |
0.6 |
|
RICE |
|
|
|
|
|
|
|
|
|
L G RGH |
116.6 |
294.9 |
337.4 |
29.1 |
838.7 |
709.3 |
0.0 |
0.0 |
|
M S RGH |
0.0 |
14.8 |
18.8 |
0.0 |
14.1 |
16.5 |
0.0 |
0.0 |
|
L G BRN |
0.1 |
10.3 |
21.8 |
0.1 |
23.1 |
20.4 |
0.0 |
0.0 |
|
M&S BR |
0.3 |
53.5 |
69.1 |
0.3 |
52.5 |
21.0 |
0.0 |
0.0 |
|
L G MLD |
18.0 |
75.3 |
138.4 |
3.9 |
326.9 |
525.1 |
0.0 |
0.0 |
|
M S MLD |
10.1 |
168.5 |
132.1 |
24.9 |
243.1 |
303.9 |
0.0 |
0.0 |
|
TOTAL |
145.1 |
617.4 |
717.6 |
58.3 |
1,498.4 |
1,596.2 |
0.0 |
0.0 |
|
COTTON |
|
THOUSAND RUNNING BALES |
||||||
|
UPLAND |
322.7 |
6,083.6 |
7,466.0 |
275.3 |
6,395.6 |
5,048.3 |
53.6 |
939.4 |
|
PIMA |
25.8 |
271.8 |
224.4 |
12.6 |
373.6 |
199.4 |
0.0 |
1.1 |
Export Sales Highlights
This summary is based on reports from exporters for the period January 15-21, 2021.
Wheat: Net sales of 380,500 metric tons (MT) for 2020/2021 were up 15 percent from the previous week and 13 percent from the prior 4-week average. Increases primarily for China (130,000 MT, including 65,000 MT switched from unknown destinations), Mexico (67,400 MT, including decreases of 100 MT), Japan (60,600 MT, including decreases of 500 MT), South Korea (54,100 MT, including 50,000 MT late–see below), and the Philippines (53,400 MT, including decreases of 1,700 MT), were offset by reductions primarily for unknown destinations (117,000 MT). For 2021/2022, net sales of 216,000 MT were reported for Nigeria (138,000 MT), Mexico (60,000 MT), and unknown destinations (18,000 MT). Exports of 505,800 MT were up 92 percent from the previous week and 37 percent from the prior 4-week average. The destinations were primarily to Japan (113,000 MT), Mexico (85,000 MT), Indonesia (57,500 MT), the Philippines (57,400 MT), and Sri Lanka (52,400 MT).
Optional Origin Sales: For 2020/2021, the current outstanding balance of 10,000 MT, all Spain.
Late Reporting: For 2020/2021, new sales totaling 50,000 MT were reported late for South Korea.
Corn: Net sales of 1,850,300 MT for 2020/2021 were up 29 percent from the previous week and 61 percent from the prior 4-week average. Increases primarily for Japan (695,700 MT, including 232,100 MT switched from unknown destinations and decreases of 26,800 MT), Mexico (145,600 MT, including decreases of 1,000 MT), Colombia (116,900 MT, including 50,000 MT switched from unknown destinations and decreases of 23,600 MT), Israel (105,000 MT), and unknown destinations (91,300 MT), were offset by reductions for Guatemala (1,200 MT) and Chile (600 MT). Exports of 1,414,000 MT were up 60 percent from the previous week and 20 percent from the prior 4-week average. The destinations were primarily to Japan (518,000 MT), Mexico (233,700 MT), China (141,900 MT), Colombia (90,600 MT), and South Korea (71,500 MT).
Optional Origin Sales: For 2020/2021, options were exercised to export 30,000 MT to Ukraine from other than the United States. The current outstanding balance of 1,269,400 MT is for South Korea (838,000 MT), unknown destinations (224,000 MT), Taiwan (140,000 MT), China (65,000 MT), and Ukraine (2,400 MT).
Barley: No net sales were reported for the week. Exports of 400 MT were to Taiwan.
Sorghum: Net sales of 185,000 MT for 2020/2021, resulting in increases for China (253,000 MT, including 68,000 MT switched from unknown destinations and decreases of 60,300 MT), were offset by reductions for unknown destinations (68,000 MT). For 2021/2022, total net sales of 63,000 MT were for China. Exports of 118,600 MT were down 46 percent from the previous week and 13 percent from the prior 4-week average. The destination was China.
Rice: Net sales of 145,100 MT for 2020/2021 were up noticeably from the previous week and from the prior 4-week average. Increases primarily for Mexico (71,600 MT), Honduras (34,500 MT), Haiti (7,100 MT), Saudi Arabia (6,700 MT), and El Salvador (6,000 MT), were offset by reductions primarily for Singapore (300 MT). Exports of 58,300 MT were up 2 percent from the previous week, but down 14 percent from the prior 4-week average. The destinations were primarily to Venezuela (26,300 MT), Japan (13,600 MT), Mexico (3,800 MT), Saudi Arabia (2,700 MT), and Canada (2,700 MT).
Soybeans: Net sales of 466,000 MT for 2020/2021 were down 74 percent from the previous week and 45 percent from the prior 4-week average. Increases primarily for China (322,500 MT, including 195,000 MT switched from unknown destinations and decreases of 143,200 MT), Mexico (197,800 MT, including decreases of 29,800 MT), Indonesia (165,300 MT, including 68,000 MT switched from unknown destinations and decreases of 7,700 MT), Egypt (89,700 MT, including 42,900 MT switched from unknown destinations and decreases of 8,200 MT), and Taiwan (72,100 MT, including 66,000 MT switched from China and decreases of 200 MT), were offset by reductions primarily for unknown destinations (620,000 MT). For 2021/2022, net sales of 1,564,400 MT were reported for unknown destinations (654,000 MT), China (586,000 MT), the Netherlands (323,000 MT), and Canada (1,400 MT). Exports of 2,194,500 MT were down 8 percent from the previous week, but up 1 percent from the prior 4-week average. The destinations were primarily to China (1,342,500 MT), Mexico (201,800 MT), Egypt (139,700 MT), the Netherlands (131,500 MT), and Indonesia (99,800 MT).
Exports for Own Account: For 2020/2021, the current exports for own account outstanding balance is 6,100 MT, all Canada.
Soybean Cake and Meal: Net sales of 142,200 MT for 2020/2021 were down 70 percent from the previous week and 44 percent from the prior 4-week average. Increases primarily for Mexico (63,300 MT, including decreases of 3,300 MT), Canada (38,600 MT, including decreases of 700 MT), Panama (33,400 MT), Ecuador (31,400 MT, including 30,000 MT switched from unknown destinations), and the Dominican Republic (17,500 MT), were offset by reductions primarily for Morocco (88,800 MT) and unknown destinations (29,000 MT). Exports of 348,500 MT–a marketing-year high–were up 46 percent from the previous week and 37 percent from the prior 4-week average. The destinations were primarily to Spain (64,700 MT), the Philippines (47,900 MT), Mexico (36,700 MT), the Dominican Republic (34,100 MT), and Ecuador (31,400 MT).
Soybean Oil: Net sales of 19,100 MT for 2020/2021 were down 63 percent from the previous week and 40 percent from the prior 4-week average. Increases primarily for South Korea (6,000 MT), Colombia (5,000 MT), Peru (4,900 MT), the Dominican Republic (2,100 MT), and El Salvador (1,400 MT), were offset by reductions for Canada (300 MT). Exports of 55,900 MT–a marketing-year high–were up 89 percent from the previous week and up noticeably from the prior 4-week average. The destinations were primarily to South Korea (31,000 MT), the Dominican Republic (8,200 MT), Peru (7,400 MT), Colombia (5,500 MT), and Guatemala (2,000 MT).
Cotton: Net sales of 322,700 RB for 2020/2021 were up 10 percent from the previous week and 22 percent from the prior 4-week average. Increases were primarily for Turkey (65,900 RB), Vietnam (62,400 RB), Pakistan (57,800 RB), China (36,400 RB), and South Korea (24,000 RB). For 2021/2022, net sales of 53,600 RB primarily for South Korea (15,800 RB), Thailand (10,600 RB), Pakistan (8,400 RB), Japan (8,000 RB), and Vietnam (6,700 RB), were offset by reductions for Guatemala (7,100 RB). Exports of 275,300 RB were down 15 percent from the previous week and 4 percent from the prior 4-week average. Exports were primarily to China (112,400 RB), Vietnam (47,900 RB), Pakistan (36,400 RB), Mexico (22,300 RB), and Bangladesh (11,700 RB. Net sales of Pima totaling 25,800 RB were up 8 percent from the previous week and 27 percent from the prior 4-week average. Increases were primarily for India (9,900 RB), Pakistan (6,100 RB), Peru (3,400 RB), Vietnam (1,200 RB), and Egypt (1,100 RB). Exports of 12,600 RB were up 51 percent from the previous week and 8 percent from the prior 4-week average. The destinations were primarily to India (4,800 RB), Vietnam (2,600 RB), China (2,200 RB), Peru (1,200 RB), and Egypt (900 RB).
Exports for Own Account: For 2020/2021, new exports for own account totaling 5,300 RB were primarily to China (2,900 RB) and Vietnam (1,700 RB). Exports for own account totaling 1,800 RB to China were applied to new or outstanding sales. The current exports for own account outstanding balance of 8,600 RB is for China (5,900 RB), Vietnam (1,700 RB), and Indonesia (1,000 RB).
Hides and Skins: Net sales of 321,900 pieces for 2021, primarily for China (161,300 whole cattle hides, including decreases of 50,600 pieces), South Korea (89,100 whole cattle hides, including decreases of 11,200 pieces), Mexico (31,400 whole cattle hides, including decreases of 1,500 pieces), Thailand (17,900 whole cattle hides, including decreases of 400 pieces), and Turkey (6,100 whole cattle hides), were offset by reductions for Indonesia (300 pieces). Additionally, net sales of 1,300 kip skins were for China. Exports of 366,000 pieces for 2021 were primarily to China (211,600 pieces), South Korea (60,700 pieces), Mexico (57,300 pieces), Thailand (15,700 pieces), and Brazil (6,300 pieces).
Net sales of 131,800 wet blues for 2021, were primarily for Vietnam (33,400 unsplit, including decreases of 200 unsplit), Italy (13,200 grain splits and 12,600 unsplit), Mexico (14,700 unsplit and 10,500 grain splits), Thailand (22,900 unsplit, including decreases of 100 unsplit), and Brazil (14,000 unsplit). Exports of 141,000 wet blues for 2021 were primarily to Vietnam (64,700 unsplit), China (38,600 unsplit), Thailand (14,100 unsplit), Italy (7,800 unsplit and 3,200 grain splits), and Brazil (5,300 unsplit). Net sales of splits, 1,042,600 pounds for 2021, were primarily for Vietnam (918,900 pounds, including decreases of 9,500 pounds). Exports of 621,100 pounds were primarily to Vietnam (532,800 pounds).
Beef: Net sales of 28,800 MT reported for 2021, increases primarily for Japan (9,100 MT, including decreases of 600 MT), South Korea (8,100 MT, including decreases of 400 MT), Mexico (3,800 MT, including decreases of 100 MT), China (3,300 MT), and Taiwan (1,300 MT, including decreases of 100 MT), were offset by reductions primarily for Kuwait (100 MT). Exports of 17,400 MT were primarily to South Korea (5,200 MT), Japan (4,900 MT), Mexico (1,900 MT), China (1,200 MT), and Hong Kong (1,100 MT).
Pork: Net sales of 52,900 MT reported for 2021, increases primarily for Mexico (18,900 MT, including decreases of 1,100 MT), China (13,900 MT, including decreases of 1,000 MT), the Philippines (6,000 MT, including decreases of 200 MT), Japan (4,100 MT, including decreases of 100 MT), and South Korea (3,100 MT, including decreases of 600 MT), were offset by reductions primarily for El Salvador (300 MT). Exports of 39,600 MT were primarily to China (12,500 MT), Mexico (11,900 MT), Japan (4,600 MT), South Korea (2,600 MT), and Canada (2,100 MT).
January 28, 2021 1 FOREIGN AGRICULTURAL SERVICE/USDA
SUMMARY OF EXPORT TRANSACTIONS
REPORTED UNDER THE DAILY SALES REPORTING SYSTEM
FOR PERIOD ENDING JANUARY 21, 2020
COMMODITY DESTINATION QUANITY (MT) MARKETING YEAR
HRW WHEAT (101) NIGERIA 138,000 MT 1/ 2021/2022
CORN JAPAN 128,000 MT 1/ 2020/2021
CORN ISRAEL 100,000 MT 1/ 2020/2021
CORN UNKNOWN 336,500 MT 1/ 2020/2021
SORGHUM CHINA 60,000 MT 1/ 2020/2021
SORGHUM CHINA 63,000 MT 1/ 2021/2022
SOYBEANS CHINA 272,000 MT 1/ 2020/2021
SOYBEANS MEXICO 163,290 MT 1/ 2020/2021
1/ Export Sales.
Terry Reilly
Senior Commodity Analyst – Grain and Oilseeds
Futures International
One Lincoln Center
18 W 140 Butterfield Rd.
Oakbrook Terrace, Il. 60181
W: 312.604.1366
ICE IM: treilly1
Skype: fi.treilly

Trading of futures, options, swaps and other derivatives is risky and is not suitable for all persons. All of these investment products are leveraged, and you can lose more than your initial deposit. Each investment product is offered only to and from jurisdictions where solicitation and sale are lawful, and in accordance with applicable laws and regulations in such jurisdiction. The information provided here should not be relied upon as a substitute for independent research before making your investment decisions. Futures International, LLC is merely providing this information for your general information and the information does not take into account any particular individual’s investment objectives, financial situation, or needs. All investors should obtain advice based on their unique situation before making any investment decision. The contents of this communication and any attachments are for informational purposes only and under no circumstances should they be construed as an offer to buy or sell, or a solicitation to buy or sell any future, option, swap or other derivative. The sources for the information and any opinions in this communication are believed to be reliable, but Futures International, LLC does not warrant or guarantee the accuracy of such information or opinions. Futures International, LLC and its principals and employees may take positions different from any positions described in this communication. Past results are not necessarily indicative of future results.