PDF attached
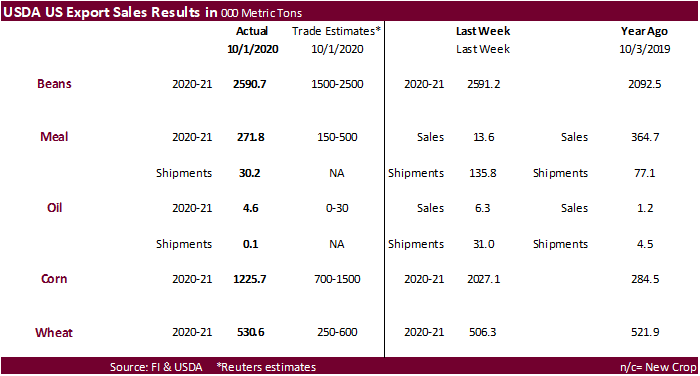
USDA export sales were very good for soybeans, substandard for meal and oil, good for corn and good for wheat. China took 1.538MMT of soybeans, but that included 449,000 switched from unknown destinations. Mexico and Egypt were good buyers of soybeans. Corn export sales of 1.226MMT included Japan and Mexico as the largest buyers.
U.S. EXPORT SALES FOR WEEK ENDING 10/1/2020
|
|
CURRENT MARKETING YEAR |
NEXT MARKETING YEAR |
||||||
|
COMMODITY |
NET SALES |
OUTSTANDING SALES |
WEEKLY EXPORTS |
ACCUMULATED EXPORTS |
NET SALES |
OUTSTANDING SALES |
||
|
CURRENT YEAR |
YEAR |
CURRENT YEAR |
YEAR |
|||||
|
WHEAT |
THOUSAND METRIC TONS |
|||||||
|
HRW |
95.8 |
1,512.5 |
1,323.2 |
216.5 |
3,874.7 |
3,707.2 |
0.0 |
10.9 |
|
SRW |
36.3 |
314.3 |
588.6 |
43.0 |
849.5 |
1,105.1 |
37.4 |
40.0 |
|
HRS |
214.6 |
1,667.4 |
1,302.2 |
257.0 |
2,602.7 |
2,326.1 |
0.0 |
5.0 |
|
WHITE |
174.4 |
1,315.8 |
1,081.9 |
163.2 |
1,842.2 |
1,496.5 |
0.0 |
0.0 |
|
DURUM |
9.5 |
220.3 |
204.5 |
23.0 |
321.6 |
291.3 |
0.0 |
0.0 |
|
TOTAL |
530.6 |
5,030.1 |
4,500.4 |
702.7 |
9,490.7 |
8,926.2 |
37.4 |
55.9 |
|
BARLEY |
0.0 |
33.3 |
40.7 |
0.2 |
8.7 |
16.8 |
0.0 |
0.0 |
|
CORN |
1,225.7 |
22,170.0 |
7,914.8 |
934.8 |
3,677.8 |
2,081.2 |
0.0 |
206.0 |
|
SORGHUM |
132.4 |
2,542.4 |
105.2 |
157.6 |
392.7 |
43.7 |
0.0 |
136.0 |
|
SOYBEANS |
2,590.7 |
33,970.0 |
12,359.2 |
2,068.6 |
6,749.7 |
3,892.3 |
0.0 |
60.0 |
|
SOY MEAL |
271.7 |
3,436.8 |
3,386.0 |
30.2 |
30.2 |
77.1 |
0.0 |
18.1 |
|
SOY OIL |
4.6 |
176.7 |
191.4 |
0.1 |
0.1 |
4.5 |
0.0 |
0.0 |
|
RICE |
|
|
|
|
|
|
|
|
|
L G RGH |
209.5 |
567.2 |
397.9 |
0.6 |
55.0 |
282.4 |
0.0 |
0.0 |
|
M S RGH |
0.0 |
26.5 |
23.4 |
0.5 |
2.4 |
7.4 |
0.0 |
0.0 |
|
L G BRN |
0.1 |
13.3 |
11.4 |
0.6 |
6.2 |
3.2 |
0.0 |
0.0 |
|
M&S BR |
16.1 |
24.1 |
0.4 |
7.1 |
25.3 |
0.7 |
0.0 |
0.0 |
|
L G MLD |
7.5 |
61.6 |
125.6 |
3.2 |
64.1 |
253.3 |
0.0 |
0.0 |
|
M S MLD |
25.0 |
96.6 |
106.3 |
4.2 |
67.2 |
122.1 |
0.0 |
0.0 |
|
TOTAL |
258.1 |
789.3 |
665.0 |
16.1 |
220.2 |
669.1 |
0.0 |
0.0 |
|
COTTON |
|
THOUSAND RUNNING BALES |
|
|||||
|
UPLAND |
178.4 |
5,822.0 |
7,024.0 |
142.3 |
2,312.4 |
1,905.2 |
15.0 |
485.7 |
|
PIMA |
21.7 |
227.2 |
122.7 |
15.8 |
103.1 |
75.3 |
0.0 |
0.7 |
|
FINAL 2019/20 MARKETING YEAR |
||||
|
COMMODITY |
NET SALES |
CARRYOVER SALES 1/ |
09/30/2020 EXPORTS |
ACCUMULATED EXPORTS |
|
SOY MEAL |
5.7 |
309.6 |
216.3 |
11,818.3 |
|
SOY OIL |
-3.8 |
49.3 |
15.6 |
1,234.6 |
|
|
|
|
|
|
|
|
|
|
|
|
This summary is based on reports from exporters for the period September 25-October 1, 2020.
Wheat: Net sales of 530,600 metric tons (MT) for 2020/2021 were up 5 percent from the previous week and 27 percent from the prior 4-week average. Increases primarily for the Philippines (202,900 MT, including decreases of 18,700 MT), Mexico (96,300 MT), unknown destinations (79,800 MT), Indonesia (57,000 MT), and Thailand (39,500 MT), were offset by reductions primarily for Costa Rica (600 MT) and Spain (600 MT). For 2021/2022, nets sales of 37,400 MT resulting in increases for Brazil (40,000 MT), were offset by reductions for Malaysia (2,600 MT). Exports of 702,700 MT were up 9 percent from the previous week and 17 percent from the prior 4-week average. The destinations were primarily to the Philippines (175,200 MT), Mexico (95,000 MT), Nigeria (80,100 MT), Vietnam (66,000 MT), and China (65,200 MT).
Corn: Net sales of 1,225,700 MT for 2020/2021 primarily for Japan (360,100 MT, including 39,600 MT switched from unknown destinations and decreases of 41,500 MT), Mexico (332,700 MT, including decreases of 1,300 MT), unknown destinations (310,900 MT), Colombia (93,400 MT, including 34,000 MT switched from unknown destinations and decreases of 2,900 MT), and Panama (52,600 MT), were offset by reductions for Taiwan (71,800 MT), Peru (24,100 MT), and El Salvador (7,700 MT). Exports of 934,800 MT were primarily to China (349,900 MT), Mexico (275,400 MT), Colombia (121,600 MT), Japan (81,600 MT), and Costa Rica (46,200 MT).
Optional Origin Sales: For 2020/2021, the current outstanding balance of 739,800 MT is for Vietnam (260,000 MT), Taiwan (204,200 MT), Argentina (127,000 MT), South Korea (65,000 MT), and Ukraine (30,000 MT).
Barley: No net sales were reported for the week. Exports of 200 MT were to South Korea.
Rice: Net sales of 258,100 MT for 2020/2021–marketing-year high–were up noticeably from the previous week and from the prior 4-week average. Increases were primarily for Mexico (88,400 MT), Venezuela (60,000 MT), Costa Rica (38,100 MT), South Korea (36,000 MT), and El Salvador (13,800 MT). Exports of 16,100 MT were up 50 percent from the previous week, but down 13 percent from the prior 4-week average. The destinations were primarily to South Korea (7,000 MT), Saudi Arabia (3,200 MT), Canada (1,900 MT), Mexico (1,600 MT), and Jordan (700 MT).
Soybeans: Net sales of 2,590,700 MT for 2020/2021 were primarily for China (1,538,100 MT, including 449,000 MT switched from unknown destinations and decreases of 15,100 MT), Mexico (183,300 MT, including decreases of 800 MT), Egypt (120,000 MT), Bangladesh (111,000 MT, switched from unknown destinations), and Vietnam (97,500 MT, including 66,000 MT switched from unknown destinations). Exports of 2,068,600 MT were primarily to China (1,385,200 MT), Mexico (101,300 MT), Vietnam (83,200 MT), Pakistan (70,300 MT), and Spain (67,100 MT).
Optional Origin Sales: For 2020/2021, the current outstanding balance of 126,000 MT, all China.
Exports for Own Account: For 2020/2021, the current exports for own account outstanding balance is 7,300 MT, all Canada.
Soybean Cake and Meal: Net sales for the 2020/2021 marketing year, which began October 1, totaled 271,700 MT primarily for Mexico (117,800 MT), Colombia (36,400 MT), Japan (29,300 MT, including decreases of 1,400 MT), Panama (14,000 MT), and Guatemala (12,500 MT, including 3,000 MT switched from El Salvador and decreases of 1,000 MT). A total of 309,600 MT in sales were carried over from the 2019/2020 marketing year, which ended September 30. Exports for the period ending September 30 of 216,300 MT brought accumulated exports to 11,818,300 MT, up 3 percent from the prior year’s total of 11,427,800 MT. The primary destinations were to Colombia (70,700 MT), Guatemala (32,000 MT), the Dominican Republic (29,600 MT), Honduras (18,000 MT), and Mexico (13,400 MT). Exports for October 1 totaled 30,200 MT, with Honduras (6,800 MT), the Dominican Republic (6,200 MT), Guatemala (5,800 MT), El Salvador (4,200 MT), and Canada (3,300 MT) being the primary destinations.
Soybean Oil: Net sales for the 2020/2021 marketing year, which began October 1, totaled 4,600 MT for Guatemala (3,000 MT), Jamaica (500 MT), the Dominican Republic (500 MT), Mexico (400 MT), and Canada (200 MT). A total of 49,300 MT in sales were carried over from the 2019/2020 marketing year, which ended September 30. Exports for the period ending September 30 of 15,600 MT brought accumulated exports to 1,234,600 MT, up 54 percent from the prior year’s total of 800,800 MT. The destinations were to Guatemala (8,000 MT), Nicaragua (2,500 MT), Canada (2,300 MT), Costa Rica (2,000 MT), and Mexico (800 MT). Exports for October 1 totaled 100 MT, with Canada being the destination.
Cotton: Net sales of 178,400 RB for 2020/2021 were down 24 percent from the previous week and 27 percent from the prior 4-week average. Increases primarily for Vietnam (125,500 RB, including 1,300 RB switched from Hong Kong and decreases of 9,200 RB), China (26,700 RB, including decreases of 700 RB), Pakistan (21,500 RB, including decreases of 1,600 RB), Costa Rica (6,200 RB), and Mexico (5,200 RB, including decreases of 200 RB), were offset by reductions primarily for Bangladesh (14,000 RB), Japan (3,900 RB), and Hong Kong (1,300 RB). For 2021/2022, net sales of 15,000 RB were for Bangladesh (13,200 RB) and Costa Rica (1,800 RB). Exports of 142,300 RB were down 35 percent from the previous week and 38 percent from the prior 4-week average. Exports were primarily to China (53,500 RB), Vietnam (16,900 RB), Mexico (16,800 RB), Turkey (11,200 RB), and Bangladesh (9,200 RB). Net sales of Pima totaling 21,700 RB were up 11 percent from the previous week and 4 percent from the prior 4-week average. Increases primarily for India (11,300 RB), Pakistan (3,800 RB), Bangladesh (3,000 RB, including 300 RB switched from Switzerland), and Vietnam (2,200 RB), were offset by reductions for Turkey (400 RB) and Switzerland (300 RB). Exports of 15,800 RB were up 46 percent from the previous week and 24 percent from the prior 4-week average. The primary destinations were India (5,100 RB), Vietnam (3,100 RB), Pakistan (1,800 RB), Turkey (1,600 RB), and Peru (1,500 RB).
Exports for Own account: For 2020/2021, the current exports for own account outstanding balance of 13,000 RB is for China (8,100 RB), Indonesia (3,900 RB), and Bangladesh (1,000 RB).
Hides and Skins: Net sales of 285,000 pieces for 2020 were unchanged from the previous week, but down 28 percent from the prior 4-week average. Increases primarily for China (227,000 whole cattle hides, including decreases of 46,900 pieces), Cambodia (16,600 whole cattle hides), Mexico (15,900 whole cattle hides, including decreases of 300 pieces), South Korea (11,600 whole cattle hides, including decreases of 1,600 pieces), and Thailand (9,800 whole cattle hides, including decreases of 100 pieces), were offset by reductions primarily for Vietnam (2,000 pieces) and Taiwan (700 pieces). Additionally, total net sales reductions of 100 kip skins were reported for Italy. Exports of 461,800 pieces reported for 2020 were up 1 percent from the previous week and 8 percent from the prior 4-week average. Whole cattle hides exports were primarily to China (375,800 pieces), South Korea (42,800 pieces), Mexico (18,200 pieces), Brazil (6,000 pieces), and Thailand (4,200 pieces). In addition, exports of 1,000 kip skins were to Italy.
Net sales of 117,800 wet blues for 2020 were down 22 percent from the previous week and 14 percent from the prior 4-week average. Increases primarily for China (43,900 unsplit), Thailand (32,200 unsplit, including decreases of 200 unsplit), Vietnam (22,800 unsplit), Mexico (10,000 grain splits and 3,400 unsplit), and South Korea (7,000 grain splits), were offset by reductions for India (4,900 grain splits) and Taiwan (200 unsplit). For 2021, total net sales of 4,900 wet blues grain splits were reported for India. Exports of 186,700 wet blues for 2020 were up 10 percent from the previous week and 35 percent from the prior 4-week average. The destinations were primarily to China (49,500 unsplit), Vietnam (37,100 unsplit and 3,600 grain splits), Italy (34,700 unsplit and 8,100 grain splits), Thailand (24,600 unsplit), and Mexico (8,900 grain splits and 4,400 unsplit). Net sales of 228,200 splits resulting in increases for China (241,800 pounds, including decreases of 6,600 pounds), were offset by reductions for Vietnam (13,600 pounds). Exports of 324,900 pounds were to Vietnam (239,700 pounds) and China (85,200 pounds).
Beef: Net sales of 20,700 MT reported for 2020 were down 16 percent from the previous week, but up 14 percent from the prior 4-week average. Increases were primarily for South Korea (5,800 MT, including decreases of 500 MT), China (4,100 MT), Japan (3,700 MT, including decreases of 1,400 MT), Hong Kong (3,100 MT, including decreases of 200 MT), and Taiwan (1,100 MT, including decreases of 100 MT). For 2021, net sales of 2,200 MT were primarily for Japan (1,400 MT) and Canada (500 MT). Exports of 16,900 MT were up 2 percent from the previous week and 5 percent from the prior 4-week average. The destinations were primarily to Japan (4,500 MT), South Korea (3,800 MT), Hong Kong (1,600 MT), China (1,500 MT), and Taiwan (1,400 MT).
Pork: Net sales of 60,200 MT reported for 2020–a marketing-year high–were up 52 percent from the previous week and from the prior 4-week average. Increases were primarily for China (29,000 MT, including decreases of 1,200 MT), Mexico (16,400 MT, including decreases of 500 MT), Canada (4,500 MT, including decreases of 400 MT), Japan (2,400 MT, including decreases of 200 MT), and South Korea (2,000 MT, including decreases of 100 MT). For 2021, net sales of 500 MT were primarily for Canada (300 MT) and Australia (100 MT). Exports of 36,800 MT were up 13 percent from the previous week and from the prior 4-week average. The destinations were primarily to Mexico (11,200 MT), China (10,600 MT), Japan (4,300 MT), Canada (2,500 MT), and South Korea (2,200 MT).
Terry Reilly
Senior Commodity Analyst – Grain and Oilseeds
Futures International │190 S LaSalle St., Suite 410│Chicago, IL 60603
W: 312.604.1366
ICE IM: treilly1
Skype: fi.treilly

Trading of futures, options, swaps and other derivatives is risky and is not suitable for all persons. All of these investment products are leveraged, and you can lose more than your initial deposit. Each investment product is offered only to and from jurisdictions where solicitation and sale are lawful, and in accordance with applicable laws and regulations in such jurisdiction. The information provided here should not be relied upon as a substitute for independent research before making your investment decisions. Futures International, LLC is merely providing this information for your general information and the information does not take into account any particular individual’s investment objectives, financial situation, or needs. All investors should obtain advice based on their unique situation before making any investment decision. The contents of this communication and any attachments are for informational purposes only and under no circumstances should they be construed as an offer to buy or sell, or a solicitation to buy or sell any future, option, swap or other derivative. The sources for the information and any opinions in this communication are believed to be reliable, but Futures International, LLC does not warrant or guarantee the accuracy of such information or opinions. Futures International, LLC and its principals and employees may take positions different from any positions described in this communication. Past results are not necessarily indicative of future results.