PDF attached
USDA export sales.
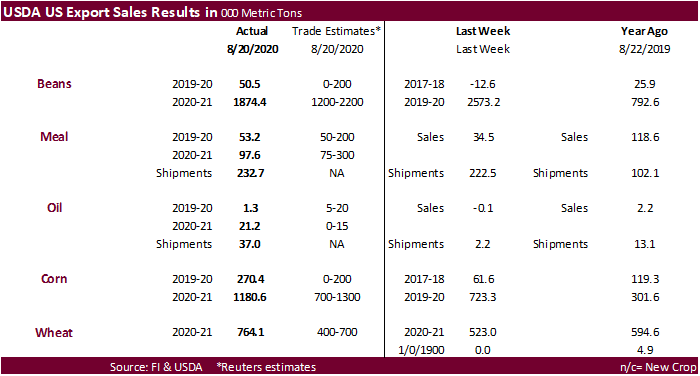
No major surprises in USDA’s export sales report. Meal and SBO sales remain on the light side but shipments were ok. All-wheat exceeded expectations and corn and soybean new-crop sales were within expectations. Pork sales were robust again at 39,400 tons with China and Mexico taking about two-thirds of the amount.
U.S. EXPORT SALES FOR WEEK ENDING 8/20/2020
|
|
CURRENT MARKETING YEAR |
NEXT MARKETING YEAR |
||||||
|
COMMODITY |
NET SALES |
OUTSTANDING SALES |
WEEKLY EXPORTS |
ACCUMULATED EXPORTS |
NET SALES |
OUTSTANDING SALES |
||
|
CURRENT YEAR |
YEAR |
CURRENT YEAR |
YEAR |
|||||
|
|
THOUSAND METRIC TONS |
|||||||
|
WHEAT |
|
|
|
|
|
|
|
|
|
HRW |
483.7 |
1,856.3 |
1,519.2 |
269.9 |
2,636.9 |
2,741.2 |
10.9 |
10.9 |
|
SRW |
8.5 |
638.3 |
696.6 |
61.4 |
446.3 |
688.1 |
1.0 |
1.0 |
|
HRS |
147.6 |
1,882.5 |
1,700.3 |
142.8 |
1,572.8 |
1,340.0 |
0.0 |
5.0 |
|
WHITE |
124.2 |
1,200.7 |
970.7 |
168.3 |
1,180.3 |
982.5 |
0.0 |
0.0 |
|
DURUM |
0.0 |
250.9 |
296.5 |
4.0 |
213.3 |
148.1 |
0.0 |
0.0 |
|
TOTAL |
764.1 |
5,828.6 |
5,183.3 |
646.4 |
6,049.6 |
5,900.0 |
11.9 |
16.9 |
|
BARLEY |
0.0 |
30.8 |
45.8 |
0.3 |
8.4 |
11.1 |
0.0 |
0.0 |
|
CORN |
270.4 |
2,333.8 |
1,558.6 |
939.1 |
42,158.0 |
48,542.1 |
1,180.5 |
13,384.1 |
|
SORGHUM |
-3.9 |
229.1 |
85.0 |
56.1 |
4,396.1 |
1,640.1 |
312.5 |
2,157.6 |
|
SOYBEANS |
50.4 |
4,308.3 |
3,721.2 |
1,276.4 |
43,240.2 |
44,992.1 |
1,874.4 |
22,423.1 |
|
SOY MEAL |
53.2 |
1,284.4 |
1,605.7 |
232.7 |
10,760.7 |
10,372.2 |
97.6 |
1,308.9 |
|
SOY OIL |
1.3 |
139.6 |
149.6 |
37.0 |
1,128.3 |
738.9 |
21.2 |
102.0 |
|
RICE |
|
|
|
|
|
|
|
|
|
L G RGH |
41.1 |
163.1 |
316.0 |
22.8 |
49.5 |
111.8 |
0.0 |
0.0 |
|
M S RGH |
0.0 |
27.9 |
26.9 |
0.2 |
1.0 |
1.9 |
0.0 |
0.0 |
|
L G BRN |
0.1 |
8.7 |
2.3 |
0.5 |
2.0 |
1.7 |
0.0 |
0.0 |
|
M&S BR |
0.0 |
26.1 |
0.1 |
4.1 |
5.8 |
0.2 |
0.0 |
0.0 |
|
L G MLD |
20.5 |
69.4 |
228.7 |
5.8 |
11.9 |
107.4 |
0.0 |
0.0 |
|
M S MLD |
13.5 |
52.9 |
84.5 |
15.1 |
34.1 |
48.7 |
0.0 |
0.0 |
|
TOTAL |
75.3 |
348.0 |
658.5 |
48.5 |
104.3 |
271.6 |
0.0 |
0.0 |
|
COTTON |
|
THOUSAND RUNNING BALES |
||||||
|
UPLAND |
156.6 |
5,874.1 |
7,222.8 |
277.5 |
977.7 |
861.9 |
7.9 |
329.1 |
|
PIMA |
12.6 |
183.6 |
124.3 |
10.2 |
24.3 |
29.3 |
0.0 |
0.0 |
This summary is based on reports from exporters for the period August 14-20, 2020.
Wheat: Net sales of 764,100 metric tons (MT) for 2020/2021 were up 46 percent from the previous week and 41 percent from the prior 4-week average. Increases primarily for Mexico (134,300 MT, including decreases of 100 MT), China (123,000 MT), unknown destinations (102,500 MT), Indonesia (86,100 MT), and the Philippines (53,600 MT, including decreases of 1,400 MT), were offset by reductions primarily for Ecuador (9,800 MT), Sri Lanka (3,400 MT), and Italy (2,000 MT). For 2020/2021, net sales of 11,900 MT were for Mexico (10,900 MT) and Malaysia (1,000 MT). Exports of 646,400 MT were up 59 percent from the previous week and 31 percent from the prior 4-week average. The destinations were primarily to the Philippines (91,600 MT), China (63,000 MT), Mexico (60,800 MT), Taiwan (60,500 MT), and Thailand (59,900 MT).
Corn: Net sales of 270,400 MT for 2019/2020 were up noticeably from the previous week and from the
prior 4-week average. Increases primarily for Japan (97,900 MT, including decreases of 7,700 MT), Taiwan (91,200 MT), Mexico (62,300 MT, including decreases of 11,100 MT), Colombia (45,800 MT, including 65,000 MT switched from unknown destinations and decreases of 27,700 MT), and China (19,400 MT), were offset by reductions primarily for unknown destinations (64,500 MT). For 2020/2021, net sales of 1,180,500 MT primarily for China (666,000 MT), Mexico (233,000 MT), unknown destinations (156,200 MT), Japan (50,000 MT), and Guatemala (20,300 MT), were offset by reductions for Canada (4,600 MT). Exports of 939,100 MT were down 22 percent from the previous week and 10 percent from the prior 4-week average. The destinations were primarily to Mexico (255,300 MT), Japan (227,600 MT), Colombia (219,100 MT), China (135,400 MT), and Canada (33,300 MT).
Optional Origin Sales: For 2019/2020, the current outstanding balance of 390,000 MT is for South Korea (260,000 MT), Vietnam (65,000 MT), and Taiwan (65,000 MT). For 2020/2021, the current outstanding balance of 260,000 MT is for Vietnam (195,000 MT) and South Korea (65,000 MT).
Barley: No net sales for 2020/2021 were reported for the week. Exports of 300 MT were down 25 percent from the previous week and 83 percent from the prior 4-week average. The destination was Japan.
Sorghum: Net sales reductions of 3,900 MT for 2019/2020 were down 16 percent from the previous week and down noticeably from the prior 4-week average. Increases reported for China (56,100 MT, including 60,000 MT switched from unknown destinations and decreases of 3,900 MT), were offset by reductions for unknown destinations (60,000 MT). For 2020/2021, net sales of 312,500 MT were reported for China (177,000 MT) and unknown destinations (135,500 MT). Exports of 56,100 MT were up 16 percent from the previous week, but down 71 percent from the prior 4-week average. The destination was China.
Rice: Net sales of 75,300 MT for 2020/2021 were primarily for Mexico (21,400 MT), Haiti (15,000 MT), Honduras (12,600 MT), Jordan (12,000 MT), and Guatemala (5,000 MT). Exports of 48,500 MT were primarily to Honduras (22,000 MT), Japan (12,400 MT), South Korea (4,500 MT), Saudi Arabia (4,000 MT), and Mexico (2,200 MT).
Soybeans: Net sales of 50,400 MT for 2019/2020 were down noticeably from the previous week and down 82 percent from the prior 4-week average. Increases primarily for the Netherlands (213,500 MT, including 196,500 MT switched from unknown destinations and decreases of 1,600 MT), China (168,600 MT, including 200,000 MT switched from unknown destinations and decreases of 7,100 MT), Spain (71,500 MT, including 65,000 MT switched from unknown destinations), Lebanon (21,600 MT, switched from Egypt), and Thailand (20,200 MT), were offset by reductions primarily for unknown destinations (469,300 MT). For 2020/2021, net sales of 1,874,400 MT were primarily for unknown destinations (822,000 MT), China (592,000 MT), Pakistan (136,000 MT), Indonesia (75,800 MT), and Thailand (74,500 MT), were offset by reductions for Japan (100 MT). Exports of 1,276,400 MT were up 42 percent from the previous week and 49 percent from the prior 4-week average. The destinations were primarily to China (762,900 MT), the Netherlands (213,500 MT), Spain (71,500 MT), Mexico (54,800 MT), and Egypt (30,900 MT).
Exports for Own Account: For 2019/2020, the current exports for own account outstanding balance is 61,600 MT, all Canada.
Soybean Cake and Meal: Net sales of 53,200 MT for 2019/2020 were up 54 percent from the previous week, but down 63 percent from the prior 4-week average. Increases primarily for Canada (31,500 MT, including decreases of 600 MT), Ecuador (30,900 MT, including 30,000 MT switched from unknown destinations), Japan (12,000 MT, switched from unknown destinations), Mexico (10,400 MT), and Honduras (6,300 MT, including 6,000 MT switched from El Salvador), were offset by reductions primarily for unknown destinations (42,000 MT), Guatemala (8,300 MT), Colombia (1,300 MT), and Belgium (1,200 MT). For 2020/2021, net sales of 97,600 MT were primarily for the Philippines (45,000 MT), Canada (26,100 MT), Costa Rica (10,000 MT), Guatemala (7,600 MT), and El Salvador (5,300 MT). Exports of 232,700 MT were up 5 percent from the previous week and 11 percent from the prior 4-week average. The destinations were primarily to the Philippines (75,700 MT), Ecuador (30,900 MT), Colombia (27,400 MT), Mexico (26,100 MT), and Guatemala (16,100 MT).
Soybean Oil: Net sales of 1,300 MT for 2019/2020 resulting in increases primarily for Algeria (10,000 MT, switched from unknown destinations), Morocco (8,000 MT, switched from unknown destinations), and Canada (1,100 MT, including decreases of 100 MT), were offset by reductions for unknown destinations (18,000 MT). For 2020/2021, net sales of 21,200 MT were reported for South Korea (15,000 MT), Venezuela (5,500 MT), and Canada (700 MT). Exports of 37,000 MT were up noticeably from the previous week and from the prior 4-week average. The destinations were primarily to South Korea (13,000 MT), Algeria (10,000 MT), Morocco (8,000 MT), Venezuela (3,800 MT), and Canada (1,500 MT).
Cotton: Net sales of 156,600 RB for 2020/2021 primarily for Vietnam (75,500 RB), China (46,800 RB, including decreases of 177,700 RB), Turkey (11,200 RB), Pakistan (7,000 RB, including decreases of 200 RB), and Indonesia (4,800 RB, including 100 RB switched from Japan), were offset by reductions for Japan (1,100 RB) and Ecuador (400 RB). For 2021/2022, total net sales of 7,900 RB were for China. Exports of 277,500 RB were primarily to China (153,500 RB), Vietnam (29,400 RB), Indonesia (16,100 RB), Bangladesh (14,800 RB), and Pakistan (13,100 RB). Net sales of Pima totaling 12,600 RB were primarily for Peru (4,400 RB), India (3,300 RB), Vietnam (2,600 RB), China (900 RB), and Bangladesh (900 RB). Exports of 10,200 RB were primarily to China (2,400 RB), Vietnam (2,200 RB), India (1,900 RB), Pakistan (1,700 RB), and Indonesia (900 RB).
Exports for Own account: For 2020/2021, exports for own account totaling 17,100 RB primarily to China (10,700 RB) and Malaysia (3,300 RB) were applied to new or outstanding sales. The current exports for own account outstanding balance of 13,600 RB is for China (8,700 RB), Indonesia (3,900 RB), and Bangladesh (1,000 RB).
Hides and Skins: Net sales of 403,100 pieces for 2020 were down 37 percent from the previous week and 13 percent from the prior 4-week average. Increases primarily for China (291,200 whole cattle hides, including decreases of 7,400 pieces), Mexico (52,300 whole cattle hides, including decreases of 800 pieces), South Korea (27,100 whole cattle hides, including decreases of 2,400 pieces), Thailand (11,500 whole cattle hides), and Cambodia (11,300 whole cattle hides), were offset by reductions primarily for Brazil (800 pieces). Additionally, net sales of 800 kip skins resulting in increases for China (1,300 kip skins), were offset by reductions for Belgium (500 kip skins). Exports of 473,400 pieces reported for 2020 were down 1 percent from the previous week and 4 percent from the prior 4-week average. Whole cattle hides exports were primarily to China (385,500 pieces), South Korea (36,800 pieces), Mexico (25,500 pieces), Vietnam (9,300 pieces), and Brazil (2,700 pieces). In addition, exports of 6,400 kip skins were to Belgium (5,100 kip skins) and China (1,300 kip skins).
Net sales of 116,500 wet blues for 2020 were down 55 percent from the previous week and 23 percent from the prior 4-week average. Increases primarily for China (45,600 unsplit), Thailand (26,500 unsplit), Vietnam (16,000 unsplit and 200 grain splits), South Korea (12,400 grain splits), and Taiwan (9,100 unsplit), were offset by reductions primarily for Italy (200 unsplit). Exports of 90,800 wet blues for 2020 were down 7 percent from the previous week and 18 percent from the prior 4-week average. The destinations were primarily to China (33,200 unsplit), Italy (17,100 unsplit and 4,800 grain splits), Thailand (15,400 unsplit), Vietnam (7,700 unsplit and 3,800 grain splits), and Mexico (4,400 unsplit and 2,100 grain splits). Net sales of 1,822,100 splits reported for Vietnam (1,822,400 pounds, including decreases of 24,700 pounds), were offset by reductions for China (300 pounds). Exports of 156,800 pounds were to Vietnam (115,800 pounds) and China (41,000 pounds).
Beef: Net sales of 11,800 MT reported for 2020 were down 40 percent from the previous week and 36 percent from the prior 4-week average. Increases primarily for China (3,300 MT), Hong Kong (3,200 MT, including decreases of 300 MT), South Korea (1,500 MT, including decreases of 2,200 MT), Japan (1,100 MT, including decreases of 1,800 MT), and Mexico (800 MT), were offset by reductions primarily for Indonesia (300 MT) and Chile (100 MT). Exports of 18,200 MT were down 1 percent from the previous week, but up 2 percent from the prior 4-week average. The destinations were primarily to South Korea (6,000 MT), Japan (4,900 MT), Taiwan (1,400 MT), Mexico (1,100 MT), and Canada (1,100 MT).
Pork: Net sales of 39,400 MT reported for 2020 were up 91 percent from the previous week and 56 percent from the prior 4-week average. Increases primarily for China (11,200 MT, including decreases of 400 MT), Mexico (10,700 MT, including decreases of 1,100 MT), Canada (6,600 MT, including decreases of 400 MT), Japan (3,300 MT, including decreases of 100 MT), and South Korea (1,900 MT, including decreases of 100 MT), were offset by reductions primarily for Nicaragua (200 MT). For 2021, net sales of 500 MT were primarily for Australia (400 MT). Exports of 32,600 MT were up 2 percent from the previous week, but down 2 percent from the prior 4-week average. The destinations were primarily to Mexico (9,900 MT), China (9,500 MT), Japan (3,500 MT), Canada (3,200 MT), and South Korea (1,500 MT).
Terry Reilly
Senior Commodity Analyst – Grain and Oilseeds
Futures International │190 S LaSalle St., Suite 410│Chicago, IL 60603
W: 312.604.1366
AIM: fi_treilly
ICE IM: treilly1
Skype: fi.treilly

Trading of futures, options, swaps and other derivatives is risky and is not suitable for all persons. All of these investment products are leveraged, and you can lose more than your initial deposit. Each investment product is offered only to and from jurisdictions where solicitation and sale are lawful, and in accordance with applicable laws and regulations in such jurisdiction. The information provided here should not be relied upon as a substitute for independent research before making your investment decisions. Futures International, LLC is merely providing this information for your general information and the information does not take into account any particular individual’s investment objectives, financial situation, or needs. All investors should obtain advice based on their unique situation before making any investment decision. The contents of this communication and any attachments are for informational purposes only and under no circumstances should they be construed as an offer to buy or sell, or a solicitation to buy or sell any future, option, swap or other derivative. The sources for the information and any opinions in this communication are believed to be reliable, but Futures International, LLC does not warrant or guarantee the accuracy of such information or opinions. Futures International, LLC and its principals and employees may take positions different from any positions described in this communication. Past results are not necessarily indicative of future results.