PDF attached
USDA export sales were very good for old crop soybeans at 952,200 tons. New-crop fell below expectations at 382,100 tons-one crop year offsetting the other. Soybean meal sales were on the lower end but shipments were good at 311,700 tons. Soybean oil sales rebounded sharply to 28,900 tons from the previous week of 2,800 tons. SBO shipments were poor at 2,100 tons. Corn export sales were within expectations and included 407,000 tons for China (old-crop). All-wheat sales were ok at 326,100 tons vs. 414,300 last week.
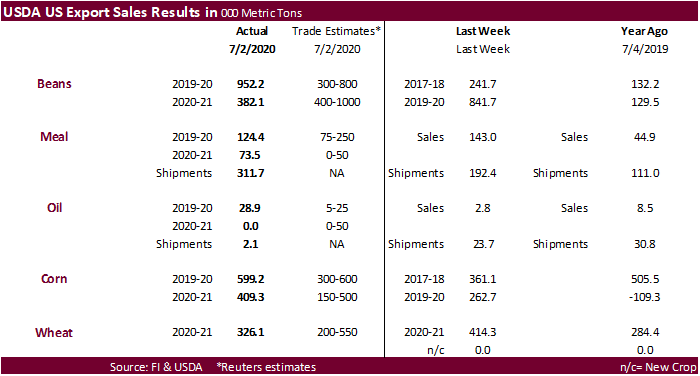
This summary is based on reports from exporters for the period June 26-July 2, 2020.
Wheat: Net sales of 326,100 metric tons (MT) were reported for delivery in marketing year 2020/2021. Increases primarily for Mexico (139,400 MT, including 53,000 MT switched from unknown destinations and decreases of 1,500 MT), the Philippines (73,000 MT), Ecuador (32,200 MT), Haiti (27,500 MT, including 25,000 MT switched from unknown destinations), and Italy (25,200 MT, including 25,000 MT switched from unknown destinations), were offset by reductions for Canada (8,200 MT), Guatemala (7,400 MT), and unknown destinations (6,000 MT). For 2021/2022, net sales reductions of 75,000 MT were reported for unknown destinations (67,000 MT) and Mexico (8,000 MT). Exports of 410,100 MT were primarily to Mexico (111,700 MT), Taiwan (53,400 MT, including 5,100 MT late – see below), Malaysia (47,300 MT), Italy (46,200 MT), and Guatemala (40,800 MT).
Export Adjustments: Accumulated exports of soft red winter wheat to Ecuador were adjusted down 32,202 MT for week ending June 25th. The correct commodity is hard red spring wheat and is included in this week’s report.
Late Reporting: For 2020/2021, exports to Taiwan (5,100 MT) were reported late.
Corn: Net sales of 599,200 MT for 2019/2020 were up 66 percent from the previous week and 30 percent from the prior 4-week average. Increases primarily for China (407,200 MT), Colombia (102,500 MT, including 42,400 MT switched from unknown destinations and decreases of 5,600 MT), Mexico (90,600 MT, including 8,000 MT switched from unknown destinations and decreases of 7,000 MT), Honduras (13,000 MT), and Nicaragua (12,800 MT), were offset by reductions primarily for unknown destinations (48,100 MT) and Japan (6,600 MT). For 2020/2021, net sales of 409,300 MT were primarily for Mexico (121,900 MT), unknown destinations (70,100 MT), Honduras (54,300 MT), Panama (39,000 MT), and Nicaragua (35,800 MT). Exports of 1,084,300 MT were down 25 percent from the previous week and 11 percent from the prior 4-week average. The destinations were primarily to Mexico (358,500 MT), Japan (286,900 MT), Colombia (142,200 MT), the Dominican Republic (70,500 MT), and China (66,500 MT).
Optional Origin Sales: For 2019/2020, the current outstanding balance of 325,000 MT is for South Korea (195,000 MT), Vietnam (65,000 MT), and Taiwan (65,000 MT). For 2020/2021, the current outstanding balance of 195,000 MT is for Vietnam.
Barley: No net sales for 2020/2021 were reported for the week. Exports of 200 MT were to South Korea.
Sorghum: Net sales of 53,900 MT for 2019/2020 were down 63 percent from the previous week, but up 3 from the prior 4-week average. Increases were reported for China (50,900 MT, including 50,000 MT switched from unknown destinations) and unknown destinations (3,000 MT). For 2020/2021, net sales of 137,000 MT were reported for unknown destinations (98,000 MT) and Japan (39,000 MT). Exports of 51,100 MT were down 61 percent from the previous week and 70 percent from the prior 4-week average. The destination was China.
Rice: Net sales of 21,600 MT for 2019/2020 were down 13 percent from the previous week, but up noticeably from the prior 4-week average. Increases were primarily for Colombia (18,500 MT), Canada (1,600 MT), Japan (500 MT), Saudi Arabia (400 MT), and Israel (300 MT). Exports of 21,100 MT were down 60 percent from the previous week and 63 percent from the prior 4-week average. The destinations were primarily to Japan (11,900 MT), Saudi Arabia (2,800 MT), Mexico (2,600 MT), Canada (1,900 MT), and Jordan (500 MT).
Exports for Own Account: For 2019/2020, the current exports for own account outstanding balance is 100 MT, all Canada.
Soybeans: Net sales of 952,200 MT for 2019/2020 were up noticeably from the previous week and up 60 percent from the prior 4-week average. Increases were primarily for China (461,400 MT, including 68,000 MT switched from unknown destinations and decreases of 300 MT), Indonesia (131,000 MT, including 55,000 MT switched from unknown destinations and decreases of 800 MT), Pakistan (70,000 MT), Bangladesh (58,400 MT, including 55,000 MT switched from unknown destinations), and Mexico (56,100 MT, including decreases of 34,100 MT). For 2020/2021, net sales of 382,100 MT were primarily for China (192,000 MT), unknown destinations (92,000 MT), Mexico (54,000 MT), Taiwan (25,500 MT), and Japan (7,000 MT). Exports of 467,500 MT were up 20 percent from the previous week and 36 percent from the prior 4-week average. The destinations were primarily to Mexico (144,200 MT), Indonesia (79,000 MT), China (74,400 MT), Bangladesh (58,400 MT), and Taiwan (31,700 MT).
Exports for Own Account: For 2019/2020, the current exports for own account outstanding balance is 2,100 MT, all Canada.
Soybean Cake and Meal: Net sales of 124,400 MT for 2019/2020 were down 13 percent from the previous week and 9 percent from the prior 4-week average. Increases primarily for Mexico (31,900 MT), Colombia (25,900 MT, including 9,000 MT switched from unknown destinations and decreases of 5,700 MT), Canada (25,300 MT, including decreases 200 MT), Honduras (16,000 MT), and Nicaragua (7,000 MT), were offset by reductions for unknown destinations (8,100 MT), the Dominican Republic (600), and Japan (100 MT). For 2020/2021, net sales of 73,500 MT were primarily for Honduras (17,600 MT), Guatemala (12,800 MT), Jamaica (12,000 MT), Panama (11,800 MT), and Nicaragua (8,800 MT). Exports of 311,700 MT were up 62 percent from the previous week and 43 percent from the prior 4-week average. The destinations were primarily to the Philippines (92,600 MT), Colombia (61,200 MT), Mexico (32,300 MT), Libya (31,200 MT), and Ecuador (27,000 MT).
Soybean Oil: Net sales of 28,900 MT for 2019/2020 were primarily for unknown destinations (19,000 MT), the Dominican Republic (8,500 MT), Canada (900 MT), and Mexico (400 MT). Exports of 2,100 MT were down 91 percent from the previous week and 90 percent from the prior 4-week average. The destinations were primarily to Mexico (1,300 MT) and Canada (600 MT).
Cotton: Net sales of 43,800 RB for 2019/2020 were down 35 percent from the previous week and 74 percent from the prior 4-week average. Increases primarily for China (22,000 RB), Malaysia (8,800 RB, switched from China), Vietnam (8,700 RB, including 2,400 RB switched from Japan, 1,400 RB switched from South Korea, and decreases of 1,300 RB), Turkey (6,400 RB), and Indonesia (1,400 RB, including 100 RB switched from Japan), were offset by reductions primarily for Japan (2,200 RB), South Korea (1,400 RB), and Pakistan (1,400 RB). For 2020/2021, net sales of 6,700 RB were reported for Turkey (5,400 RB) and Vietnam (1,300 RB). Exports of 329,300 RB were up 19 percent from the previous week and 7 percent from the prior 4-week average. Exports were primarily to China (112,400 RB), Vietnam (61,100 RB), Turkey (47,600 RB), Pakistan (36,200 RB), and Bangladesh (20,200 RB). Net sales of Pima totaling 2,800 RB were down 39 percent from the previous week and 34 percent from the prior 4-week average. Increases were for China (1,300 RB), Pakistan (1,000 RB), India (400 RB), and Turkey (100 RB). For 2020/2021, total net sales of 3,600 RB were for El Salvador. Exports of 7,300 RB were up 65 percent from the previous week, but down 16 percent from the prior 4-week average. The destinations were primarily to China (3,000 RB), Pakistan (3,000 RB), Vietnam (500 RB), India (300 RB), and Bangladesh (300 RB).
Exports for Own Account: For 2019/2020, new exports for own account totaling 2,200 RB were primarily to Vietnam (900 RB) and Pakistan (600 RB). Decreases were reported for China (1,100 RB) and Bangladesh (800 RB). The current exports for own account outstanding balance of 24,800 RB is for China (9,400 RB), Indonesia (8,200 RB), Vietnam (5,000 RB), Bangladesh (1,600 RB), and Pakistan (600 RB).
Hides and Skins: Net sales of 630,100 pieces for 2020 were up 58 percent from the previous week and 19 percent from the prior 4-week average. Increases primarily for China (427,100 whole cattle hides, including decreases of 10,900 pieces), Mexico (118,200 whole cattle hides, including decreases of 100 pieces), South Korea (73,800 whole cattle hides, including decreases of 700 pieces), Ethiopia (7,700 whole cattle hides), and Japan (2,400 whole cattle hides), were offset by reductions for Indonesia (200 pieces). Additionally, net sales reductions of 100 kip skins were for Canada. Exports of 516,900 pieces reported for 2020 were up 27 percent from the previous week and 21 percent from the prior 4-week average. Whole cattle hides exports were primarily to China (384,100 pieces), Mexico (68,700 pieces), South Korea (54,100 pieces), Indonesia (3,200 pieces), and Vietnam (2,500 pieces). In addition, exports of 1,300 kip skins were to Canada.
Net sales of 33,300 wet blues for 2020 were down 40 percent from the previous week and 52 percent from the prior 4-week average. Increases reported for Vietnam (10,800 grain splits and 10,200 unsplit), Italy (9,500 unsplit), Taiwan (1,700 grain splits), China (1,300 grain splits and decreases of 100 unsplit), and Mexico (100 grain split), were offset by reductions for Brazil (100 grain splits) and Thailand (100 unsplit). Exports of 46,700 wet blues for 2020 were down 40 percent from the previous week and 42 percent from the prior 4-week average. The destinations were primarily to China (15,900 unsplit), Thailand (7,900 unsplit), Vietnam (7,700 unsplit), Italy (6,400 unsplit), and Brazil (6,400 grain splits). Net sales of 698,900 splits were for Vietnam, including decreases of 21,100 pounds. Exports of 80,000 pounds were to Vietnam.
Beef: Net sales of 9,500 MT reported for 2020 were down 23 percent from the previous week and 51 percent from the prior 4-week average. Increases were primarily for Japan (2,900 MT, including decreases of 500 MT), South Korea (2,300 MT, including decreases of 500 MT), China (1,000 MT), Mexico (700 MT), and Taiwan (600 MT, including decreases of 100 MT). Exports of 15,100 MT were up 3 percent from the previous week and 15 percent from the prior 4-week average. The destinations were primarily to South Korea (5,400 MT), Japan (4,500 MT), Taiwan (1,200 MT), Canada (1,100 MT), and Hong Kong (1,000 MT).
Pork: Net sales of 31,500 MT reported for 2020 were down 20 percent from the previous week, but up 6 percent from the prior 4-week average. Increases were primarily for Mexico (9,100 MT, including decreases of 300 MT), China (8,100 MT, including decreases of 4,500 MT), Japan (5,300 MT, including decreases of 200 MT), Vietnam (2,000 MT), and Canada (1,700 MT, including decreases of 400 MT). Exports of 33,500 MT were up 8 percent from the previous week and 7 percent from the prior 4-week average. The destinations were primarily to China (12,700 MT), Mexico (10,300 MT), Japan (3,000 MT), South Korea (2,300 MT), and Canada (2,200 MT).
July 9, 2020 1 FOREIGN AGRICULTURAL SERVICE/USDA
SUMMARY OF EXPORT TRANSACTIONS
REPORTED UNDER THE DAILY SALES REPORTING SYSTEM
FOR PERIOD ENDING JULY 2, 2020
COMMODITY DESTINATION QUANITY (MT) MARKETING YEAR
CORN CHINA 404,000 MT 1/ 2020/2021
CORN MEXICO 121,920 MT 1/ 2020/2021
CORN MEXICO 60,960 MT 1/ 2021/2022
SOYBEANS CHINA 264,000 MT 1/ 2019/2020
SOYBEANS CHINA 126,000 MT 1/ 2020/2021
1/ Export sales.
U.S. EXPORT SALES FOR WEEK ENDING 7/2/2020
|
|
CURRENT MARKETING YEAR |
NEXT MARKETING YEAR |
||||||
|
COMMODITY |
NET SALES |
OUTSTANDING SALES |
WEEKLY EXPORTS |
ACCUMULATED EXPORTS |
NET SALES |
OUTSTANDING SALES |
||
|
CURRENT YEAR |
YEAR |
CURRENT YEAR |
YEAR |
|||||
|
|
THOUSAND METRIC TONS |
|||||||
|
WHEAT |
|
|
|
|
|
|
|
|
|
HRW |
61.9 |
1,825.6 |
1,664.9 |
169.3 |
1,007.8 |
1,359.7 |
0.0 |
0.0 |
|
SRW |
149.6 |
610.8 |
797.1 |
49.7 |
117.9 |
228.6 |
-75.0 |
0.0 |
|
HRS |
86.0 |
1,583.8 |
1,309.1 |
123.3 |
587.5 |
555.5 |
0.0 |
0.0 |
|
WHITE |
28.4 |
1,105.5 |
955.6 |
21.8 |
411.1 |
404.0 |
0.0 |
0.0 |
|
DURUM |
0.2 |
179.0 |
157.2 |
46.2 |
131.2 |
55.3 |
0.0 |
0.0 |
|
TOTAL |
326.1 |
5,304.7 |
4,883.9 |
410.1 |
2,255.5 |
2,603.2 |
-75.0 |
0.0 |
|
BARLEY |
0.0 |
40.2 |
46.7 |
0.2 |
1.5 |
5.0 |
0.0 |
0.0 |
|
CORN |
599.2 |
7,945.8 |
5,395.5 |
1,084.3 |
34,966.9 |
44,025.5 |
409.3 |
4,302.3 |
|
SORGHUM |
53.9 |
846.2 |
225.3 |
51.1 |
3,364.3 |
1,395.8 |
137.0 |
593.0 |
|
SOYBEANS |
952.2 |
8,229.8 |
10,059.9 |
467.5 |
37,765.0 |
38,472.4 |
382.1 |
7,318.9 |
|
SOY MEAL |
124.4 |
1,905.6 |
2,303.1 |
311.7 |
9,282.1 |
9,015.2 |
73.5 |
442.4 |
|
SOY OIL |
28.9 |
239.7 |
148.3 |
2.1 |
978.5 |
665.1 |
0.0 |
11.0 |
|
RICE |
|
|
|
|
|
|
|
|
|
L G RGH |
18.5 |
99.2 |
232.6 |
0.9 |
1,318.4 |
1,255.9 |
0.0 |
57.0 |
|
M S RGH |
0.0 |
23.6 |
15.0 |
0.4 |
72.9 |
88.4 |
0.0 |
5.7 |
|
L G BRN |
0.1 |
11.2 |
2.5 |
0.3 |
57.2 |
39.0 |
0.0 |
0.0 |
|
M&S BR |
0.1 |
31.6 |
0.1 |
0.1 |
87.4 |
152.4 |
0.0 |
0.0 |
|
L G MLD |
1.3 |
55.6 |
203.3 |
4.3 |
834.9 |
793.3 |
0.0 |
0.0 |
|
M S MLD |
1.7 |
115.7 |
129.0 |
15.0 |
625.2 |
525.1 |
0.0 |
0.1 |
|
TOTAL |
21.6 |
336.9 |
582.6 |
21.1 |
2,996.0 |
2,854.0 |
0.0 |
62.7 |
|
COTTON |
|
THOUSAND RUNNING BALES |
||||||
|
UPLAND |
43.8 |
4,156.3 |
3,349.6 |
329.3 |
12,880.4 |
11,966.4 |
6.7 |
3,496.8 |
|
PIMA |
2.8 |
121.5 |
112.2 |
7.3 |
455.7 |
616.7 |
3.6 |
37.5 |
Terry Reilly
Senior Commodity Analyst – Grain and Oilseeds
Futures International │190 S LaSalle St., Suite 410│Chicago, IL 60603
W: 312.604.1366
AIM: fi_treilly
ICE IM: treilly1
Skype: fi.treilly

Trading of futures, options, swaps and other derivatives is risky and is not suitable for all persons. All of these investment products are leveraged, and you can lose more than your initial deposit. Each investment product is offered only to and from jurisdictions where solicitation and sale are lawful, and in accordance with applicable laws and regulations in such jurisdiction. The information provided here should not be relied upon as a substitute for independent research before making your investment decisions. Futures International, LLC is merely providing this information for your general information and the information does not take into account any particular individual’s investment objectives, financial situation, or needs. All investors should obtain advice based on their unique situation before making any investment decision. The contents of this communication and any attachments are for informational purposes only and under no circumstances should they be construed as an offer to buy or sell, or a solicitation to buy or sell any future, option, swap or other derivative. The sources for the information and any opinions in this communication are believed to be reliable, but Futures International, LLC does not warrant or guarantee the accuracy of such information or opinions. Futures International, LLC and its principals and employees may take positions different from any positions described in this communication. Past results are not necessarily indicative of future results.