PDF attached


Good
morning.


WASHINGTON,
September 2, 2021—Private exporters reported to the U.S. Department of Agriculture export sales of 126,000 metric tons of soybeans for delivery to China during the 2021/2022 marketing year.


Export
sales for new-crop soybeans and soybean meal were every good.  Corn is lower for the fourth consecutive session while soybeans traded two-sided several times overnight.  Soybean oil is higher led by a 65 MYR increase in Malaysian palm oil overnight.  Cash
palm was up $5.00/ton at $1095/ton.  Soybean meal is lower, but losses are limited on steady US domestic feed demand and the slowdown in the US summer crush.  China soybean complex futures were mixed.  Wheat is mixed.  Traders are wondering if USDA will make
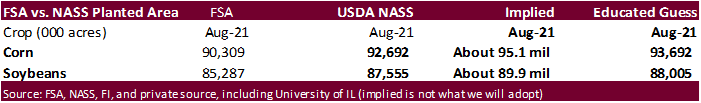
changes to its US acreage in the upcoming September Crop Production report after NASS issued a press release yesterday hinting, they may review and incorporate data issued by the FSA office’s Prevented Planting report issued mid-August.  We think corn and
soybean acres could be revised higher.  An upward revision of 500 to 1000 thousand acres for corn and 200 to 450 thousand acres for soybeans could be bearish if USDA leaves unchanged or increases yields on September 10.  Trade estimates may be out as early
as Friday night and with the long holiday weekend, look for some traders to take positions off the table before Friday’s close.  Late yesterday afternoon we heard the lower Mississippi river is starting to reopen now that some power had been restored. 


Weather

Map

Description automatically generated


Map

Description automatically generated


Map

Description automatically generated


WORLD
WEATHER INC.

WORLD
WEATHER HIGHLIGHTS FOR SEP. 2, 2021

  • Rain
    will fall in the U.S. Dakotas, Nebraska and western parts of Minnesota today and Friday as remnants of Tropical Cyclone Nora reach the area.
  • Remnants
    of Tropical Depression Ida produced some heavy rain in the northeastern U.S. 

  • Many
    U.S. Midwest and Great Plains crop areas along with some in the Delta and southeastern states will experience net drying after this weekend for much of next week.
  • A
    tropical disturbance may reach the Gulf of Mexico late next week and will be closely monitored for influence on the central Gulf coast in the following weekend.
  • Northwestern
    India received rain this week and it will get more next week with Gujarat the primary recipient.
  • Not
    much change in the rest of the world overnight.
    • Eastern
      Australia will get some rain this weekend and early next week
    • many
      areas in the CIS from the Ural Mountain region into far eastern Europe will get some periodic rainfall over the coming week.
    • Western
      Europe will turn wetter this weekend especially next week.
    • China
      will remain wet through the weekend, but next week looks drier

Source:
World Weather Inc. 


Bloomberg
Ag Calendar

Thursday,
Sept. 2:

  • FAO
    World Food Price Index
  • USDA
    weekly crop net-export sales for corn, soybeans, wheat, cotton, pork, beef, 8:30am
  • Port
    of Rouen data on French grain exports
  • HOLIDAY:
    Vietnam

Friday,
Sept. 3:

  • ICE
    Futures Europe weekly commitments of traders report (6:30pm London)
  • CFTC
    commitments of traders weekly report on positions for various U.S. futures and options, 3:30pm
  • FranceAgriMer
    weekly update on crop conditions
  • HOLIDAY:
    Vietnam

Source:
Bloomberg and FI


USDA
export Sales

USDA
export sales for new-crop soybeans were better than expected at 2.133 million tons that included 1.264 million tons for China, 654,000 tons for unknown and 88,700 tons for Mexico.  Old crop sales were positive 68,200 tons.  Soybean meal sales were very good
for new-crop at 396,600 tons and shipment were 188,800 tons.  New-crop meal sales included Colombia (104,000 MT),the Philippines (90,000 MT), unknown destinations (48,200 MT), and Romania(45,000 MT).  SBO net sales were 4,100 tons old crop and 700 tons new. 
Corn sales of negative 300,800 tons are not uncommon for this late in the crop year for 2020-21.  New-crop corn of 1.160 million tons were within expectations and included Mexico(464,500 MT), Colombia (352,000 MT), and Canada (292,600 MT).  All-wheat sales
rebounded from the marketing low reported last week to 295,300 tons.  Pork sales were a large 33,500 tons. 


Macros

US
Initial Jobless Claims Aug 28: 340K (est 345K; prevR 354K; prev 353K)

US
Continuing Claims Aug 21: 2748K (est 2808K; prevR 2908K; prev 2862K)

US
Nonfarm Productivity Q2 F: 2.1% (est 2.5%; prev 2.3%)

US
Unit Labour Costs Q2 F: 1.3% (est 0.9%; prev 1.0%)

US
Trade Balance (USD) Jul: -70.1B (est -70.9B; prev -75.7B)

Canadian
Building Permits (M/M) Jul: -3.9% (est 1.5%; prevR 7.2%; prev 6.9%)

Canadian
International Merchandise Trade Jul: 0.78B (est 1.70B; prevR 2.56B; prev 3.20B)

Crude-oil
production from OPEC members increased by 290,000 barrels per day in Aug., according to the latest Bloomberg survey


Corn

·        
Corn is lower but good export sales should limit losses.  We may see technical buying today as traders shore up recent (new) short positions ahead of the long holiday weekend. 

·        
We heard NOLA is starting to reopen, or at least preparing to reopen now that some of the power had been restored.  But some companies might not be able to restore grain service for weeks because of damage.  CHS mentioned they
may shift demand to the PNW over the short term. 

·        
USDA’s Broiler Report showed eggs type eggs set in the US up 2 percent and chicks placed down slightly.  Cumulative placements from the week ending January 9, 2021 through August 28, 2021 for the United States were 6.35 billion.
Cumulative placements were up slightly from the same period a year earlier.

·        
Weekly US ethanol production fell for the eighth consecutive week, longest streak since the pandemic.  For the week ending August 27, it was off 28,000 barrels to 905,000 barrels (trade was looking down 7,000), lowest level since
2/26/21.  Ethanol stocks fell for the fifth consecutive week by 113,000 barrels to 21.110 million barrels (trade was looking for a 77,000 barrel decrease).

·        
USDA NASS corn for ethanal demand was less than the trade average at 449 million bushels, up from 440 million for June and 424 million for July 2020. 

·        
StoneX estimated the 2021-22 Brazil first corn crop at 29.8 million tons (unchanged from prior) and second crop at 59.1 million (59.6 previously). 


Export
developments.

·        
China will auction off 111,321 tons of imported US corn and 13,180 tons of imported Ukrainian corn on September 3. 


Soybeans

·        
Soybeans traded two-sided overnight and are higher post export sales.  Sales for soybeans and meal knocked it out of the ballpark.  Soybean oil is following palm higher.  Meal should see limited losses on confirmation the US summer
quarter crush is down a large amount from the previous year. 

·        
China may have bought a couple cargoes of soybeans overnight, but these purchases are seen as “one offs.”   Later this morning USDA reported private exporters sold 126,000 tons of soybean to China. 

·        
Brazilian basis is firming rather quickly.  We are hearing Brazil exporters are scrambling to boost exports as US Gulf export supplies are thin, and Brazilian domestic crushers are paying more for soybeans than exporters to secure
supplies. 

·        
China crush margins have improved over the past three weeks and they are starting to stabilize somewhat and are near levels that should increase import interest. 

·        
Offshore values this morning were leading soybean oil 74 points higher and meal $1.50 higher.

·        
Malaysian palm oil

·        
China cash crush margins were last positive 110 cents on our analysis (105 previous) versus 121 cents late last week and 80 cents around a year ago. 

·        
China

·        
Argentina producers sold 38.7 million tons of corn from the 2020-21 crop, about 3 million tons above a year earlier. 

·        
StoneX estimated the 2021-22 Brazil new-crop soybean production at 143.3 million tons (unchanged from prior). 


Export
Developments

  • USDA
    reported private exporters sold 126,000 tons of soybean to China.
  • Egypt’s
    GASC saw offers for vegetable oils of $1332/ton c&f for soybean oil and $1242.36/ton c&f for sunflower oil (lowest offers).  They seek at least 30,000 tons of soyoil and 10,000 tons of sunflower oil for arrival between October 20-November 5.  At sight and
    180-day letters of credit was considered. 
  • India
    was estimated to have bought about 250,000 tons of soybeans meal, including 15,000 tons that as already shipped out a couple months ago but bought back at a higher price.  Most of the soybean meal bought will originate from Argentina and some cargoes from
    neighboring Asian countries.


Wheat

·        
US wheat is mixed early this morning.  Algeria bought more wheat than initially than reported.  Lack of high quality wheat offered in various recent tenders is starting to get importers nervous after EU production countries saw
damage from heavy rains during harvest time. 

·        
The USD was near flat at the time this was written. 

·        
December Paris wheat was up 1.00 euros at 243.75. 


Export
Developments. 

·        
Turkey started buying wheat and may have secured 200,000 tons out of the 300,000 tons of milling wheat sought for September 10 through October 10 shipment.  Prices ranged from $327.90 to $341.00 per ton c&f.  They last bought
11.5% and 12.5% wheat on August 4 at $297.40-$308.90/ton c&f. 

·        
Jordan saw two participants for 120,000 tons of feed barley they seek for LH October through FH December shipment.

·        
Yesterday it was reported Algeria bought around 460,000 to 490,000 tons of wheat and prices were reported at $353-$356.60/ton c&f.  They are in for October shipment. 

·        
Results awaited: Bangladesh seeks 50,000 tons wheat.

·        
Taiwan weeks 48,875 tons of US wheat on September 3 for October 15-Novmeber 1 shipment.  They last bought US wheat on August 6, various classes at various prices. 

·        
Turkey seeks 245,000 tons of animal feed barley on September 7 for Sep 15-Oct 8 shipment. 

·        
Pakistan seeks 550,000 tons of wheat on September 7 for October through November shipment. 

·        
Mauritius seeks 47,000 tons of wheat flour, optional origin, on Sept. 21 for various 2022 shipment.


Rice/Other

  • South
    Korea seeks 42,200 tons of rice for arrival in South Korea between February 28 and April 2022.  20,000 tons of that is of US origin, rest optional .


U.S. EXPORT SALES FOR WEEK ENDING  8/26/21


CURRENT MARKETING YEAR

NEXT MARKETING YEAR

COMMODITY

NET SALES

OUTSTANDING SALES

WEEKLY EXPORTS

ACCUMULATED EXPORTS

NET SALES

OUTSTANDING SALES

CURRENT YEAR

YEAR
AGO

CURRENT YEAR

YEAR
AGO


THOUSAND METRIC TONS

WHEAT


   HRW    

146.7

1,494.1

1,863.1

125.5

1,904.3

2,849.5

0.0

0.0

   SRW    

12.7

738.2

626.8

116.1

873.9

461.8

0.0

0.0

   HRS     

64.3

1,072.8

1,984.5

113.3

1,574.6

1,718.8

0.0

0.0

   WHITE   

71.6

682.5

1,182.4

62.2

1,032.3

1,138.5

0.0

0.0

   DURUM  

0.0

7.4

273.9

0.0

43.2

213.3

0.0

0.0

     TOTAL

295.3

3,995.0

5,930.7

417.1

5,428.3

6,381.8

0.0

0.0

BARLEY

-0.1

21.4

30.8

0.0

3.9

8.4

0.0

0.0

CORN

-300.8

3,321.4

1,965.3

529.3

66,701.9

42,622.2

1,159.5

20,442.2

SORGHUM

2.4

226.1

107.9

72.4

6,910.9

4,529.2

0.0

1,594.9

SOYBEANS

68.2

1,940.7

3,517.5

324.0

60,287.4

43,785.1

2,132.5

17,747.5

SOY MEAL

17.7

1,235.7

1,238.6

188.8

10,844.2

10,920.3

396.6

2,058.1

SOY OIL

4.1

20.3

138.3

3.9

670.3

1,134.6

0.7

1.4

RICE


   L G RGH

15.0

221.2

169.3

3.7

90.6

50.6

0.0

0.0

   M S RGH

0.0

8.6

27.5

0.2

0.5

1.4

0.0

0.0

   L G BRN

0.2

1.4

8.1

0.6

11.5

2.6

0.0

0.0

   M&S BR

13.3

22.3

22.3

13.3

13.6

9.7

0.0

0.0

   L G MLD

19.8

168.6

69.3

18.6

71.5

16.4

0.0

0.0

   M S MLD

1.2

55.3

39.5

2.1

29.4

49.1

0.0

0.0

     TOTAL

49.5

477.5

336.0

38.6

217.2

129.8

0.0

0.0

COTTON


THOUSAND RUNNING BALES      

   UPLAND

105.2

4,787.1

5,731.7

168.6

782.1

1,251.5

23.8

667.3

   PIMA

14.5

129.0

188.8

4.7

24.1

36.4

0.0

0.0


This
summary is based on reports from exporters for the period August 20-26, 2021.

Wheat:  Net
sales of 295,300 metric tons (MT) for 2021/2022 were up noticeably from the previous week and up 15 percent from the prior 4-week average.  Increases primarily for Mexico (103,900 MT, including decreases of 600 MT), Japan (92,400 MT, including decreases of
600 MT), Nigeria (70,000 MT, including 30,000 MT switched from unknown destinations), China (58,000 MT, including 60,000 MT switched from unknown destinations and decreases of 2,000 MT), and the Philippines (45,800 MT), were offset by reductions for unknown
destinations (100,000 MT) and Brazil (50,000 MT).  Exports of 417,100 MT were down 38 percent from the previous week and 27 percent from the prior 4-week average.  The destinations were primarily to Mexico (146,900 MT), the Philippines (63,800 MT), China (58,500
MT), Thailand (33,500 MT), and Nigeria (32,000 MT).

Corn: 
Net sales reductions of 300,800 MT for 2020/2021–a marketing-year low–were greater than the previous week, but down noticeably from the prior 4-week average.  Increases primarily for Mexico (33,000 MT, including decreases of 7,700 MT), Guatemala (27,100
MT, including 22,500 MT switched from El Salvador, 7,500 MT switched from Costa Rica, and decreases of 2,900 MT), Taiwan (8,800 MT), South Korea (1,900 MT), and Colombia (1,400 MT, including decreases of 26,000 MT), were more than offset by reductions primarily
for Canada (209,800 MT) and China (133,200 MT).  For 2021/2022, net sales of 1,159,500 MT primarily for Mexico (464,500 MT), Colombia (352,000 MT), Canada (292,600 MT), Japan (40,000 MT), and Taiwan (7,400 MT), were offset by reductions for unknown destinations
(1,900 MT).  Exports of 529,300 MT were down 30 percent from the previous week and 48 percent from the prior 4-week average.  The destinations were primarily to Mexico (258,700 MT), China (138,700 MT), Guatemala (34,600 MT), Colombia (30,400 MT), and Costa
Rica (29,600 MT). 

Optional
Origin Sales:
 
For 2020/2021, the current outstanding balance of 30,500 MT is for unknown destinations.  For 2021/2022, the current outstanding balance of 110,000 MT is for unknown destinations.

Barley: 
Total net sales reductions for 2021/2022 of 100 MT were for Canada.  There were no exports reported for the week.

Sorghum: 
Total net sales of 2,400 MT for 2020/2021 were down 96 percent from the previous week and down noticeably from the prior 4-week average.  The destination for China.  Exports of 72,400 MT were down 43 percent from the previous week and 4 percent from the prior
4-week average.  The destination was to China.

Rice:
 Net
sales of 49,500 MT for 2021/2022 were primarily for Haiti (15,200 MT, including decreases of 100 MT), Honduras (15,000 MT), Japan (12,500 MT), Canada (2,500 MT), and Saudi Arabia (1,400 MT).  Exports of 38,600 MT were primarily to Haiti (15,200 MT), Japan
(12,500 MT), Mexico (4,800 MT), Canada (2,200 MT), and Saudi Arabia (1,900 MT). 

Exports
for Own Account:
 
For
2021/2022, exports for own account totaling 100 MT to Canada were applied to new or outstanding sales.

Soybeans: 
Net sales of 68,200 MT for 2020/2021 were down 9 percent from the previous week, but up 9 percent from the prior 4-week average.  Increases primarily for the Netherlands (86,200 MT, including 84,000 MT switched from unknown destinations and decreases of 3,800
MT), China (26,200 MT), Taiwan (17,200 MT), Indonesia (7,400 MT, including decreases of 100 MT), and Malaysia (5,800 MT, including decreases of 100 MT), were offset by reductions for unknown destinations (84,000 MT).  For 2021/2022, net sales of 2,132,500
MT were primarily for China (1,264,000 MT), unknown destinations (654,000 MT), Mexico (88,700 MT), Egypt (50,000 MT), and Taiwan (32,000 MT).  Exports of 324,000 MT were up 25 percent from the previous week and 50 percent from the prior 4-week average.  The
destinations were primarily to Mexico (111,000 MT), the Netherlands (86,200 MT), China (71,600 MT), Costa Rica (16,800 MT), and Indonesia (9,800 MT).

Exports
for Own Account

For 2020/2021, the current exports for own account outstanding balance is 5,800 MT, all Canada.

Soybean
Cake and Meal:
 
Net sales of 17,700 MT for 2020/2021–a marketing-year low–were down 71 percent from the previous week and 82 percent from the prior 4-week average.  Increases primarily for Mexico (19,600 MT), Canada (9,300 MT, including decreases of 700 MT), Taiwan (7,400
MT, including decreases of 100 MT), Guatemala (6,700 MT, including 6,100 MT switched from El Salvador), and Vietnam (5,600 MT), were offset by reductions primarily for Romania (45,000 MT). 
For 2021/2022, net sales of 396,600 MT were primarily for Colombia (104,000 MT), the Philippines (90,000 MT), unknown destinations (48,200 MT), Romania (45,000 MT), and Ecuador (30,000 MT). 
Exports of 188,800 MT were down 21 percent from the previous week and 15 percent from the prior 4-week average.  The destinations were primarily to Vietnam (50,000 MT), Ecuador (32,500 MT), Canada (21,800 MT), Colombia (19,000 MT), and Mexico (18,300 MT). 

Soybean
Oil:
 
Net sales of 4,100 MT for 2020/2021 were up 39 percent from the previous week and up noticeably from the prior 4-week average.  Increases reported for Venezuela (3,000 MT), Honduras (1,000 MT), and Canada (100 MT).  Total net sales for 2021/2022 of 700 MT
were for Canada.  Exports of 3,900 MT were up noticeably from the previous week and from the prior 4-week average.  The destinations were to Jamaica (3,500 MT), Canada (300 MT), and Mexico (100 MT).

Cotton: 
Net sales of 105,200 RB for 2021/2022 were primarily for Pakistan (27,600 RB), Vietnam (17,200 RB, including decreases of 8,800 RB), Turkey (14,400 RB), Ecuador (8,800 RB), and China (8,400 RB).  Total net sales for 2022/2023 of 23,800 RB were for Turkey. 
Exports of 168,600 RB were primarily to Turkey (33,400 RB), China (33,000 RB), Vietnam (25,000 RB), Pakistan (18,900 RB), and Bangladesh (17,400 RB).  Net sales of Pima totaling 14,500 RB were primarily for Peru (6,300 RB), India (6,200 RB), Austria (500 RB),
Taiwan (400 RB), and Egypt (400 RB).  Exports of 4,700 RB were primarily to India (2,200 RB), China (1,200 RB), Honduras (800 RB), Peru (300 RB), and Guatemala (100 RB).

Optional
Origin Sales:
 
For 2021/2022, the current outstanding balance of 8,800 RB is for Pakistan. 

Exports
for Own Account

For 2021/2022, the current exports for own account outstanding balance of 4,800 RB is for China (4,700 RB) and Vietnam (100 RB).

Hides
and Skins:
 
Net sales of 324,500 pieces for 2021 were up 41 percent from the previous week and 28 percent from the prior 4-week average.  Increases primarily for China (211,700 whole cattle hides, including decreases of 7,200 pieces), South Korea (34,400 whole cattle
hides, including of 1,600 pieces), Mexico (32,200 whole cattle hides, including decreases of 200 pieces), Brazil (19,500 whole cattle hides), and Thailand (16,900 whole cattle hides, including decreases of 500 pieces), were offset by reductions for Indonesia
(100 pieces).  Exports of 425,700 pieces were down 22 percent from the previous week, but up 3 percent from the prior 4-week average.  Whole cattle hides exports were primarily to China (295,300 pieces), South Korea (70,000 pieces), Thailand (14,800 pieces),
Mexico (10,600 pieces), and Indonesia (10,200 pieces). 

Net
sales of 206,400 wet blues for 2021 were up 70 percent from the previous week and 97 percent from the prior 4-week average.  Increases were primarily for Italy (107,500 unsplit, 19,100 grain splits, including decreases of 200 unsplit and 100 grain splits),
China (23,300 unsplit, including decreases of 100 unsplit), Thailand (23,000 unsplit), Vietnam (16,300 unsplit), and Mexico (10,200 grain splits).  Exports of 126,600 wet blues were down 40
percent
from the previous week and 14 percent from the prior 4-week average.  The destinations were to China (34,500 unsplit and 4,700 grain splits), Italy (37,300 unsplit and 1,900 grain splits), Vietnam (22,100 unsplit), Taiwan (10,400 unsplit), and Thailand (8,900
unsplit).  Net sales of 251,600 splits were reported primarily for Taiwan (210,700 pounds).  Exports of 490,700 pounds were primarily to Taiwan (168,700 pounds) and China (161,900 pounds). 

Beef: 
Net
sales of 15,600 MT reported for 2021 were up 49 percent from the previous week and 24 percent from the prior 4-week average.  Increases were primarily for South Korea (7,300 MT, including decreases 500 MT), Taiwan (3,100 MT, including decreases of 100 MT),
Japan (2,800 MT, including decreases of 500 MT), China (600 MT, including decreases of 800 MT), and Mexico (500 MT, including decreases of 100 MT).  Exports of 18,100 MT were down 3 percent from the previous week and 6 percent from the prior 4-week average. 
The destinations were primarily to South Korea (5,200 MT), Japan (4,600 MT), China (3,900 MT), Mexico (1,200 MT), and Taiwan (1,200 MT).

Pork: 
Net
sales of 33,500 MT reported for 2021 were up 39 percent from the previous week and 38 percent from the prior 4-week average.  Increases primarily for Mexico (21,200 MT, including decreases of 600 MT), Colombia (4,200 MT, including decreases of 300 MT), Japan
(3,000 MT, including decreases of 100 MT), China (2,000 MT, including decreases of 400 MT), and Canada (1,000 MT, including decreases of 400 MT), were offset by reductions for Vietnam (100 MT).  Exports of 28,200 MT were down 6 percent from the previous week
and 2 percent from the prior 4-week average.  The destinations were primarily to Mexico (13,200 MT), China (4,700 MT), Japan (3,900 MT), South Korea (1,500 MT), and Canada (1,200 MT). 

September
2, 2021                                         1                FOREIGN AGRICULTURAL SERVICE/USDA


Terry Reilly

Senior Commodity Analyst – Grain and Oilseeds

Futures International
One Lincoln Center
18 W 140 Butterfield Rd.

Oakbrook Terrace, Il. 60181

W: 312.604.1366

treilly@futures-int.com

ICE IM: 
treilly1

Skype: fi.treilly


Description: Description: Description: Description: FImail


Trading of futures, options, swaps and other derivatives is risky and is not suitable for all persons.  All of these investment products are leveraged, and you can lose more than your initial deposit.  Each investment product is offered
only to and from jurisdictions where solicitation and sale are lawful, and in accordance with applicable laws and regulations in such jurisdiction.  The information provided here should not be relied upon as a substitute for independent research before making
your investment decisions.  Futures International, LLC is merely providing this information for your general information and the information does not take into account any particular individual’s investment objectives, financial situation, or needs.  All investors
should obtain advice based on their unique situation before making any investment decision.  The contents of this communication and any attachments are for informational purposes only and under no circumstances should they be construed as an offer to buy or
sell, or a solicitation to buy or sell any future, option, swap or other derivative.  The sources for the information and any opinions in this communication are believed to be reliable, but Futures International, LLC does not warrant or guarantee the accuracy
of such information or opinions.  Futures International, LLC and its principals and employees may take positions different from any positions described in this communication.  Past results are not necessarily indicative of future results.