PDF attached
https://s.w-x.co/staticmaps/wu/wu/satir1200_cur/usase/animate.png
USDA
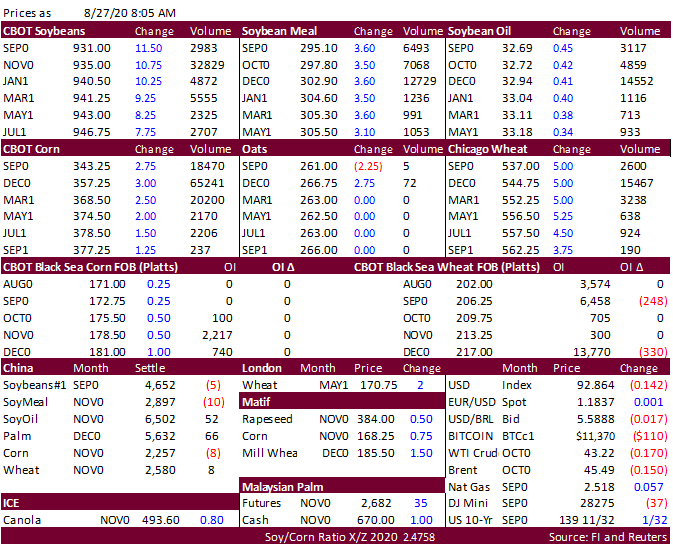
reported sales of 747,000 tons of corn to China and 140,000 tons to unknow, both for new-crop. There were no major surprises in the USDA export sales report. US agricultures futures are higher on follow through buying related to US, EU, and Black Sea crop
concerns. South Korea bought feed wheat and soybean meal overnight. Taiwan bought US wheat and Japan bought food wheat. Brazil plans to relax on some agriculture import tariffs over the short term. China buying of US soybeans slowed on Wednesday with at
least one cargo trading out of the Gulf. Argentina soybean inspectors planned a 36-hour strike starting Friday over wages. For the first time this season, China corn reserve sales failed to reach 100 percent. China sold 89 percent of the total offered at
auction, or 3.547 million tons out of 3.989 million offered.
![]()
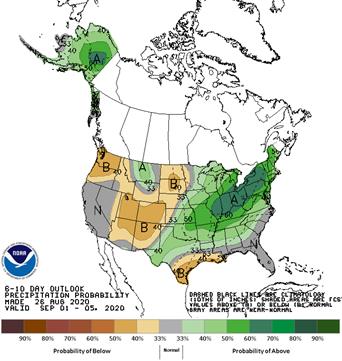
6-10-day
precipitation