PDF attached


Morning. 

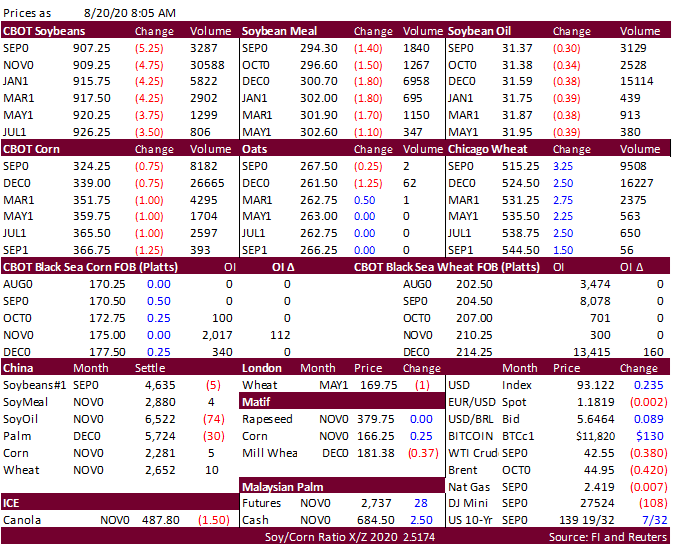
USD
is higher by 19 points and WTI crude lower by 66 cents. No USDA 24-hour sales were posted.  Pro Farmer crop tour early results are showing glowing corn yields and high pod counts for areas outside of storm ravaged Iowa.  Weather models are showing a good warmup
for the US Midwest late this weekend into early next week, with precipitation limited over the next week.  Malaysia is on holiday and China vegetable oil prices were lower.  Offshore values are favoring CBOT soybean meal over soybean oil. 
China
sold just over 4 million tons of corn from reserves at an average price of 1,959 yuan per ton.  Japan bought 117,063 tons of food wheat.  China sold another 4 million tons of corn out of reserves. 


Weather
and Crop Progress


7-day Total Precipitation (millimeters)


Bloomberg
Ag Calendar

THURSDAY,
August 20:

  • USDA
    weekly crop net-export sales for corn, soybeans, wheat, cotton, pork, beef, 8:30am
  • Brazil
    Conab sugar, cane and ethanol production
  • Port
    of Rouen data on French grain exports
  • China
    International Cereals and Oils Industry Summit
  • USDA
    red meat production, 3pm
  • HOLIDAY:
    Malaysia
  • EARNINGS:
    Cherkizovo

FRIDAY,
August 21:

  • ICE
    Futures Europe weekly commitments of traders report, 1:30pm (6:30pm London)
  • CFTC
    commitments of traders weekly report on positions for various U.S. futures and options, 3:30pm
  • FranceAgriMer
    weekly update on crop conditions
  • China
    International Cereals and Oils Industry Summit, day 2
  • Malaysia
    palm oil export data for August 1-20
  • U.S.
    cattle on feed, 3pm

Source:
Bloomberg and FI


USDA
export sales

showed net reductions for current crop-year for soybean oil and soybeans.  New-crop soybeans were excellent at 2.57 million tons but new-crop soybean oil were zero.  Soybean meal sales were light.  Corn export sales were thin for old crop and new-crop were
within expectations.  All-wheat sales were within expectations.  Pork sales were good at 20,600 tons.  Sorghum sales were 122,000 tons for new-crop.  Overall, the USDA export sales report might weigh on soybean oil futures prices and


Macros

US
Philly Fed Business Outlook Aug: 17.2 (est 20.8; prev 24.1)

US
Initial Jobless Claims Aug 15: 1106K (est 920K; prevR 971K; prev 963K)

US
Continuing Claims Aug 8: 14844K (est 15000K; prevR 15480K; prev 15486K)


Corn.

  • US
    corn futures are lower on ongoing reports of good US corn yields for states outside storm damaged IA.  Western IA crop conditions are below average. 
  • China
    corn futures are still near a 5-year high. 
  • The
    Pro Farmer crop tour:
    • Day
      3…Western IA – below average  
    • Day
      3…Illinois – 189.4 vs. 171.2 for 2019 and 181.5 average
    • Day
      2…Nebraska –  175.15 vs. 172.55 for 2019 and 172.38 average
    • Day
      2…Indiana – 179.84 vs. 161.46 for 2019 and 171.67 average
    • Day
      1…Ohio – 167.69 vs. 154.35 for 2019 and 166.18 average
    • Day
      1…South Dakota – 179.24 vs. 154.08 for 2019 and 160.02 average

  • USD
    was up 7 points as of around 6:26 AM CT.   
  • Argentina’s
    BA Grains Exchange sees 2020-21 corn plantings at 6.2 million hectares, below 6.3 million planted last year. 
  • China
    plans to sell 10,000 tons of pork from state reserves on August 21.  About 500,000 tons have been sold so far this season. 
  • The
    USDA Broiler Report showed US eggs set in the US down slightly and chicks placed down 3 percent.  Cumulative placements from the week ending January 4, 2020 through August 15, 2020 for the United States were 6.14 billion. Cumulative placements were down 1
    percent from the same period a year earlier. 
  • Weekly
    US ethanol production improved 8,000 barrels from the previous week to 926,000 barrels, just shy of the September 2019 to date average of 929,000 barrels, 10 percent below the week average for the 2018-19 Sep-Aug corn crop year.  US ethanol stocks grew a large
    520,000 barrels to 20.270 million, opposite from a predicted 444,000 barrel decrease the trade expected. 


Corn
Export Developments


Soybean
complex
.

  • The
    soybean complex is lower for the start of Thursday with soybeans in the lead, dropping from a 7-month high made on Wednesday. 
  • (Reuters)
    – China and the United States have agreed to hold trade talks “in the coming days” to evaluate the progress of their Phase 1 trade deal six months after it took effect in February, the Chinese commerce ministry said on Thursday.
  • The
    CME Group plans to launch a new South America soybean (PLATTS) futures contract on September 21. 
  • The
    Pro Farmer crop tour:
    • Day
      3… Western IA – below average  
    • Day
      3…Illinois – 1247.38 vs. 997.68 for 2019 and 1185.79 average
    • Day
      2…Nebraska – 1297.93 vs. 1210.83 for 2019 and 1213.64 average
    • Day
      2…Indiana – 1281.12 vs. 923.94 for 2019 and 1134.86 average
    • Day
      1…Ohio – 1155.68 pods vs. 764.01 for 2019 and 1039.74 average
    • Day
      1…South Dakota – 1250.86 pods vs. 832.85 for 2019 and 919.04 average
  • Rotterdam
    values this morning showed soybean oil for the Nov/Jan position was down 5-6 euros from this time previous session, rapeseed down 4 and soybean meal when imported from South America mostly higher.  

·        
Palm oil:  HOLIDAY

·        
AmSpec reported Aug 1-20 Malaysian palm exports at 925,083 tons, down 20.9 percent from July 1-20 of 1.171MMT.  

·        
ITS reported an 18.2 percent decrease to 946,338 tons. 


Oilseeds
Export Developments


Wheat


Export
Developments.

  • Results
    awaited: Pakistan seeks 1.5 million tons of wheat.  Lowest offer was $233.85/ton for 200,000 tons of milling wheat. 
  • Japan
    bought 117,063 tons of milling wheat.  

  • Turkey
    seeks 390,000 tons of red milling wheat and 110,000 tons of durum wheat on August 25.   They also seeks feed barley. 
    • Red
      wheat shipment period is between Sep 4 and Oct 10
    • Durum
      shipment period is between Sept. 15 and Oct. 10.
    • Feed
      barley shipment period is between Sept. 11 and Sept. 25.
  • Japan
    seeks 80,000 tons of feed wheat and 100,000 tons of feed barley (SBS) on August 26 for November 30 loading. 
  • Syria
    looks to sell and export 100,000 tons of feed barley with offers by Sep 1. 
  • Syria
    seeks 200,000 tons of soft wheat from EU/Russia on Sept. 9 and 200,000 tons of wheat from Russia on Sept. 14.


Rice/Other

·        
Results awaited: South Korea’s Agro-Fisheries & Food Trade Corp. seeks 60,556 tons of rice from Vietnam and other origins, on Aug. 19, for arrival in South Korea between Dec. 31,
2020, and February 28, 2021.


U.S. EXPORT SALES FOR WEEK ENDING 8/13/2020                        

                                                                                                                                                              FAX 202-690-3275


CURRENT MARKETING YEAR

NEXT MARKETING YEAR

COMMODITY

NET SALES

OUTSTANDING SALES

WEEKLY EXPORTS

ACCUMULATED EXPORTS

NET SALES

OUTSTANDING SALES

CURRENT YEAR

YEAR
AGO

CURRENT YEAR

YEAR
AGO


THOUSAND METRIC TONS

WHEAT


   HRW    

188.2

1,642.5

1,519.6

104.0

2,367.0

2,515.5

0.0

0.0

   SRW    

46.7

691.1

688.3

34.0

384.9

624.0

0.0

0.0

   HRS     

129.7

1,877.6

1,510.9

105.0

1,430.0

1,293.5

0.0

5.0

   WHITE   

90.6

1,244.8

947.0

164.0

1,012.0

878.1

0.0

0.0

   DURUM  

67.9

254.9

296.5

0.0

209.3

148.1

0.0

0.0

     TOTAL

523.0

5,710.9

4,962.3

406.9

5,403.2

5,459.3

0.0

5.0

BARLEY

0.0

31.1

46.5

0.3

8.2

10.2

0.0

0.0

CORN

61.6

3,002.5

2,172.4

1,197.0

41,218.9

47,930.9

723.3

12,203.6

SORGHUM

-4.6

289.1

85.0

48.5

4,340.0

1,639.8

122.0

1,845.1

SOYBEANS

-12.7

5,534.2

4,499.3

899.0

41,963.8

44,118.8

2,573.2

20,548.7

SOY MEAL

34.5

1,464.0

1,848.3

222.5

10,528.0

10,076.9

155.8

1,211.2

SOY OIL

-0.2

175.3

144.7

2.2

1,091.4

734.5

0.0

80.7

RICE


   L G RGH

2.3

144.8

272.5

22.3

26.7

92.8

0.0

0.0

   M S RGH

0.0

28.1

27.3

0.1

0.8

1.5

0.0

0.0

   L G BRN

0.9

9.0

1.1

0.8

1.5

1.3

0.0

0.0

   M&S BR

0.1

30.1

0.1

0.8

1.7

0.2

0.0

0.0

   L G MLD

18.7

54.8

190.5

2.7

6.0

84.0

0.0

0.0

   M S MLD

3.2

54.4

97.5

14.6

19.1

33.4

0.0

0.0

     TOTAL

25.2

321.2

589.0

41.2

55.8

213.2

0.0

0.0

COTTON


THOUSAND RUNNING BALES      

   UPLAND

128.0

5,995.0

7,247.8

421.5

700.1

690.9

4.9

321.1

   PIMA

16.7

181.2

125.6

8.5

14.1

23.1

0.0

0.0


Export Sales Highlights

This
summary is based on reports from exporters for the period August 7-13, 2020.


Wheat:  Net
sales of 523,000 metric tons (MT) for 2020/2021 were up 42 percent from the previous week, but down 8 percent from the prior 4-week average.  Increases primarily for the Philippines (182,900 MT), Brazil (90,000 MT), unknown destinations (86,000 MT), Mexico
(79,500 MT, including decreases of 11,000 MT), and Italy (65,800 MT, including 10,000 MT switched from unknown destinations and decreases of 100 MT), were offset by reductions for Indonesia (20,000 MT).  Exports of 406,900 MT were down 13 percent from the
previous week and 23 percent from the prior 4-week average.  The destinations were primarily to Japan (133,000 MT), Mexico (97,900 MT), Sri Lanka (65,500 MT), Yemen (47,200 MT), and South Korea (28,000 MT). 


Corn: 
Net sales of 61,600 MT for 2019/2020 were down 84 percent from the previous week and 63 percent from the prior 4-week average.  Increases primarily for Japan (70,200 MT, including 64,900 MT switched from unknown destinations), Colombia (52,300 MT, including
50,000 MT switched from unknown destinations and decreases of 8,400 MT), Guatemala (26,800 MT, including 32,000 MT switched from El Salvador and decreases of 4,800 MT), Mexico (10,600 MT, including decreases of 3,400 MT), and China (8,600 MT), were offset
by reductions for unknown destinations (87,600 MT), El Salvador (29,200 MT), and Peru (8,000 MT).  For 2020/2021, net sales of 723,300 MT were primarily for unknown destinations (365,100 MT), Mexico (94,800 MT), South Korea (66,200 MT), Japan (55,500 MT),
and Taiwan (41,300 MT).  Exports of 1,197,000 MT were down 10 percent from the previous week, but up 19 percent from the prior 4-week average.  The destinations were primarily to China (382,400 MT), Mexico (297,800 MT), Japan (210,000 MT), Colombia (112,000
MT), and Guatemala (98,700 MT). 

Optional Origin Sales: 
For 2019/2020, the current outstanding balance of 390,000 MT is for South Korea (260,000 MT), Vietnam (65,000 MT), and Taiwan (65,000 MT).  For 2020/2021, the current outstanding balance of 260,000 MT is for Vietnam (195,000 MT) and South Korea (65,000 MT).


Barley: 
No net sales for 2020/2021 were reported for the week.  Exports of 300 MT were down 93 percent from the previous week and 77 percent from the prior 4-week average.  The destination was Taiwan.


Sorghum: 
Net sales reductions of 4,600 MT for 2019/2020 were down noticeably from the previous week and from the prior 4-week average.  Increases reported for China (48,400 MT, including 48,500 MT switched from unknown destinations and decreases of 100 MT), were more
than offset by reductions for unknown destinations (53,000 MT).  For 2020/2021, net sales of 122,000 MT were reported for unknown destinations (68,000 MT) and China (54,000 MT).  Exports of 48,500 MT were down 90 percent from the previous week and 77 percent
from the prior 4-week average.  The destination was China.


Rice:
 Net sales of 25,200 MT for 2020/2021 were primarily for Haiti (15,300 MT), Mexico (5,000 MT), Canada (1,900 MT, including decreases of 300 MT), Saudi Arabia (1,800 MT), and South Korea (400 MT).  Exports of 41,200 MT were primarily to Mexico (23,300 MT),
Japan (12,000 MT), Canada (1,700 MT), Saudi Arabia (900 MT), and Taiwan (900 MT).


Soybeans: 
Net sales reductions of 12,700 MT for 2019/2020–a marketing-year low–were down noticeably from the previous week and from the prior 4-week average.  Increases primarily for the Netherlands (137,000 MT, including 132,000 MT switched from unknown destinations
and decreases of 3,200 MT), Indonesia (88,800 MT, including 49,800 MT switched from unknown destinations and decreases of 600 MT), Spain (40,000 MT, switched from unknown destinations), Japan (38,700 MT, including 36,200 MT switched from unknown destinations
and decreases of 200 MT), and France (23,000 MT, including 25,000 MT switched from unknown destinations and decreases of 2,000 MT), were offset by reductions for unknown destinations (342,800 MT) and China (32,800 MT).  For 2020/2021, net sales of 2,573,200
MT were primarily for China (1,654,000 MT), unknown destinations (701,000 MT), Pakistan (66,000 MT), Bangladesh (55,000 MT), and Taiwan (24,000 MT).  Exports of 899,000 MT were down 19 percent from the previous week, but up 22 percent from the prior 4-week
average.  The destinations were primarily to China (411,500 MT), the Netherlands (137,000 MT), Mexico (80,000 MT), Indonesia (77,600 MT), and Japan (41,600 MT)

Exports for Own Account: 
For 2019/2020, the current exports for own account outstanding balance is 61,600 MT, all Canada.


Soybean Cake and Meal
Net sales of 34,500 MT for 2019/2020–a marketing-year low– were down 81 percent from the previous week and 77 percent from the prior 4-week average.  Increases primarily for Canada (19,400 MT, including decreases of 200 MT), the Philippines (6,900 MT), Honduras
(3,100 MT, including decreases of 100 MT), Taiwan (3,000 MT), and Sri Lanka (2,100 MT), were offset by reductions for Colombia (6,000 MT) and Israel (1,000 MT). 
For 2020/2021, net sales
of 155,800 MT were primarily for Mexico (54,000 MT), unknown destinations (33,000 MT), Canada (20,000 MT), Morocco (15,000 MT), and Honduras (14,400 MT).  Exports of 222,500 MT were up 13 percent from the previous week and 9 percent from the prior 4-week average. 
The destinations were primarily to the Philippines (95,800 MT), Colombia (38,000 MT), Israel (26,400 MT), Canada (23,000 MT), and Mexico (20,000 MT). 


Soybean Oil: 
Net sales reductions
of 200 MT for 2019/2020 resulting in increases for Canada (600 MT, including decreases of 800 MT), Mexico (200 MT), and Belgium (100 MT), were more than offset by reductions for unknown destinations (1,000 MT).  Exports of 2,200 MT were down 82 percent from
the previous week and 92 percent from the prior 4-week average.  The destinations were primarily to Canada (1,700 MT), Mexico (400 MT), and Belgium (100 MT).


Cotton: 
Net sales of 128,000 RB for 2020/2021 primarily for China (56,800 RB), Vietnam (24,800 RB, including 3,300 RB switched from South Korea), Bangladesh (22,000 RB), Pakistan (14,800 RB, including decreases of 2,400 RB), and Mexico (11,700 RB), were offset by
reductions primarily for Indonesia (3,500 RB), South Korea (3,300 RB), and Honduras (1,400 RB).  For 2021/2022, net sales of 4,900 RB resulting in increases for Indonesia (9,300 RB), were offset by reductions for Malaysia (4,400 RB).  Exports of 421,500 RB
were primarily to China (192,000 RB, including 12,900 RB late – see below), Vietnam (82,100 RB, including 9,900 RB late – see below), Turkey (44,800 RB, including 17,000 late – see below), Pakistan (26,800 RB), and Indonesia (19,200 RB, including 4,100 RB
late – see below).  Net sales of Pima totaling 16,700 RB were primarily for India (8,100 RB), China (2,600 RB), Pakistan (1,800 RB), Turkey (1,600 RB), and Bahrain (900 RB).  Exports of 8,500 RB were primarily to India (3,100 RB), China (2,300 RB), Pakistan
(1,600 RB), Italy (400 RB), and Bangladesh (300 RB). 

Exports for Own account: 
For 2020/2021, new exports for own account totaling 7,400 RB were to China (3,600 RB), Vietnam (3,000 RB), and Malaysia (800 RB).  Exports for own account totaling 9,300 RB to China (8,400 RB) and Vietnam (900 RB) were applied to new or outstanding sales. 
The current exports for own account outstanding balance of 30,600 RB is for China (19,400 RB), Indonesia (3,900 RB), Malaysia (3,300 RB), Vietnam (3,000 RB), and Bangladesh (1,000 RB). 

Late Reporting: 
For 2020/2021, exports totaling 47,900 RB were reported late.  The destinations were to Turkey (17,000 RB), China (12,900 RB), Vietnam (9,900 RB), Indonesia (4,100 RB), Egypt (1,100 RB), Mexico (900 RB), Thailand (900 RB), Honduras (500 RB), Bangladesh (500
RB), and South Korea (100 RB). 


Hides
and Skins:

Net sales of 640,300 pieces for 2020 were up 49 percent from the previous week and 57 percent from the prior 4-week average.  Increases primarily for China (545,100 whole cattle hides, including decreases of 16,200 pieces), South Korea (37,300 whole cattle
hides, including decreases of 4,500 pieces), Mexico (30,800 whole cattle hides, including decreases of 700 pieces), Cambodia (12,000 whole cattle hides), and Taiwan (8,700 whole cattle hides), were offset by reductions for Indonesia (100 whole cattle hides)
and Japan (100 pieces).  Additionally, net sales reductions of 400 kip skins were reported for Belgium.  Exports of 478,800 pieces reported for 2020 were up 2 percent from the previous week and from the prior 4-week average.  Whole cattle hides exports were
primarily to China (383,200 pieces), Mexico (38,500 pieces), South Korea (25,200 pieces), Brazil (7,400 pieces), and Vietnam (3,900 pieces).  In addition, exports of calf skins were to Italy (10,400 calf skins) and kip skins to Belgium (3,800 kip skins).

Net
sales of 258,700 wet blues for 2020 were up 92 percent from the previous week and up noticeably from the prior 4-week average.  Increases were primarily for Thailand (68,100 unsplit), China (67,300 unsplit , including decreases of 1,100 unsplit), Vietnam (51,700
unsplit), Italy (43,900 unsplit, including decreases of 100 unsplit), and India (14,900 unsplit).  Exports of 98,000 wet blues for 2020 were up 2 percent from the previous week, but down 8 percent from the prior 4-week average.  The destinations were primarily
to China (40,000 unsplit), Italy (26,700 unsplit and 4,500 grain splits), Thailand (7,800 unsplit), Mexico (3,800 grain splits and 2,600 MT unsplit), and Brazil (3,800 grain splits).  Net sales of 37,700 splits reported for China (38,100 pounds, including
decreases of 3,200 pounds), were offset by reductions for Vietnam (500 pounds).  Exports of 321,000 pounds were to Vietnam (280,000 pounds) and China (41,000 pounds).


Beef:
Net
sales of 20,000 MT reported for 2020 were up 69 percent from the previous week and 13 percent from the prior 4-week average.  Increases primarily for South Korea (8,700 MT, including decreases of 400 MT), Japan (4,800 MT, including decreases of 300 MT), Taiwan
(1,800 MT, including decreases of 100 MT), Mexico (1,600 MT, including decreases of 100 MT), and Hong Kong (1,100 MT, including decreases of 200 MT), were offset by reductions primarily for China (500 MT) and Colombia (100 MT).  For 2021, net sales of 500
MT were primarily for Canada (400 MT).  Exports of 18,300 MT were up 9 percent from the previous week and 8 percent from the prior 4-week average.  The destinations were primarily to Japan (5,800 MT, including 800 MT late – see below), South Korea (5,400 MT),
Taiwan (1,800 MT), Canada (1,200 MT), and Mexico (1,100 MT).


Late Reporting: 
For 2020, exports totaling 800 MT were reported late.  The destination was Japan.


Pork:
Net sales of
20,600 MT reported for 2020 were up 97 percent from the previous week, but down 27 percent from the prior 4-week average.  Increases primarily for Mexico (7,800 MT, including decreases of 300 MT), China (6,500 MT, including decreases of 6,700 MT), Japan (2,400
MT, including decreases of 300 MT), Canada (1,900 MT, including decreases of 400 MT), and South Korea (900 MT, including decreases of 1,000 MT), were offset by reductions primarily for Australia (800 MT) and New Zealand (300 MT).  For 2021, total net sales
of 100 MT were for Australia.  Exports of 31,800 MT were down 9 percent from the previous week and 7 percent from the prior 4-week average.  The destinations were primarily to Mexico (9,900 MT), China (9,500 MT), Japan (4,200 MT), Canada (2,300 MT), and South
Korea (1,400 MT).


Terry Reilly

Senior Commodity Analyst – Grain and Oilseeds

Futures International │190 S LaSalle St., Suite 410│Chicago, IL  60603

W: 312.604.1366

treilly@futures-int.com

AIM: fi_treilly

ICE IM: 
treilly1

Skype: fi.treilly


Description: Description: Description: Description: FImail


Trading of futures, options, swaps and other derivatives is risky and is not suitable for all persons.  All of these investment products are leveraged, and you can lose more than your initial deposit.  Each investment product is offered
only to and from jurisdictions where solicitation and sale are lawful, and in accordance with applicable laws and regulations in such jurisdiction.  The information provided here should not be relied upon as a substitute for independent research before making
your investment decisions.  Futures International, LLC is merely providing this information for your general information and the information does not take into account any particular individual’s investment objectives, financial situation, or needs.  All investors
should obtain advice based on their unique situation before making any investment decision.  The contents of this communication and any attachments are for informational purposes only and under no circumstances should they be construed as an offer to buy or
sell, or a solicitation to buy or sell any future, option, swap or other derivative.  The sources for the information and any opinions in this communication are believed to be reliable, but Futures International, LLC does not warrant or guarantee the accuracy
of such information or opinions.  Futures International, LLC and its principals and employees may take positions different from any positions described in this communication.  Past results are not necessarily indicative of future results.