PDF attached
WASHINGTON,
Aug 5, 2021- Private exporters reported to the U.S. Department of Agriculture export sales of 300,000 metric tons of soybeans for delivery to unknown destinations during the 2021/2022 marketing year.
![]()
WORLD
WEATHER INC.
WORLD
WEATHER HIGHLIGHTS FOR AUGUST 5, 2021
-
Potential
rainfall has been increased for southern Alberta, north-central Montana and areas northeast from southwestern through northeastern and east-central Saskatchewan for late this weekend into early next week.
-
The
moisture boost comes too late for crops to benefit much with the exception of late Canola. Corn and soybeans are produced farther to the east and will not benefit from the moisture.
-
Rain
is also still predicted for Iowa, southeastern Minnesota, Wisconsin and northern Illinois this weekend and possibly again during mid-week next week which may help to prevent dryness from the northern Plains and far northwestern Corn Belt from expanding into
those areas until late this month. -
Not
much change was noted in other crop areas around the world for the coming two weeks. -
Dryness
remains a concern in southeastern Europe where the Balkan Countries are experiencing dry and very warm weather -
Dryness
is also prevailing from eastern Ukraine through Russia’s Southern Region into Kazakhstan -
China
is drying down in east-central and northeastern parts of the nation, but only temporarily since more rain is expected next week -
Tropical
activity has become explosive in the far western Pacific Ocean this week where four tropical systems have evolved from the south coast of China to Japan and some of the open water to the south of Japan -
Most
of these storms will not have a big impact, but flooding rain is expected in southeastern China during the coming week from Tropical Storm Lupit and Tropical Storm Mirinae will influence Japan’s main islands -
India
will continue to receive heavy rainfall in southeastern Rajasthan and northern Madhya Pradesh into the weekend resulting in more flooding and some crop and property damage -
Australia
weather will remain favorable for wheat, barley and canola except in Queensland where there is an ongoing need for rain -
Southeast
Asia rainfall continues restricted and a boost in expected, but it will come gradually this weekend into next week -
Thailand
soil moisture is lightest and will need to be boosted soon -
Portions
of Java and Sumatra are also a bit dry and in need of greater rain soon -
Southern
Philippines are a little dry -
Western
Luzon, Philippines remains excessively wet and experiencing flood conditions that have threatened rice production -
Not
much rain is expected in Brazil or Argentina, although a few showers will occur from southern and eastern Argentina into southern Brazil
Source:
World Weather Inc.
Thursday,
Aug. 5:
- USDA
weekly crop net-export sales for corn, soybeans, wheat, cotton, pork, beef, 8:30am - China’s
CNGOIC to publish monthly soy and corn reports - FAO
World Food Price Index - Port
of Rouen data on French grain exports - Malaysia
Aug. 1-5 palm oil export data - Risi
pulp conference, Sao Paulo - BayWa
earnings
Friday,
Aug. 6:
- ICE
Futures Europe weekly commitments of traders report (6:30pm London) - CFTC
commitments of traders weekly report on positions for various U.S. futures and options, 3:30pm - FranceAgriMer
weekly update on crop conditions
Saturday,
Aug. 7
- China’s
first batch of July trade data, incl. soybean, edible oil, rubber and meat imports
Source:
Bloomberg and FI
US
Initial Jobless Claims Jul 31: 385K (est 383K; prevR 399K; prev 400K)
US
Continuing Jobless Claims Jul 24: 2930K (est 3255K; prevR 3296K; prev 3269K)
US
Trade Balance (USD) Jun: -75.7B (est -74.2B; prevR -71.0B; prev -71.2B)
Canadian
International Merchandise Trade Jun: 3.23B (est -0.60B; prevR -1.58B; prev -1.39B)
USDA
weekly Export Sales
USDA
export sales for new-crop corn and soybeans increased from the previous week with Mexico stepping up new-crop corn commitments and China with new-crop soybean commitments. New-crop corn of 830,200 tons included Mexico (238,800MT), Japan (210,700 MT), unknown
destinations (101,700 MT), Colombia (96,300MT), and Nicaragua (82,500 MT). New-crop soybeans of 424,800 tons included unknown destinations(142,000 MT), China (129,000 MT), Egypt 65,000 MT), Mexico (43,700 MT), and Japan (20,000 MT). Old crop corn and soybean
sales were minimal. Meal export sales were ok at 135,400 tons and shipments were good at 188,600 tons. Soybean oil sales and shipments were poor. All-wheat sales slowed to 306,300 tons and could be perceived as disappointing.
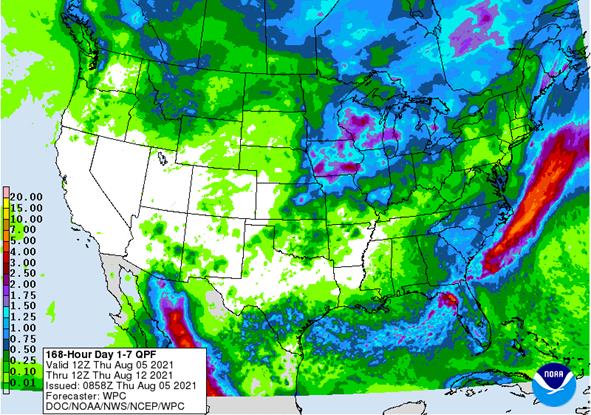
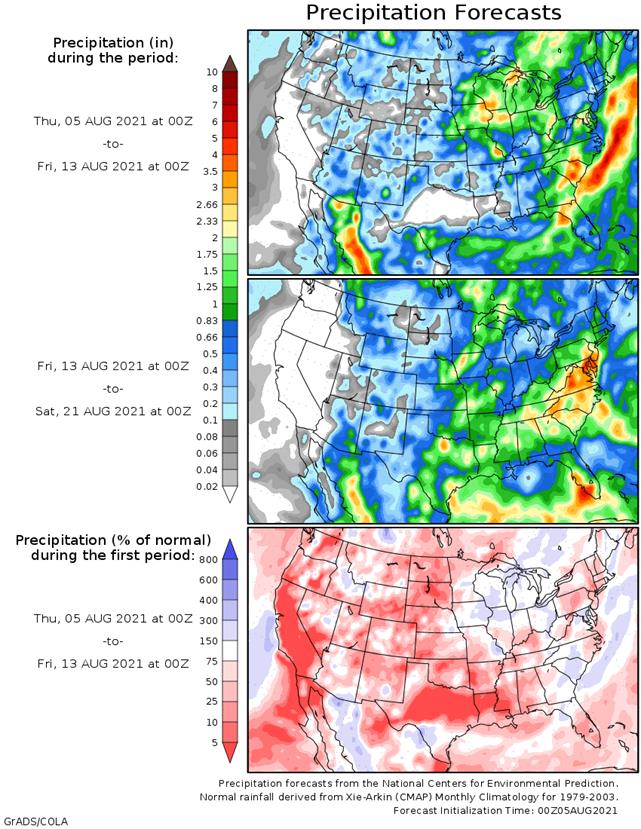
- US
corn futures are higher on unwinding of soybean/corn spreads and lack of direction. We could see a two sided trade. The morning weather forecast still calls for rain to fall across IA for week one and week two.
- Positioning
may have already started ahead of next week’s USDA report which will include initial USDA surveys of US soybean and corn production.
- China-US
container shipping costs reached a new high of more than $20,000 per 40-foot container. - US
ethanol production declined a less than expected 1,000 barrels per day to 1.013 million barrels. Trade was looking for a 7,000-barrel decline. Stocks fell 84,000 barrels to 22.649 million, near trade expectations. Production is lowest since May 27.
Export
developments.
- China
plans to auction off 219,218 tons of US imported corn on August 6, and 49,760 tons of Ukraine imported corn.
- Qatar
seeks about 100,000 tons of barley on August 18 for Sep-Nov delivery.
-
US
soybean futures are lower as parts of the WCB will see important rain over the next two weeks. Not all areas will get rain, but the maps appear to be wetter for IA through mid-August than that of earlier this week. Meal continues to gain on soybean oil.
WTI is down and USD is lower. -
USDA
announced 300,000 tons of soybeans were sold under the 24-hour reporting system for 2021-22 delivery. Earlier there were rumors China was in for US soybeans off the PNW yesterday and two cargoes may have traded.
-
Delta
COVID-19 variant spreading across selected countries that is prompting lockdowns, such as parts of China, are creating concerns over food demand, although we have not seen a material disruption in global trade flows.
-
Brazil’s
Anec estimated 2021-22 soybean production at 144 MMT, with exports at 94.3 MMT (up from 85.5 MMT this season). Most look for new-crop Brazil production to exceed 140 million tons.
- Argentina’s
Bahia port strike is now impacting fertilizes. We are hearing grains have started to flow again and negotiations started. Truckers on strike since Friday in Argentina’s port of Bahia Blanca has slowed down arrivals of grains and soybeans. Demand at this
southern location has been key this season as low water levels have forced ships to reduce drafts, then stop to get topped off Bahia Blanca before sailing onward.
- Argentina
producer sales so far in 2020-21 are running at 26.3 million tons, down nearly 8 percent from 28.5 million at this time year ago.
-
Offshore
values are leading SBO 15 points higher and meal $3.30 lower. -
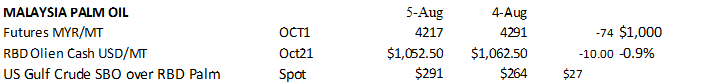
Malaysian
pam October futures was down 74 points and cash down $10/ton to $1,052.50/ton.
-
Rotterdam
oils were lower for soybean oil and higher for rapeseed oil. Rotterdam meal was unchanged to 5 euros higher.
-
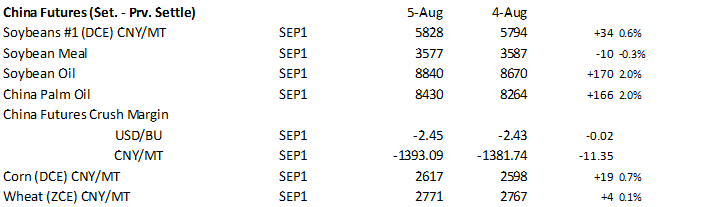
China
futures were mixed again for the complex, with soybeans up 34 yuan or 0.6%, meal down 0.3%, and both SBO & palm up 2.0%.
- China
cash crush margins were last positive 88 cents on our analysis (90 previous) versus 50 cents late last week and 129 cents around a year ago.
- Malaysian
palm oil:
Export
Developments
- USDA
reported under the 24-hour reporting system 300,000 tons of soybeans were sold to unknown destinations for 2021-22 delivery.
- Wheat
is higher from good global demand and concerns over high protein wheat supplies due to unfavorable North American, EU, and Russian weather.
- The
US weather forecast for the Great Plains is unchanged. The morning forecast did increase rain for parts of the Canadian Prairie’s.
- FOA
price index for July fell for the second consecutive month to 123.0 from 124.6 in June, but it’s still up 31% from July 2020.
- December
Paris wheat was up 0.75 at 228.50 euros per ton as of 8:00 am CT.
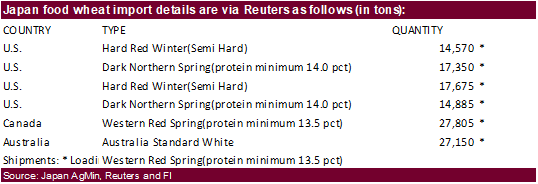
- Japan
bought 92,285 tons of food wheat out of 119,435
tons sought. They passed on Australian wheat. Original tender announcement below.
- Pakistan
seeks 400,000 tons of wheat for Sep and Oct shipment. - South
Korea seeks 135,100 tons of (50,000) Australian, (35,100) Canadian and (50,000) US wheat on Friday for October shipment.
- Tunisia
seeks 100,000 tons of wheat and 100,000 tons of barley on Friday for late Aug through third week of September shipment.
- Jordan
passed on 120,000 tons of barley. - Jordan
is back in for 120,000 tons of wheat on August 11. - Japan
(SBS) seeks 80,000 tons of feed wheat and 100,000 tons of feed barley on August 18 for loading by November 30.
Algeria
seeks at least 50,000 tons of wheat for Aug/Sep shipment. - Bangladesh
seeks 50,000 tons of wheat on August 18. - The
Taiwan Flour Millers’ Association seeks 48,000 tons of grade 1 northern spring, hard red winter and white milling wheat to be sourced from the United States, on Aug. 6 for shipment from the U.S. Pacific Northwest coast between Sept. 24 and Oct. 8. - Pakistan
seeks 400,000 tons of wheat on August 23.
Rice/Other
-
South Korea’s Agro-Fisheries & Food Trade Corp. seeks 39,226 tons of rice from the United States for arrival in South Korea on Jan. 31 and
March 31, 2022.
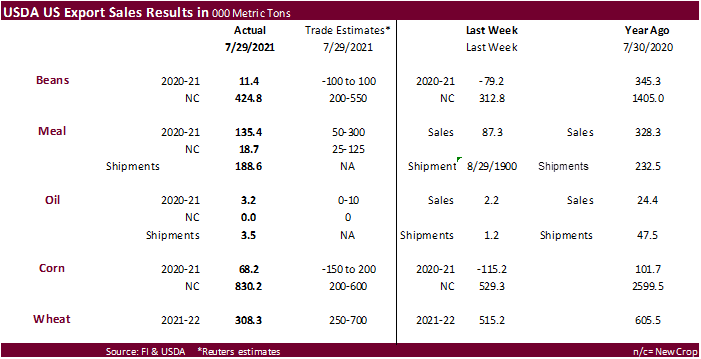
U.S. EXPORT SALES FOR WEEK ENDING 07/29/2021
|
|
CURRENT MARKETING YEAR |
NEXT MARKETING YEAR |
||||||
|
COMMODITY |
NET SALES |
OUTSTANDING SALES |
WEEKLY EXPORTS |
ACCUMULATED EXPORTS |
NET SALES |
OUTSTANDING SALES |
||
|
CURRENT YEAR |
YEAR |
CURRENT YEAR |
YEAR |
|||||
|
|
THOUSAND METRIC TONS |
|||||||
|
WHEAT |
|
|
|
|
|
|
|
|
|
HRW |
141.9 |
1,736.3 |
1,727.1 |
95.2 |
1,118.4 |
2,070.1 |
0.0 |
0.0 |
|
SRW |
64.2 |
1,054.2 |
704.1 |
87.2 |
477.9 |
311.2 |
0.0 |
0.0 |
|
HRS |
30.8 |
1,437.6 |
1,852.0 |
131.3 |
966.0 |
1,155.3 |
0.0 |
0.0 |
|
WHITE |
71.4 |
1,060.0 |
1,214.9 |
73.4 |
511.8 |
703.8 |
0.0 |
0.0 |
|
DURUM |
0.0 |
8.4 |
197.0 |
0.0 |
41.7 |
187.9 |
0.0 |
0.0 |
|
TOTAL |
308.3 |
5,296.4 |
5,695.1 |
387.2 |
3,115.8 |
4,428.3 |
0.0 |
0.0 |
|
BARLEY |
0.0 |
22.7 |
36.5 |
0.3 |
2.3 |
2.7 |
0.0 |
0.0 |
|
CORN |
68.2 |
6,200.7 |
5,093.8 |
1,410.7 |
63,522.8 |
38,688.8 |
830.2 |
17,486.9 |
|
SORGHUM |
2.7 |
593.2 |
539.0 |
52.8 |
6,589.8 |
3,812.3 |
0.0 |
1,594.9 |
|
SOYBEANS |
11.4 |
2,604.5 |
6,979.8 |
215.6 |
59,315.6 |
39,960.9 |
424.8 |
10,602.5 |
|
SOY MEAL |
135.4 |
1,861.6 |
1,666.1 |
188.6 |
9,950.6 |
10,109.0 |
18.7 |
1,149.1 |
|
SOY OIL |
3.2 |
17.6 |
192.0 |
3.5 |
665.0 |
1,077.3 |
0.0 |
0.6 |
|
RICE |
|
|
|
|
|
|
|
|
|
L G RGH |
0.0 |
164.9 |
93.3 |
27.6 |
1,642.7 |
1,329.4 |
33.8 |
50.3 |
|
M S RGH |
-1.1 |
2.3 |
23.2 |
4.4 |
30.5 |
73.2 |
0.0 |
7.0 |
|
L G BRN |
0.1 |
11.3 |
9.6 |
0.2 |
40.5 |
59.4 |
0.0 |
0.7 |
|
M&S BR |
0.0 |
0.1 |
31.7 |
0.4 |
157.0 |
86.7 |
0.0 |
0.0 |
|
L G MLD |
-8.7 |
31.2 |
36.3 |
5.4 |
653.8 |
897.9 |
66.9 |
147.4 |
|
M S MLD |
1.2 |
64.8 |
65.3 |
5.1 |
631.6 |
683.0 |
0.3 |
12.7 |
|
TOTAL |
-8.5 |
274.5 |
259.3 |
43.1 |
3,156.1 |
3,129.6 |
101.0 |
218.1 |
|
COTTON |
|
THOUSAND RUNNING BALES |
||||||
|
UPLAND |
17.1 |
1,373.4 |
2,925.4 |
229.5 |
14,833.0 |
14,131.0 |
149.3 |
3,314.0 |
|
PIMA |
2.4 |
91.9 |
120.5 |
8.7 |
751.9 |
483.0 |
9.1 |
14.6 |
SUMMARY OF EXPORT TRANSACTIONS
Reported Under the Daily Reporting System
For Period Ending July 29, 2021
This
summary is based on reports from exporters for the period July 23-29, 2021.
Wheat: Net
sales of 308,300 metric tons (MT) for 2021/2022 were down 40 percent from the previous week and 28 percent from the prior 4-week average. Increases primarily for Mexico (97,800 MT, including 30,000 MT switched from unknown destinations and decreases of 18,400
MT), South Korea (54,600 MT), Nigeria (48,000 MT), Colombia (32,200 MT), and the Philippines (27,000 MT, including decreases of 6,000 MT), were offset by reductions primarily for unknown destinations (14,500 MT) and Chile (2,000 MT). Exports of 387,200 MT
were up 12 percent from the previous week, but down 1 percent from the prior 4-week average. The destinations were primarily to Mexico (127,400 MT), the Philippines (91,000 MT), South Korea (55,000 MT), Japan (30,200 MT), and Chile (21,000 MT).
Corn:
Net sales of 68,200 MT for 2020/2021 were down noticeably from the previous week, but up noticeably from the prior 4-week average. Increases primarily for Mexico (205,400 MT, including decreases of 38,100 MT), Canada (65,200 MT, including decreases of 2,300
MT), Japan (31,600 MT, including 47,100 switched from unknown destinations and decreases of 17,100 MT), Guatemala (22,000 MT, including 21,200 MT switched from Nicaragua and decreases of 700 MT), and Taiwan (3,500 MT), were offset by reductions primarily for
China (112,500 MT), unknown destinations (47,100 MT), Nicaragua (46,900 MT), Costa Rica (30,100 MT), and Panama (20,700 MT). For 2021/2022, net sales of 830,200 MT primarily for Mexico (238,800 MT), Japan (210,700 MT), unknown destinations (101,700 MT), Colombia
(96,300 MT), and Nicaragua (82,500 MT), were offset by reductions for El Salvador (800 MT). Exports of 1,410,700 MT were up 4 percent from the previous week and 20 percent from the prior 4-week average. The destinations were primarily to China (909,500 MT),
Mexico (266,100 MT), Honduras (68,600 MT), Japan (64,100 MT), and Costa Rica (29,700 MT).
Optional
Origin Sales:
For 2020/2021, the current outstanding balance of 30,500 MT is for unknown destinations. For 2021/2022, decreases of 10,000 MT were reported for unknown destinations. The current outstanding balance of 50,000 MT is for unknown destinations.
Barley:
No net sales were reported for the week. Exports of 300 MT were down 35 percent from the previous week, but up 11 percent from the prior 4-week average. The destination was to South Korea.
Sorghum:
Net sales of 2,700 MT for 2020/2021 resulting in increases for Mexico (4,000 MT), were offset by reductions for China (1,300 MT). Exports of 52,800 MT were down 24 percent from the previous week, but up 6 percent from the prior 4-week average. The destination
was primarily to China (51,700 MT).
Rice:
Net sales reductions of 8,500 MT for 2020/2021–a marketing-year low–were down noticeably from the previous week and from the prior 4-week average. Increases primarily for Saudi Arabia (1,900 MT), Canada (1,900 MT), the Netherlands Antilles (200 MT), and
Poland (200 MT), were more than offset primarily by reductions for Haiti (12,200 MT) and Mexico (500 MT).
For 2021/2022, net sales of 101,000 MT were primarily for Iraq (40,000 MT), Mexico (33,800 MT), Haiti (22,400 MT), and the Dominican Republic (4,200 MT).
Exports of 43,100 MT were down 21 percent from the previous week and 26 percent from the prior 4-week average. The destinations were primarily to Mexico (32,800 MT), Japan (3,800 MT), Canada (3,200 MT), Saudi Arabia (2,200 MT), and Israel (200 MT).
Exports
for Own Account:
For 2020/2021, the current exports for own account outstanding balance is 100 MT, all Canada.
Late
Reporting: For
2020/2021, net sales totaling 25,000 MT of long grain rough rice were reported late for Mexico.
Soybeans:
Net sales of 11,400 MT for 2020/2021 were down noticeably from the previous week and down 33 percent from the prior 4-week average. Increases primarily for Vietnam (37,200 MT, including 33,500 MT switched from unknown destinations), Indonesia (28,700 MT,
including 21,500 MT switched from unknown destinations and decreases of 500 MT), Venezuela (10,000 MT), Colombia (7,000 MT), and Malaysia (6,700 MT, including decreases of 400 MT), were offset by reductions primarily for unknown destinations (51,000 MT) and
China (41,000 MT). For 2021/2022, net sales of 424,800 MT were primarily for unknown destinations (142,000 MT), China (129,000 MT), Egypt 65,000 MT), Mexico (43,700 MT), and Japan (20,000 MT). Exports of 215,600 MT were down 12 percent from the previous
week, but up 4 percent from the prior 4-week average. The destinations were primarily to Mexico (64,600 MT), Vietnam (39,500 MT), Indonesia (38,700 MT), Japan (32,200 MT), and China (28,500 MT).
Exports
for Own Account:
For 2020/2021, the current exports for own account outstanding balance is 5,800 MT, all Canada.
Soybean
Cake and Meal:
Net sales of 135,400 MT for 2020/2021 were up 55 percent from the previous week and 24 percent from the prior 4-week average. Increases primarily for Mexico (34,900 MT, including decreases of 400 MT), the Philippines (30,200 MT), Colombia (20,000 MT, including
decreases of 1,400 MT), Turkey (15,000 MT), and Nicaragua (11,200 MT, including 5,500 MT switched from Costa Rica and decreases of 3,200 MT), were offset by reductions for El Salvador (6,000 MT), Costa Rica (5,400 MT), and South Korea (800 MT).
For 2021/2022, net sales of 18,700 MT resulting in increases for Morocco (16,500 MT), Jamaica (6,500 MT), Nicaragua (6,000 MT), Mexico (4,500 MT), and Canada (4,400 MT), were offset by reductions for Ecuador (30,000 MT) and El Salvador
(400 MT). Exports of 188,600 MT were down 22 percent from the previous week and 7 percent from the prior 4-week average. The destinations were primarily to the Philippines (74,200 MT), Ecuador (31,200 MT), Mexico (19,200 MT), Canada (16,600 MT), and
Morocco (13,200 MT).
Soybean
Oil:
Net sales of 3,200 MT for 2020/2021 were up 48 percent from the previous week and up noticeably from the prior 4-week average. Increases were reported for Venezuela (3,000 MT) and Canada (200 MT). Exports of 3,500 MT were up noticeably from the previous
week and up 42 percent from the prior 4-week average. The destinations were primarily to Venezuela (3,000 MT) and Canada (300 MT).
Cotton:
Net sales of 17,100 RB for 2020/2021 were up noticeably from the previous week, but down 45 percent from the prior 4-week average. Increases primarily for Mexico (9,300 RB), South Korea (4,200 RB, including decreases of 100 RB), Vietnam (2,800 RB, including
400 RB switched from Japan and decreases of 5,100 RB), China (900 RB), and Bangladesh (700 RB, including 900 switched from Pakistan and decreases of 200 RB), were primarily offset by reductions for Malaysia (600 RB), Japan (300 RB), and El Salvador (300 RB).
For 2021/2022, net sales of 149,300 RB primarily for Costa Rica (36,500 RB), Pakistan (35,300 RB), Turkey (35,300 RB), China (15,800 RB), and Thailand (13,300 RB), were offset by reductions for Indonesia (700 RB), Honduras (600 RB), and Guatemala (300 RB).
Exports of 229,500 RB were down 4 percent from the previous week and 5 percent from the prior 4-week average. Exports were primarily to Vietnam (42,400 RB), China (35,500 RB), Turkey (34,100 RB), Pakistan (25,000 RB), and Indonesia (17,400 RB). Net sales
of Pima totaling 2,400 RB were down 42 percent from the previous week and 49 percent from the prior 4-week average. Increases reported for India (1,700 RB), Peru (400 RB), Colombia (200 RB), Pakistan (100 RB), and Vietnam (100 RB switched from China), were
offset by reductions for China (100 RB). For 2021/2022, net sales of 9,100 RB were primarily for China (6,600 RB), India (1,800 RB), Egypt (400 RB), and Guatemala (200 RB). Exports of 8,700 RB were down 7 percent from the previous week and 18 percent from
the prior 4-week average. The destinations were primarily to Vietnam (3,000 RB), India (3,000 RB), Austria (800 RB), Brazil (700 RB), and Peru (400 RB).
Exports
for Own Account:
For 2020/2021, the outstanding balance of 4,700 RB is for China.
Hides
and Skins:
Net sales of 265,200 pieces for 2021 were down 32 percent from the previous week and 28 percent from the prior 4-week average. Increases were primarily for China (181,100 whole cattle hides, including decreases of 6,400 pieces), Taiwan (32,700 whole cattle
hides, including decreases of 100 pieces), South Korea (23,100 whole cattle hides, including decreases of 800 pieces), Mexico (20,400 whole cattle hides, including decreases of 700 pieces), and Japan (5,000 whole cattle hides). Exports of 331,700 pieces were
down 15 percent from the previous week and 16 percent from the prior 4-week average. Whole cattle hides exports were primarily to China (246,000 pieces), South Korea (23,300 pieces), Mexico (22,100 pieces), Ethiopia (16,700 pieces), and Thailand (9,200 pieces).
Net
sales of 49,200 wet blues for 2021 were down 6 percent from the previous week and 72 percent from the prior 4-week average. Increases primarily for Thailand (17,600 unsplit, including decreases of 400 unsplit), Vietnam (14,800 unsplit), China (10,100 unsplit),
Italy (5,600 unsplit, including decreases of 800 unsplit and 300 grain splits), and Mexico (2,200 unsplit, including decreases of 800 unsplit), were offset by reductions for Taiwan (100 unsplit). Exports of 68,200 wet blues were down 58 percent from the previous
week and 54 percent from the prior 4-week average. The destinations were to Italy (19,300 unsplit and 1,900 grain splits), Vietnam (14,000 unsplit), Taiwan (8,800 unsplit), Mexico (4,400 unsplit and 4,200 grain splits), and Thailand (8,000 unsplit). Net
sales of 225,500 splits reported for Vietnam (228,900 pounds, including decreases of 11,100 pounds) and China (900 pounds, including decreases of 1,200 pounds), were offset by reductions for Taiwan (2,400 pounds) and Italy (1,900 pounds). Exports of 569,300
pounds were to Vietnam (312,000 pounds), Taiwan (126,600 pounds), China (80,700 pounds), and Italy (50,000 pounds).
Beef:
Net
sales of 15,000 MT reported for 2021 were down 33 percent from the previous week and 26 percent from the prior 4-week average. Increases were primarily for Japan (4,000 MT, including decreases of 600 MT), South Korea (3,300 MT, including decreases of 700
MT), China (2,300 MT, including decreases of 100 MT), Canada (1,200 MT, including decreases of 200 MT), and Indonesia (1,100 MT).
Total
net sales for 2022, of 100 MT were for Japan.
Exports of 20,400 MT were up 6 percent from the previous week and 10 percent from the prior 4-week average. The destinations were primarily to South Korea (6,800 MT), Japan (4,600 MT), China (3,600 MT), Mexico (1,400 MT), and Taiwan (1,200 MT).
Pork:
Net
sales of 38,800 MT reported for 2021 were up 1 percent from the previous week and 32 percent from the prior 4-week average. Increases primarily for China (18,300 MT, including decreases of 200 MT), Mexico (9,200 MT, including decreases of 1,100 MT), Japan
(3,300 MT, including decreases of 500 MT), South Korea (3,100 MT, including decreases of 300 MT), and Canada (1,600 MT, including decreases of 400 MT), were offset by reductions for Nicaragua (200 MT) and Chile (100 MT). Exports of 28,400 MT were down 5 percent
from the previous week and 2 percent from the prior 4-week average. The destinations were primarily to Mexico (12,100 MT), China (4,900 MT), Japan (4,000 MT), Canada (1,900 MT), and South Korea (1,300 MT).
Terry Reilly
Senior Commodity Analyst – Grain and Oilseeds
Futures International
One Lincoln Center
18 W 140 Butterfield Rd.
Oakbrook Terrace, Il. 60181
W: 312.604.1366
ICE IM:
treilly1
Skype: fi.treilly

Trading of futures, options, swaps and other derivatives is risky and is not suitable for all persons. All of these investment products are leveraged, and you can lose more than your initial deposit. Each investment product is offered
only to and from jurisdictions where solicitation and sale are lawful, and in accordance with applicable laws and regulations in such jurisdiction. The information provided here should not be relied upon as a substitute for independent research before making
your investment decisions. Futures International, LLC is merely providing this information for your general information and the information does not take into account any particular individual’s investment objectives, financial situation, or needs. All investors
should obtain advice based on their unique situation before making any investment decision. The contents of this communication and any attachments are for informational purposes only and under no circumstances should they be construed as an offer to buy or
sell, or a solicitation to buy or sell any future, option, swap or other derivative. The sources for the information and any opinions in this communication are believed to be reliable, but Futures International, LLC does not warrant or guarantee the accuracy
of such information or opinions. Futures International, LLC and its principals and employees may take positions different from any positions described in this communication. Past results are not necessarily indicative of future results.