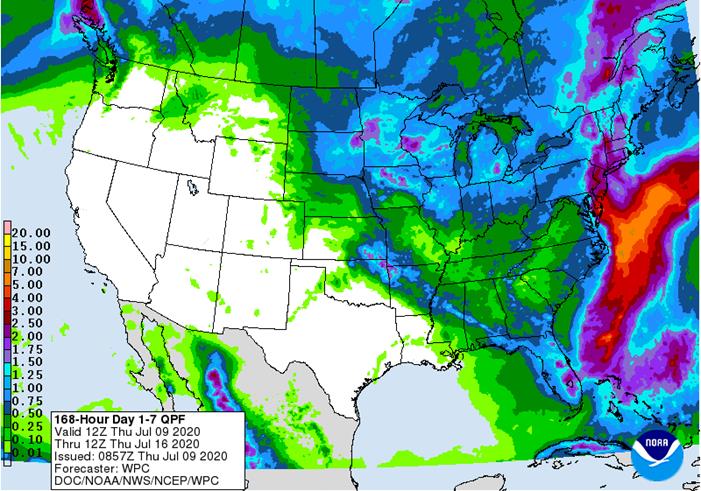
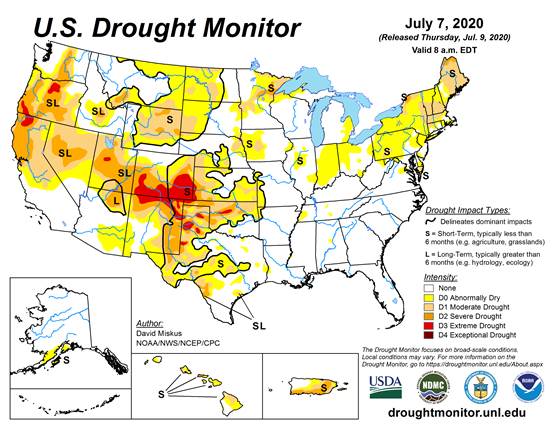
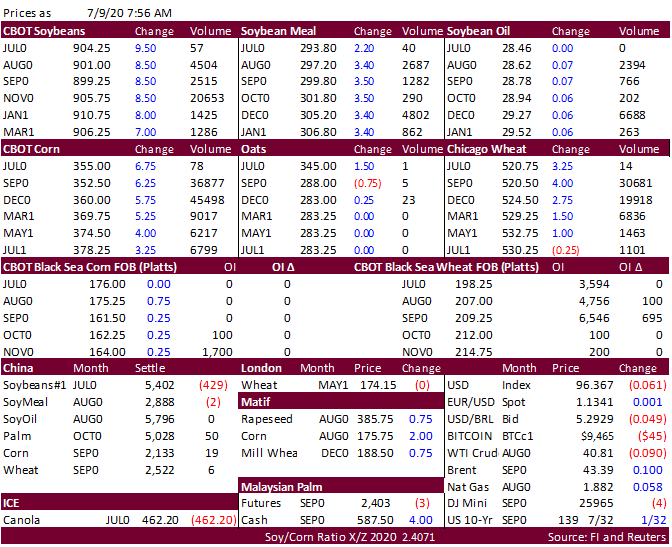
PDF attached


Morning.  


Back
to trading a weather market. Weather models look warmer and drier for week one and week two for the US.  The most notable change was a drier forecast for week two for lower Midwest to 2/3 of the Midwest.  This lifted corn and soybeans sharply higher overnight. 
Soybean products are mixed with a firm undertone in meal and weaker SBO.  Although Rotterdam vegetable oils were leading CBOT sharply higher this morning.  Wheat is mostly higher on follow through buying yesterday.  China sold all of its 4 million tons of
corn out of auction, bringing cumulative sales to 28 million tons.  Funds yesterday were most active in Chicago wheat on the buy side since last December, using daily estimates.  Argentina is on holiday.  After the CBOT close, we learned the Rosario Grains
Exchange lowered their outlook for the 2020 Argentina wheat crop to 18-19 million tons from 21-22 million tons previously, based on a lower area. 


Weather
and Crop Progress


Soybean
conditions are expected to decline 1-2 on Monday and corn 2-4. 


UNITED
STATES

  • No
    serious theme changes were noted over the next ten days
    • Showers
      and thunderstorms will scatter erratically across the Midwest, Delta and southeastern states through Monday morning and then net drying is expected in the lower half to two-thirds of the Midwest through the remainder of next week and into the following weekend
    • Rain
      will fall across the far northern parts of the Midwest next week while drying occurs elsewhere
  • Rain
    was reduced from eastern Iowa to Ohio July 16-18
    • Some
      of the reduction was needed
  • Rain
    was increased from North Dakota to northern Michigan July 16-18
    • Some
      of the rain was overdone, but the increase was needed
  • Rain
    was reduced from the lower Midwest July 19-21
    • Some
      of the reduction was needed
  • A
    boost in upper Midwest rainfall was suggested July 19-21
    • Some
      of the increase was needed
  • Rain
    was reduced from Iowa, southern Wisconsin and Missouri into Ohio and northern Kentucky July 22-23
    • This
      reduction was needed


Today’s
U.S. outlook trended drier in the lower half to two-thirds of the Midwest during the second week of the outlook which was a needed change. Completely dry weather is not expected, but warm to hot temperatures will keep evaporation rates high so that any rain
that falls after Monday of next week will be quickly lost to evaporation. If the forecast model run is correct (and there is a fair chance that the model trend is correct toward limiting the ten-day rainfall in the lower and middle parts of the Midwest) topsoil
moisture will be short to very short over a large part of the region by July 24. Favorable crop moisture will continue in the northern Midwest and subsoil moisture will still be supportive for crops, although showing signs of decline.


EUROPE/BLACK
SEA REGION

  • No
    significant changes in the first week of the outlook
    • France
      and parts of the United Kingdom and Belgium are left dry or mostly dry
    • Germany
      and northwestern Czech Republic receive a few showers of limited significance
    • The
      lower Danube River Basin remains quite dry
    • Central
      Ukraine and Russia’s Southern region receive minimal amounts of rain
  • Rain
    was increased from southern France to southern Poland July 19-21 as well as in areas near the Baltic Sea
    • These
      increases may have been overdone
  • Rain
    was reduced July 19-21 from east-central France into western Poland
    • Too
      much rain was removed from the outlook
  • Rain
    was reduced from Austria to western Ukraine July 22-23
    • Some
      increase in rain was needed, but the distribution is likely to be further changed in future model runs


No
serious changes to the general weather trends are expected over the next two weeks. France will continue to struggle for moisture most significantly with some southern U.K. locations, Belgium and Germany to be included. A more significant region of dryness
has returned to the lower Danube River Basin and that area needs rain and is not likely to see much for a while. World Weather, Inc. still believes there is some potential for a short term increase in rain for western Europe after July 18, but that has not
showed up in the model data yet.


RUSSIA
NEW LANDS

  • Little
    change was noted overnight in the first week of the outlook
    • The
      central New Lands are still advertised to be drier biased, although a few showers scatter through the region
    • Rain
      falls most significantly northwest of the Ural Mountains
    • Erratic
      showers occur in the eastern New Lands
  • GFS
    model run was much wetter during the second week with rain suggested for much of the New Lands
    • Some
      of this increase was overdone especially from July 20-25 when a deep upper level low pressure center was advertised to move through the region
    • The
      European model has a deep upper level low pressure system, as well, but it keeps that storm mostly over western Russia and does not allow the storm system to get farther east than the Ural Mountain region


The
bottom line remains one of net drying for the coming ten days in the central New Lands with the area between the Ural Mountains and Siberia driest. There may be some opportunity for rain July 20-24, but confidence is low and the amount of rain that falls should
also be low. The region will experience net drying for a while and warmer temperatures which may eventually reduce soil moisture and raise a need for rain to support spring wheat and sunseed more ideally.


CHINA

Excessive
rain occurred again in the Yangtze River Basin Wednesday with amounts of 3.50 to more than 7.00 inches perpetuating flood conditions

  • Rain
    was increased in portions the North China Plain this weekend
    • Some
      increase was needed
  • Some
    reduction in heavy rain advertised for the Yangtze River Basin was made for the coming week
  • Rain
    continues advertised frequently near and north of the Yangtze River in east-central China during the July 19-24 period
    • Some
      of the rain amounts look to be very heavy and more flooding would likely result


Northern
China crop areas will continue to experience favorable crop weather over the next couple of weeks with periods of sunshine and rain alternating along with seasonable temperatures to support good crop development. Too much rain in east central China centered
on the Yangtze River Basin will continue to generate flood conditions and will maintain downward pressure on crop production in the area. This will likely have a big impact on rice, but a smaller impact and coarse grain and oilseed crops.


AUSTRALIA

  • No
    change was noted in the first ten days of the outlook overnight
    • New
      South Wales and Queensland are still expecting scattered showers the remainder of this week and into the weekend
    • Western
      Australia will get some rain early next week with southwestern areas wettest
  • Second
    week rainfall will occur mostly in coastal areas as previously suggested


INDIA

No
major changes were noted overnight through the next ten days


SOUTH
AMERICA

No
major changes were noted overnight through the next ten days


Source:
World Weather Inc. and FI


Bloomberg
Ag Calendar

THURSDAY,
July 9:

  • USDA
    weekly crop net-export sales for corn, soybeans, wheat, cotton, pork, beef, 8:30am
  • Port
    of Rouen data on French grain exports
  • Brazil’s
    Unica may release cane crush, sugar production during the week (tentative)
  • EARNINGS:
    Suedzucker, Barry Callebaut, Agrana
  • HOLIDAY:
    Argentina

FRIDAY,
July 10:

  • USDA’s
    monthly World Agricultural Supply and Demand (Wasde) report, noon
  • China
    farm ministry’s CASDE monthly crop supply- demand report
  • Malaysian
    Palm Oil Board’s data on reserves, exports and production in June
  • ICE
    Futures Europe weekly commitments of traders report, 1:30pm (6:30pm London)
  • CFTC
    commitments of traders weekly report on positions for various U.S. futures and options, 3:30pm
  • FranceAgriMer
    weekly update on crop conditions
  • Malaysia’s
    palm oil export data for July 1-10
  • Cherkizovo
    trading update
  • HOLIDAY:
    Singapore (election day), Argentina


Source:
Bloomberg and FI


USDA
export sales

were very good for old crop soybeans at 952,200 tons. New-crop fell below expectations at 382,100 tons-one crop year offsetting the other.  Soybean meal sales were on the lower end, but shipments were good at 311,700 tons.  Soybean oil sales rebounded sharply
to 28,900 tons from the previous week of 2,800 tons.  SBO shipments were poor at 2,100 tons.  Corn export sales were within expectations and included 407,000 tons for China (old-crop).  All-wheat sales were ok at 326,100 tons vs. 414,300 last week. 


Macros

US
Initial Jobless Claims Jul 4: 1314K (est 1375K; prevR1413K; prev 1427K)

US
Continuing Claims Jun 27: 18062K (est 18750K; prevR 18760K; prev 19290K)


Corn.

·        
The USD was slightly lower.  

·        
China sold all of its 4 million tons of corn out of auction, bringing cumulative sales to 28 million tons, more than all of last season.  2020-21 China corn imports could easily end up more than the 7MMT cap. 

·        
China is looking for sell 20,000 tons of pork out of reserves on Friday. 

·        
Ukraine plans to reinstate their Agriculture Ministry department.  

·        
US weekly ethanol production increased 14 million barrels per day to 914,000 barrels, up 10 consecutive weeks, highest level since March 27.  Ethanol stocks increased 456,000 barrels to 20.620 million.  This snapped a 10 consecutive
week decline.  Year to date production is down 10.2 percent from the same period a year ago. 

·        
Global Grain Asia is July 9-10.


Corn
Export Developments


Soybean
complex
.

·        
Soybeans are up sharply (7.0-9.95 cents) on US weather forecasts turning hotter and drier for the second week of the forecast.  Much of the rain predicted for this workweek has already occurred for
the heart of the Midwest while the east will continue to see an active pattern in part to the tropical storm off the southeast.  Meal was up $2.20-$3.50. 

·        
We heard China bought one Brazilian cargo for October shipment and were price checking Brazil and US Gulf Q3 soybeans.  Brazil bid/offers are widening for August shipment although China was said to be about 90 percent covered
for the month and 80 percent covered for October.  Yesterday we heard one Argentina cargo traded to China. 

·        
SBO turning slightly higher by the electronic pause.  Rotterdam vegetable oil prices were sharply higher this morning bias SBO. 

·        
Thursday and Friday is a holiday in Argentina. Look for a possible large price swing in SBO prices when we return to work on Monday. 

·        
GAPKI: Indonesia May palm oil stocks at 3.53MMT, up 4.7% from 3.37MMT in April. Production 3.97MMT vs. 4.0 in April.  Exports 2.43MMT vs. 2.65 April and 2.79MMT May 2019. 

·        
CNGOIC: China palm imports projection for July-550,000 tons from 450,000 tons during June. 

·        
Rotterdam values this morning showed soybean oil for the August/September position was up 20 euros from this time previous session, rapeseed oil up 5 in the nearby, and soybean meal when imported from South America unchanged to
3 euros higher. 

·        
Traders look for Malaysian palm oil July 1-10 exports to decline 15 percent from the same period a month ago. 

·        
Malaysia:  Closed at two-week high

  • China:

·        
China cash crush margins as of this morning, using our calculation, were 87 cents per bushel (86 previous) and compares to 63 cents a week ago and 47 cents around this time last year.


Oilseeds
Export Developments


Wheat

·        
US wheat is higher on follow through bullish sentiment over shrinking global supplies.  Don’t discount USDA reporting a smaller than expected world wheat production figure on Friday. 

·        
On Wednesday the Rosario Grains Exchange lowered their outlook for the 2020 Argentina wheat crop to 18-19 million tons from 21-22 million tons previously, based on a lower area.  In addition, UK’s Agriculture and Horticulture
Development Board estimated the soft wheat area down 9.4% from a February estimate to 1.363 million hectares (1.504 in Feb) and compares to 1.808 million sowed in 2019. 

·        
Yesterday the funds bought an estimated net 15,000 Chicago contracts.  That might be the most they bought in a single day since December 16th when they bought the same amount. 


Export
Developments.

·        
The Philippines passed on 110,000 tons of feed wheat. 

·        
No word yet for Thailand seeking 44,400 tons of feed barley. 

·        
Jordan seeks 120,000 tons of wheat, optional origin, on July 14. 

  • Ethiopia
    seeks 400,000 tons of wheat on July 10 for shipment within two months.    
  • Syria seeks 200,000 tons of milling wheat from Russia by
    July 28. 


Rice/Other

  • None reported


Export Sales Highlights 

This
summary is based on reports from exporters for the period June 26-July 2, 2020.

Wheat:  Net
sales of 326,100 metric tons (MT) were reported for delivery in marketing year 2020/2021.  Increases primarily for Mexico (139,400 MT, including 53,000 MT switched from unknown destinations and decreases of 1,500 MT), the Philippines (73,000 MT), Ecuador (32,200
MT), Haiti (27,500 MT, including 25,000 MT switched from unknown destinations), and Italy (25,200 MT, including 25,000 MT switched from unknown destinations), were offset by reductions for Canada (8,200 MT), Guatemala (7,400 MT), and unknown destinations (6,000
MT).  For 2021/2022, net sales reductions of 75,000 MT were reported for unknown destinations (67,000 MT) and Mexico (8,000 MT).  Exports of 410,100 MT were primarily to Mexico (111,700 MT), Taiwan (53,400 MT, including 5,100 MT late – see below), Malaysia
(47,300 MT), Italy (46,200 MT), and Guatemala (40,800 MT).  

Export Adjustments:
Accumulated exports of soft red winter wheat to Ecuador were adjusted down 32,202 MT for week ending June 25th.  The correct commodity is hard red spring wheat and is included in this week’s report.

Late Reporting: 
For 2020/2021, exports to Taiwan (5,100 MT) were reported late.  

Corn: 
Net sales of 599,200 MT for 2019/2020 were up 66 percent from the previous week and 30 percent from the prior 4-week average.  Increases primarily for China (407,200 MT), Colombia (102,500 MT, including 42,400 MT switched from unknown destinations and decreases
of 5,600 MT), Mexico (90,600 MT, including 8,000 MT switched from unknown destinations and decreases of 7,000 MT), Honduras (13,000 MT), and Nicaragua (12,800 MT), were offset by reductions primarily for unknown destinations (48,100 MT) and Japan (6,600 MT). 
For 2020/2021, net sales of 409,300 MT were primarily for Mexico (121,900 MT), unknown destinations (70,100 MT), Honduras (54,300 MT), Panama (39,000 MT), and Nicaragua (35,800 MT).  Exports of 1,084,300 MT were down 25 percent from the previous week and 11
percent from the prior 4-week average.  The destinations were primarily to Mexico (358,500 MT), Japan (286,900 MT), Colombia (142,200 MT), the Dominican Republic (70,500 MT), and China (66,500 MT). 

Optional Origin
Sales:
  For 2019/2020, the current outstanding balance of 325,000
MT is for South Korea (195,000 MT), Vietnam (65,000 MT), and Taiwan (65,000 MT).  For 2020/2021, the current outstanding balance of 195,000 MT is for Vietnam.

Barley: 
No net sales for 2020/2021 were reported for the week.  Exports of 200 MT were to South Korea.

Sorghum: 
Net sales of 53,900 MT for 2019/2020 were down 63 percent from the previous week, but up 3 from the prior 4-week average.  Increases were reported for China (50,900 MT, including 50,000 MT switched from unknown destinations) and unknown destinations (3,000
MT).  For 2020/2021, net sales of 137,000 MT were reported for unknown destinations (98,000 MT) and Japan (39,000 MT).  Exports of 51,100 MT were down 61 percent from the previous week and 70 percent from the prior 4-week average.  The destination was China.

Rice: 
Net sales of 21,600 MT for 2019/2020 were down 13 percent from the previous week, but up noticeably from the prior 4-week average.  Increases were primarily for Colombia (18,500 MT), Canada (1,600 MT), Japan (500 MT), Saudi Arabia (400 MT), and Israel (300
MT).  Exports of 21,100 MT were down 60 percent from the previous week and 63 percent from the prior 4-week average.  The destinations were primarily to Japan (11,900 MT), Saudi Arabia (2,800 MT), Mexico (2,600 MT), Canada (1,900 MT), and Jordan (500 MT). 

Exports for Own
Account:
  For 2019/2020, the current exports for own account outstanding
balance is 100 MT, all Canada.

Soybeans: 
Net sales of 952,200 MT for 2019/2020 were up noticeably from the previous week and up 60 percent from the prior 4-week average.  Increases were primarily for China (461,400 MT, including 68,000 MT switched from unknown destinations and decreases of 300 MT),
Indonesia (131,000 MT, including 55,000 MT switched from unknown destinations and decreases of 800 MT), Pakistan (70,000 MT), Bangladesh (58,400 MT, including 55,000 MT switched from unknown destinations), and Mexico (56,100 MT, including decreases of 34,100
MT).  For 2020/2021, net sales of 382,100 MT were primarily for China (192,000 MT), unknown destinations (92,000 MT), Mexico (54,000 MT), Taiwan (25,500 MT), and Japan (7,000 MT).  Exports of 467,500 MT were up 20 percent from the previous week and 36 percent
from the prior 4-week average.  The destinations were primarily to Mexico (144,200 MT), Indonesia (79,000 MT), China (74,400 MT), Bangladesh (58,400 MT), and Taiwan (31,700 MT). 

Exports for Own
Account:
  For 2019/2020, the current exports for own account outstanding
balance is 2,100 MT, all Canada.

Soybean
Cake and Meal

Net sales of 124,400 MT for 2019/2020 were down 13 percent from the previous week and 9 percent from the prior 4-week average.  Increases primarily for Mexico (31,900 MT), Colombia (25,900 MT, including 9,000 MT switched from unknown destinations and decreases
of 5,700 MT), Canada (25,300 MT, including decreases 200 MT), Honduras (16,000 MT), and Nicaragua (7,000 MT), were offset by reductions for unknown destinations (8,100 MT), the Dominican Republic (600), and Japan (100 MT). 
For
2020/2021, net sales of 73,500 MT were primarily for Honduras (17,600 MT), Guatemala (12,800 MT), Jamaica (12,000 MT), Panama (11,800 MT), and Nicaragua (8,800 MT).  Exports of 311,700 MT were up 62 percent from the previous week and 43 percent from the prior
4-week average.  The destinations were primarily to the Philippines (92,600 MT), Colombia (61,200 MT), Mexico (32,300 MT), Libya (31,200 MT), and Ecuador (27,000 MT). 

Soybean
Oil: 
Net
sales of 28,900 MT for 2019/2020 were primarily for unknown destinations (19,000 MT), the Dominican Republic (8,500 MT), Canada (900 MT), and Mexico (400 MT).  Exports of 2,100 MT were down 91 percent from the previous week and 90 percent from the prior 4-week
average.  The destinations were primarily to Mexico (1,300 MT) and Canada (600 MT).

Cotton: 
Net sales of 43,800 RB for 2019/2020 were down 35 percent from the previous week and 74 percent from the prior 4-week average.  Increases primarily for China (22,000 RB), Malaysia (8,800 RB, switched from China), Vietnam (8,700 RB, including 2,400 RB switched
from Japan, 1,400 RB switched from South Korea, and decreases of 1,300 RB), Turkey (6,400 RB), and Indonesia (1,400 RB, including 100 RB switched from Japan), were offset by reductions primarily for Japan (2,200 RB), South Korea (1,400 RB), and Pakistan (1,400
RB).  For 2020/2021, net sales of 6,700 RB were reported for Turkey (5,400 RB) and Vietnam (1,300 RB).  Exports of 329,300 RB were up 19 percent from the previous week and 7 percent from the prior 4-week average.  Exports were primarily to China (112,400 RB),
Vietnam (61,100 RB), Turkey (47,600 RB), Pakistan (36,200 RB), and Bangladesh (20,200 RB).  Net sales of Pima totaling 2,800 RB were down 39 percent from the previous week and 34 percent from the prior 4-week average.  Increases were for China (1,300 RB),
Pakistan (1,000 RB), India (400 RB), and Turkey (100 RB).  For 2020/2021, total net sales of 3,600 RB were for El Salvador.  Exports of 7,300 RB were up 65 percent from the previous week, but down 16 percent from the prior 4-week average.  The destinations
were primarily to China (3,000 RB), Pakistan (3,000 RB), Vietnam (500 RB), India (300 RB), and Bangladesh (300 RB). 

Exports
for Own Account:
 
For 2019/2020, new exports for own account totaling 2,200 RB were primarily to Vietnam (900 RB) and Pakistan (600 RB).  Decreases were reported for China (1,100 RB) and Bangladesh (800 RB).  The current exports for own account outstanding balance of 24,800
RB is for China (9,400 RB), Indonesia (8,200 RB),
Vietnam
(5,000 RB), Bangladesh (1,600 RB), and Pakistan (600 RB). 

Hides
and Skins:

Net sales of 630,100 pieces for 2020 were up 58 percent from the previous week and 19 percent from the prior 4-week average.  Increases primarily for China (427,100 whole cattle hides, including decreases of 10,900 pieces), Mexico (118,200 whole cattle hides,
including decreases of 100 pieces), South Korea (73,800 whole cattle hides, including decreases of 700 pieces), Ethiopia (7,700 whole cattle hides), and Japan (2,400 whole cattle hides), were offset by reductions for Indonesia (200 pieces).
 
Additionally, net sales reductions of 100 kip skins were for Canada. 
Exports of 516,900 pieces reported for 2020 were up 27 percent from the previous week and 21 percent from the prior 4-week average.  Whole cattle hides exports were primarily to China (384,100 pieces), Mexico (68,700 pieces), South Korea (54,100 pieces), Indonesia
(3,200 pieces), and Vietnam (2,500 pieces).  In addition, exports of 1,300 kip skins were to Canada.

Net
sales of 33,300 wet blues for 2020 were down 40 percent from the previous week and 52 percent from the prior 4-week average.  Increases reported for Vietnam (10,800 grain splits and 10,200 unsplit), Italy (9,500 unsplit), Taiwan (1,700 grain splits), China
(1,300 grain splits and decreases of 100 unsplit), and Mexico (100 grain split), were offset by reductions for Brazil (100 grain splits) and Thailand (100 unsplit).  Exports of 46,700 wet blues for 2020 were down 40 percent from the previous week and 42 percent
from the prior 4-week average.  The destinations were primarily to China (15,900 unsplit), Thailand (7,900 unsplit), Vietnam (7,700 unsplit), Italy (6,400 unsplit), and Brazil (6,400 grain splits).  Net sales of 698,900 splits were for Vietnam, including decreases
of 21,100 pounds.  Exports of 80,000 pounds were to Vietnam.

Beef:
Net sales of 9,500 MT
reported for 2020 were down 23 percent from the previous week and 51 percent from the prior 4-week average.  Increases were primarily for Japan (2,900 MT, including decreases of 500 MT), South Korea (2,300 MT, including decreases of 500 MT), China (1,000 MT),
Mexico (700 MT), and Taiwan (600 MT, including decreases of 100 MT).  Exports of 15,100 MT were up 3 percent from the previous week and 15 percent from the prior 4-week average.  The destinations were primarily to South Korea (5,400 MT), Japan (4,500 MT),
Taiwan (1,200 MT), Canada (1,100 MT), and Hong Kong (1,000 MT).

Pork:
Net sales of 31,500 MT reported for 2020 were down 20 percent
from the previous week, but up 6 percent from the prior 4-week average.  Increases were primarily for Mexico (9,100 MT, including decreases of 300 MT), China (8,100 MT, including decreases of 4,500 MT), Japan (5,300 MT, including decreases of 200 MT), Vietnam
(2,000 MT), and Canada (1,700 MT, including decreases of 400 MT).  Exports of 33,500 MT were up 8 percent from the previous week and 7 percent from the prior 4-week average.  The destinations were primarily to China (12,700 MT), Mexico (10,300 MT), Japan (3,000
MT), South Korea (2,300 MT), and Canada (2,200 MT).

U.S. EXPORT SALES FOR WEEK ENDING 7/2/2020                            


CURRENT MARKETING YEAR

NEXT MARKETING YEAR

COMMODITY

NET SALES

OUTSTANDING SALES

WEEKLY EXPORTS

ACCUMULATED EXPORTS

NET SALES

OUTSTANDING SALES

CURRENT YEAR

YEAR
AGO

CURRENT YEAR

YEAR
AGO


THOUSAND METRIC TONS

WHEAT


   HRW    

61.9

1,825.6

1,664.9

169.3

1,007.8

1,359.7

0.0

0.0

   SRW    

149.6

610.8

797.1

49.7

117.9

228.6

-75.0

0.0

   HRS     

86.0

1,583.8

1,309.1

123.3

587.5

555.5

0.0

0.0

   WHITE   

28.4

1,105.5

955.6

21.8

411.1

404.0

0.0

0.0

   DURUM  

0.2

179.0

157.2

46.2

131.2

55.3

0.0

0.0

     TOTAL

326.1

5,304.7

4,883.9

410.1

2,255.5

2,603.2

-75.0

0.0

BARLEY

0.0

40.2

46.7

0.2

1.5

5.0

0.0

0.0

CORN

599.2

7,945.8

5,395.5

1,084.3

34,966.9

44,025.5

409.3

4,302.3

SORGHUM

53.9

846.2

225.3

51.1

3,364.3

1,395.8

137.0

593.0

SOYBEANS

952.2

8,229.8

10,059.9

467.5

37,765.0

38,472.4

382.1

7,318.9

SOY MEAL

124.4

1,905.6

2,303.1

311.7

9,282.1

9,015.2

73.5

442.4

SOY OIL

28.9

239.7

148.3

2.1

978.5

665.1

0.0

11.0

RICE


   L G RGH

18.5

99.2

232.6

0.9

1,318.4

1,255.9

0.0

57.0

   M S RGH

0.0

23.6

15.0

0.4

72.9

88.4

0.0

5.7

   L G BRN

0.1

11.2

2.5

0.3

57.2

39.0

0.0

0.0

   M&S BR

0.1

31.6

0.1

0.1

87.4

152.4

0.0

0.0

   L G MLD

1.3

55.6

203.3

4.3

834.9

793.3

0.0

0.0

   M S MLD

1.7

115.7

129.0

15.0

625.2

525.1

0.0

0.1

     TOTAL

21.6

336.9

582.6

21.1

2,996.0

2,854.0

0.0

62.7

COTTON


THOUSAND RUNNING BALES      

   UPLAND

43.8

4,156.3

3,349.6

329.3

12,880.4

11,966.4

6.7

3,496.8

   PIMA

2.8

121.5

112.2

7.3

455.7

616.7

3.6

37.5


Terry Reilly

Senior Commodity Analyst – Grain and Oilseeds

Futures International │190 S LaSalle St., Suite 410│Chicago, IL  60603

W: 312.604.1366

treilly@futures-int.com

AIM: fi_treilly

ICE IM: 
treilly1

Skype: fi.treilly


Description: Description: Description: Description: FImail


Trading of futures, options, swaps and other derivatives is risky and is not suitable for all persons.  All of these investment products are leveraged, and you can lose more than your initial deposit.  Each investment product is offered
only to and from jurisdictions where solicitation and sale are lawful, and in accordance with applicable laws and regulations in such jurisdiction.  The information provided here should not be relied upon as a substitute for independent research before making
your investment decisions.  Futures International, LLC is merely providing this information for your general information and the information does not take into account any particular individual’s investment objectives, financial situation, or needs.  All investors
should obtain advice based on their unique situation before making any investment decision.  The contents of this communication and any attachments are for informational purposes only and under no circumstances should they be construed as an offer to buy or
sell, or a solicitation to buy or sell any future, option, swap or other derivative.  The sources for the information and any opinions in this communication are believed to be reliable, but Futures International, LLC does not warrant or guarantee the accuracy
of such information or opinions.  Futures International, LLC and its principals and employees may take positions different from any positions described in this communication.  Past results are not necessarily indicative of future results.