PDF attached
Another
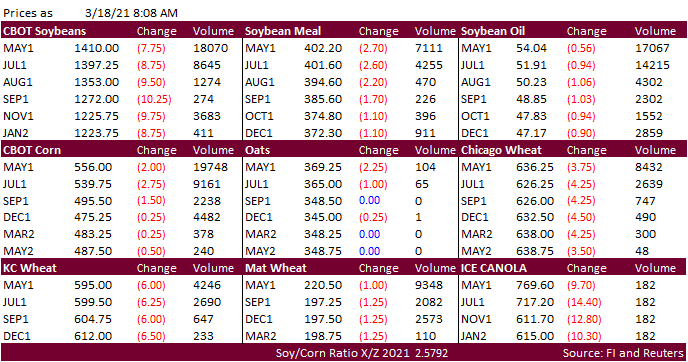
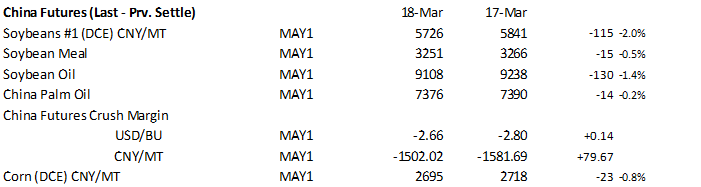
696,000 tons of corn was sold to China. Export sales was slightly supportive for corn and neutral for the soybean complex and wheat. Improving SA weather (Argentina) continues to pressure the CBOT soybean complex, led to the downside by soybean oil in part
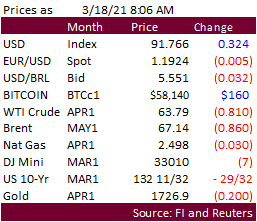
to more than a 3.5 percent decrease in Malaysian palm futures overnight. China soybean oil slipped 1.4%, China meal down 0.5% and China soybeans off 2.0%. Corn futures are lower in current and new-crop contracts on a higher USD (+33 points) and weakness
in WTI (down $1.25), wheat and soybeans. Recent rains in Argentina’s Pampas growing areas were thought to have stopped the decay of late corn and soybean yields. The morning weather outlook showed no major changes to the SA and US forecast. US wheat futures
are lower again on good Black Sea weather promoting favorable early wheat development and sliding Black Sea wheat export prices. Ukrainian wheat export prices fell $10 a ton this week, according to APK-Inform. Yesterday SovEcon raised its Russian forecast
for 2021 wheat crop to 79.3 million tons from 76.2 million tons previously. Crop conditions are good for the Black Sea region. Ukraine mentioned they do not plan to impose variable grain export taxes.
![]()
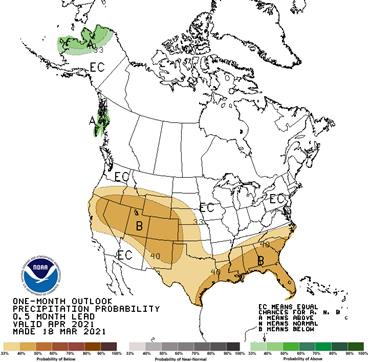
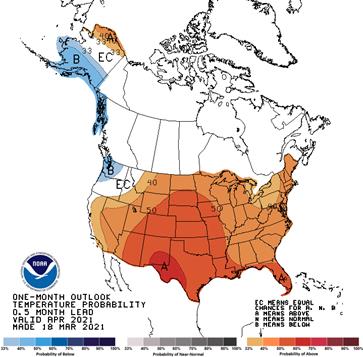
NOAA
30-day:
World
Weather Inc.
A
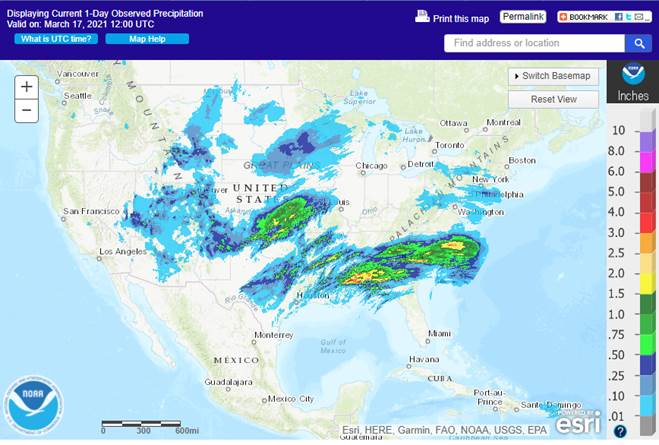
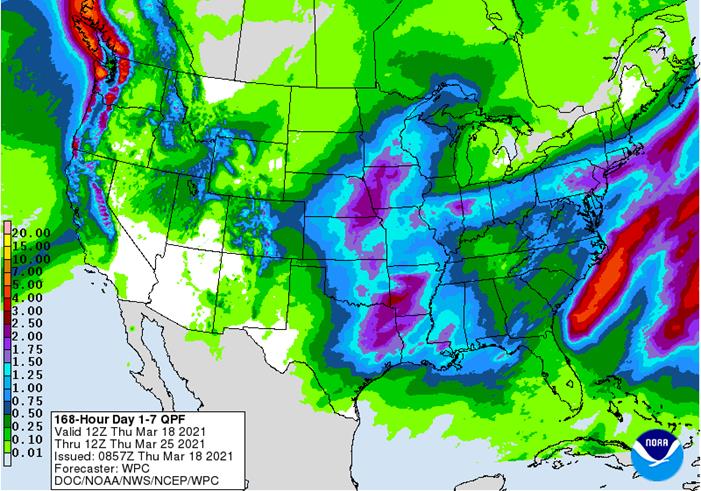
tornado outbreak is in progress this evening from the eastern Delta through Alabama and will continue into tonight. The storm system responsible for this will also promote another round of significant rain across the central and southern Corn Belt tonight
into Thursday with a small area of notable snow in eastern Kansas and western Missouri. Some flooding is likely since topsoil moisture is already excessive in much of this area.
This evening’s GFS model run was wetter in the second week of the outlook compared to the midday GFS model. This evening’s run was particularly aggressive with a weather disturbance from Nebraska through the far northern Corn Belt Mar. 28 – 29 and showed too
much rain and snow. The evening run then showed a meaningful rain and snow event in the Northern Plains Mar. 30 – Apr. 1 which would be beneficial for soil moisture; however, this was also likely overdone.
In
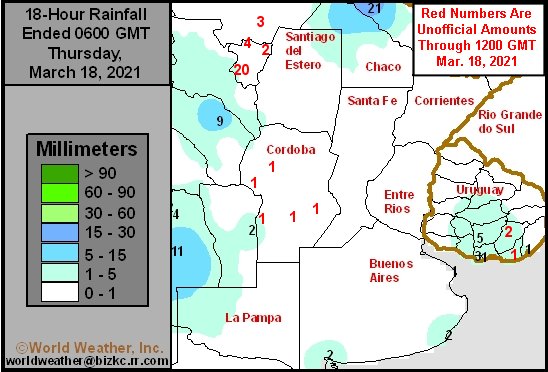
Argentina, occasional periods of meaningful shower and thunderstorm activity through the end of March will help to further reduce crop stress and improve overall crop conditions in the nation, especially in east-central and northeastern areas where the greatest
rain is likely.
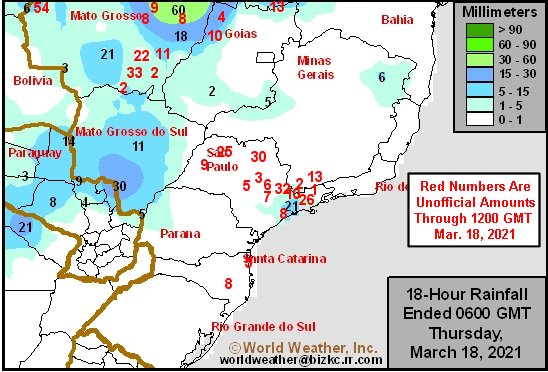
In Brazil, this evening’s GFS model run continued to show conditions trending drier through this weekend with the exception of the far south. Much of the nation will become drier-biased which will be beneficial for soybean harvesting, Safrinha corn planting,
and late season crop development.
Source:
World Weather inc.
Source:
World Weather inc.
Source:
World Weather inc.
Bloomberg
Ag Calendar
Thursday,
March 18:
- USDA
weekly crop net-export sales for corn, soybeans, wheat, cotton, pork, beef, 8:30am - Port
of Rouen data on French grain exports - China
customs to publish trade data, including import numbers for corn, wheat, sugar and pork - USDA
total milk production
Friday,
March 19:
- ICE
Futures Europe weekly commitments of traders report (6:30pm London) - CFTC
commitments of traders weekly report on positions for various U.S. futures and options, 3:30pm - FranceAgriMer
weekly update on crop conditions - U.S.
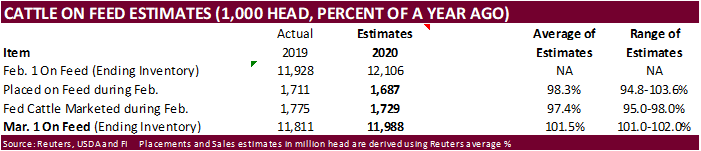
cattle on feed
Saturday,
March 20:
- China
3rd batch of Jan.-Feb. trade data, including country breakdowns for energy and commodities. No timing
USDA
export sales
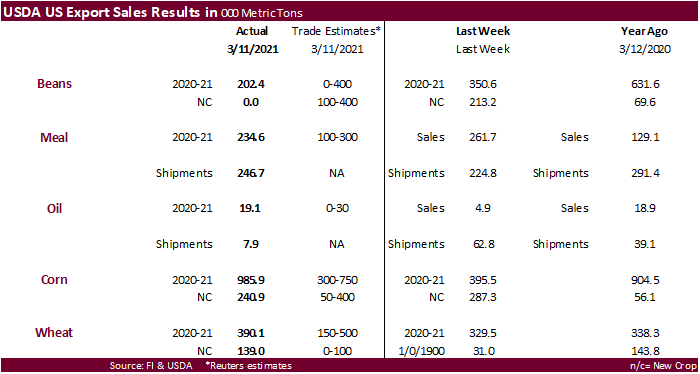
were within expectations for the soybean complex, above estimates for corn and within for all-wheat. China switched 130k wheat from unknown and 612,000 tons of corn from unknown. Sorghum sales were very good at 267,200 tons. Pork sales were 39,700 tons.
US
Initial Jobless Claims Mar-13: 770K (exp 700K; R prev 725K)
–
Continuing Claims Mar-6: 4124K (exp 4034K; R prev 4142K)
US
Philadelphia Fed Business Outlook Mar: 51.8 (exp 23.3; prev 23.1)
- Corn
futures are
lower in current and new-crop contracts on a higher USD and weakness in wheat and soybeans. Recent rains in Argentina’s Pampas growing areas were thought to have stopped the decay of late corn and soybean yields. Corn could trade two-sided today but keep
in mind the USD was down 38 and WTI off $1.38 as of 8:09. Under the USDA 24-hour announcement system, private exporters sold 696,000 tons of corn to China for 2020-21. 3.076 million tons were sold last three days, 8.924 million tons to China since Jan 1.
- USDA
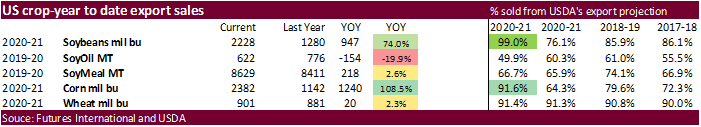
export sales were above trade estimates for corn. China switched 612,000 tons of corn from unknown. 91.6& of USDA’s 2.6 billion corn crop export estimate had been sold. Remember another 3.0+ million tons will be added next week. Sorghum sales were very
good at 267,200 tons (China 289,200 MT, including 120,000 MT switched from unknown destinations and decreases of 15,200 MT). Pork sales were 39,700 tons (China 5,800 tons).
- Another
storm system is working its way across the US Delta and Midwest today through Saturday. No major changes to the US forecast was noted this morning.
- China
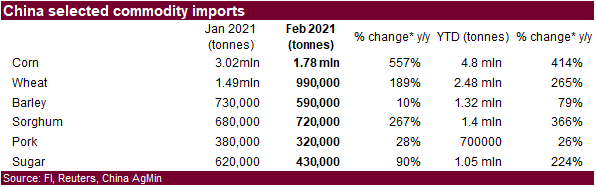
plans to be aggressive this season in combatting fall army worm. - China
imported 1.78 million tons of corn during the month of February, down from 3.02 million tons from Jan but 557 percent higher than Feb year ago.
- China’s
AgMin reported the sow heard up 34 percent from the previous year, up 1 percent in both January and February. Some think the heard fell as much as 5 percent during the past two months from ASF problems. China pork prices eroded during February and FH March.
- Weekly
US ethanol production increased a more than expected 33,000 barrels (BB estimate up 8,000) from the previous week to 971,000 barrels, and stocks declined a large 730,000 barrels to 21.340 million. Production was highest since December 18 and stocks lowest
since November 27. Stocks are down nearly 3 million barrels over the past four weeks.
- The
USDA weekly Broiler Hatchery report showed eggs set down slightly and chicks placed down 3 percent. Cumulative placements from the week ending January 9, 2021 through March 13, 2021 for the United States were 1.86 billion. Cumulative placements were down
2 percent from the same period a year earlier. - Reuters:
(yesterday) “Chicago Mercantile Exchange lean hog futures rallied for a second straight session on Wednesday and the spot contract rose to the highest in 6-1/2 years on elevated pork prices and expectations for continued strong pork export sales.”
Export
developments.
-
Under
the USDA 24-hour announcement system, private exporters sold 696,000 tons of corn to China for 2020-21.
-
Turkey’s
TMO bought 115,000 tons of corn for shipment March 25-April 20. estimated tonnage sold, seller and price in dollars per ton C&F. Traders believe most was Russian origin.
-
30,000
tons $278.10 -
30,000
tons $278.10 -
30,000
tons $278.70 -
25,000
tons $280.70
- Improving
SA weather (Argentina crop stress nothing like it was a week ago) continues to pressure the CBOT soybean complex. SBO is leading the downside in part to more than a 3.5 percent decrease in Malaysian palm futures overnight. China soybean oil slipped 1.4%,
China meal down 0.5% and China soybeans off 2.0%. - USDA
export sales were within expectations for the soybean complex. 99 percent of USDA’s export projection had been sold.
- The
morning weather outlook showed no major changes to the SA and US forecast.
- China
plans to adjust their compound feed formula that will require less corn and soybean meal for animal feed. This might come after China imported 4.8 million ton of corn during the Jan and Feb period, 400 percent higher than the same period a year ago, and weekly
Brazil soybean loadings to China are currently running over 2 million tons. Details of the plan were not provided.
- China
and the US meet today in Alaska and latest speculation was that China was going to ask to the US to roll back on some of the previous agreed concessions.
- Rotterdam
vegetable oil prices were 7-20 euros lower and meal mostly unchanged to 2 euros higher.
- Offshore
values are leading CBOT SBO 34 points lower and meal $1.10 short ton higher.
- China
cash crush margins on our analysis were 168 cents, (184 previous) up from 178 cents late last week and compares to 168 cents year earlier.
China
futures:
Malaysian
palm oil:

Export
Developments
-
Results
awaited: Iran seeks 30,000 tons of sunflower oil and 30,000 tons of soybean oil on March 18 for March and April shipment.
Third
month rolling Malaysian palm oil vs. palm (RHS) and Brent (LHS)
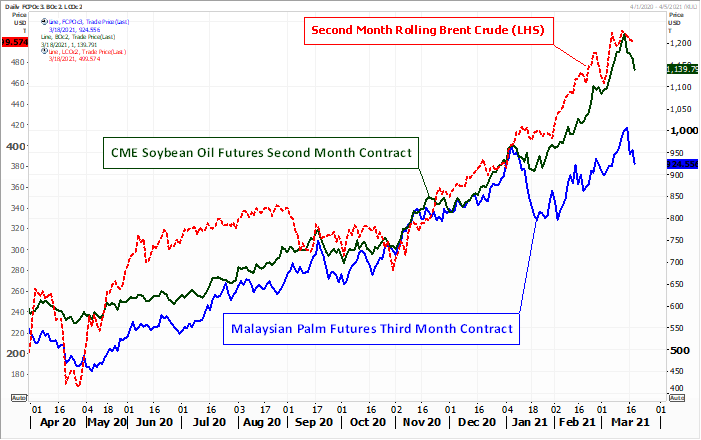
Source:
Reuters and FI
- US
wheat futures are lower again on good Black Sea weather promoting favorable early wheat development and sliding Black Sea wheat export prices.
Ukrainian
wheat export prices fell $10 a ton this week, according to APK-Inform. Yesterday
SovEcon
raised its Russian forecast for 2021 wheat crop to 79.3 million tons from 76.2 million tons previously. Crop conditions are good for the Black Sea region. Ukraine mentioned they do not plan to impose variable grain export taxes.
- USDA
export sales were within expectations for all-wheat. China switched 130k wheat from unknown.
- US
weather looks good for the wheat emerging from dormancy and we look for improved crop conditions in coming weeks.
- EU
May milling wheat was 1.00 lower at 220.50 euros as of 7:00 am CT. - CME
Group announced they will list cash settled Ukrainian wheat futures and options contracts next month via Platts. Sunday April 11 is the launch date.
- Yesterday
APK-Inform estimated Ukraine grain exports at 45.9 million tons, down from 54.98 million in 2019-20.
- Strategie
Grains lowered its forecast of soft wheat exports from the European Union and Britain by 900,000 tons to 25.2 million (2020-21). Soft wheat production was unchanged at 129.6 million tons from 119.3 million for 2019-20.
Export
Developments.
- South
Korean flour mills bought 50,000 tons of milling wheat from the United States for shipment between June 1 and June 30. Reuters noted: “The purchase involved 25,385 tons of soft white wheat of 9.5% to 10.5% protein at an estimated $269.74 a ton, 1,520 tons
of soft white wheat of a maximum 8.5% protein bought at $280.76, 8,810 tons of hard red winter of a minimum 11.5% protein bought at $266.83 a ton and 14,285 tons of northern spring wheat of 14% minimum protein bought at $277.76 per ton. - Tunisia’s
state grains agency received offers for soft wheat with lowest at $298.78/ton c&f. They bought soft wheat and durum but details were lacking.
The
soft wheat was said to have been bought at $298.49 and $302.19 a ton c&f. The durum was bought at an estimated $374.68 a ton c&f. Lowest price for the barley was said to be $275.68 a ton c&f. (Reuters) - Results
awaited: Algeria’s ONAB seeks 40,000 tons of animal feed barley on March 18 for April 15-30 shipment.
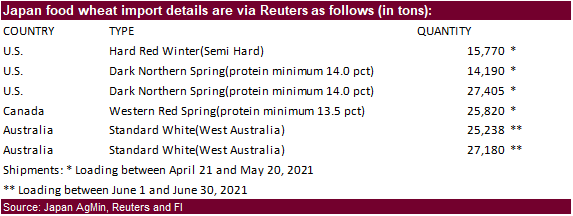
- Japan
bought 135,603 tons of food wheat from the US, Canada and Australia. Original details as follows:
- Jordan
is back in for feed barley on March 23. Possible shipment combinations are Oct. 1-15, Oct. 16-31, Nov. 1-15 and Nov. 16-30.
Rice/Other
·
Lowest offer $417.71/ton CIF – Bangladesh seeks 50,000 tons of rice.
·
Mauritius bought 4,000 tons of long grain white rice from India and Pakistan at an average price of around $509.6 a ton c&f.
·
South Korea’s Agro-Fisheries & Food Trade Corp. seeks 208,217 tons of rice, on March 25 for arrival in South Korea in 2021 between May 1 and Oct. 31. 64,444 tons of non-glutinous brown rice is sought from the United States.
Rest from Thailand, China, Australia and Vietnam.
·
Bangladesh also seeks 50,000 tons of rice on March 28.
·
Syria seeks 25,000 tons of white rice on March 29, from China or Egypt.
·
Syria seeks 39,400 tons of white rice on April 19. Origin and type might be White Chinese rice or Egyptian short grain rice.
U.S. EXPORT SALES FOR WEEK ENDING 3/11/2021
|
|
CURRENT MARKETING YEAR |
NEXT MARKETING YEAR |
||||||
|
COMMODITY |
NET SALES |
OUTSTANDING SALES |
WEEKLY EXPORTS |
ACCUMULATED EXPORTS |
NET SALES |
OUTSTANDING SALES |
||
|
CURRENT YEAR |
YEAR AGO |
CURRENT YEAR |
YEAR AGO |
|||||
|
|
THOUSAND METRIC TONS |
|||||||
|
WHEAT |
|
|
|
|
|
|
|
|
|
HRW |
166.2 |
1,428.2 |
1,746.6 |
114.1 |
6,896.9 |
7,133.3 |
25.5 |
283.5 |
|
SRW |
11.1 |
387.9 |
306.2 |
37.1 |
1,377.7 |
2,031.4 |
6.2 |
302.8 |
|
HRS |
142.2 |
1,765.4 |
1,614.3 |
318.3 |
5,537.0 |
5,490.4 |
30.3 |
276.0 |
|
WHITE |
71.4 |
2,016.8 |
1,070.4 |
192.8 |
4,428.8 |
3,748.7 |
77.0 |
157.3 |
|
DURUM |
-0.9 |
153.3 |
146.4 |
0.0 |
518.4 |
682.2 |
0.0 |
5.0 |
|
TOTAL |
390.1 |
5,751.6 |
4,883.9 |
662.3 |
18,758.8 |
19,086.0 |
139.0 |
1,024.6 |
|
BARLEY |
0.0 |
11.5 |
14.7 |
0.0 |
22.0 |
34.4 |
0.0 |
14.5 |
|
CORN |
985.9 |
30,542.7 |
12,815.7 |
2,199.4 |
29,962.1 |
16,202.1 |
240.9 |
1,794.9 |
|
SORGHUM |
267.2 |
2,758.4 |
1,206.9 |
353.2 |
3,447.3 |
1,158.0 |
0.0 |
756.0 |
|
SOYBEANS |
202.4 |
6,779.6 |
4,315.7 |
534.1 |
53,854.4 |
30,531.7 |
0.0 |
5,076.2 |
|
SOY MEAL |
234.6 |
2,708.2 |
3,089.7 |
246.7 |
5,920.6 |
5,320.8 |
-0.3 |
233.1 |
|
SOY OIL |
19.1 |
112.9 |
236.9 |
7.9 |
509.0 |
539.2 |
0.0 |
0.6 |
|
RICE |
|
|
|
|
|
|
|
|
|
L G RGH |
79.3 |
308.5 |
385.2 |
35.5 |
1,043.2 |
879.6 |
0.0 |
0.0 |
|
M S RGH |
0.0 |
5.4 |
37.7 |
4.5 |
23.5 |
24.1 |
0.0 |
0.0 |
|
L G BRN |
0.1 |
4.1 |
14.5 |
8.7 |
33.1 |
35.9 |
0.0 |
0.0 |
|
M&S BR |
0.0 |
70.2 |
66.0 |
0.5 |
82.4 |
41.8 |
0.0 |
0.0 |
|
L G MLD |
16.4 |
57.5 |
76.6 |
35.0 |
436.2 |
639.9 |
0.0 |
0.0 |
|
M S MLD |
16.4 |
234.0 |
212.5 |
7.1 |
355.0 |
390.0 |
0.0 |
0.0 |
|
TOTAL |
112.3 |
679.7 |
792.5 |
91.2 |
1,973.4 |
2,011.4 |
0.0 |
0.0 |
|
COTTON |
|
THOUSAND RUNNING BALES |
||||||
|
UPLAND |
437.7 |
5,394.1 |
7,028.1 |
351.9 |
8,833.3 |
7,839.7 |
143.3 |
1,432.2 |
|
PIMA |
7.0 |
259.8 |
234.2 |
10.3 |
468.1 |
287.0 |
0.0 |
1.1 |
This
summary is based on reports from exporters for the period March 5 – 11, 2021.
Wheat: Net
sales of 390,100 metric tons (MT) for 2020/2021 were up 18 percent from the previous week and 40 percent from the prior 4-week average. Increases primarily for China (132,300 MT, including 130,000 MT switched from unknown destinations), Mexico (93,000 MT,
including decreases of 1,000 MT), Taiwan (85,000 MT), the Philippines (75,400 MT), and Thailand (54,000 MT), were offset by reductions primarily for unknown destinations (215,800 MT). For 2021/2022, net sales of 139,000 MT were reported for China (65,000
MT), the Philippines (32,000 MT), unknown destinations (28,800 MT), Honduras (7,000 MT) and the Dominican Republic (6,200 MT). Exports of 662,300 MT were up 41 percent from the previous week and 61 percent from the prior 4-week average. The destinations
were primarily to the Philippines (178,000 MT), South Korea (100,100 MT), Mexico (80,600 MT), China (67,300 MT), and Bangladesh (58,400 MT).
Optional
Origin Sales:
For 2020/2021, the current outstanding balance of 10,000 MT, all Spain.
Corn:
Net sales of 985,900 MT for 2020/2021 were up noticeably from the previous week and from the prior 4-week average. Increases primarily for China (624,800 MT, including 612,000 MT switched from unknown destinations), Mexico (285,500 MT, including 24,500 MT
switched from unknown destinations and decreases of 2,000 MT), Colombia (208,500 MT, including 116,000 MT switched from unknown destinations and decreases of 45,300 MT), South Korea (168,200 MT, including 68,000 MT switched from unknown destinations and decreases
of 15,500 MT), and Japan (138,300 MT, including 88,800 MT switched from unknown destinations and decreases of 12,000 MT), were offset by reductions primarily for unknown destinations (1,038,000 MT). For 2021/2022, net sales of 240,900 MT were reported for
Mexico (195,700 MT), Guatemala (36,300 MT), and Canada (8,900 MT). Exports of 2,199,400 MT–a marketing-year high–were up 38 percent from the previous week and 42 percent from the prior 4-week average. The destinations were primarily to Japan (434,400 MT),
Mexico (390,100 MT), China (356,900 MT), Colombia (199,900 MT), and Taiwan (192,400 MT).
Optional
Origin Sales:
For 2020/2021, new optional origin sales of 30,000 MT were reported for the Ukraine. Options were exercised to export 125,000 MT to Taiwan (70,000 MT) and South Korea (55,000 MT) from the United States. The current outstanding balance of 1,079,400 MT is for
South Korea (738,000 MT), unknown destinations (244,000 MT), China (65,000 MT), and the Ukraine (32,400 MT).
Late
Reporting:
For 2020/2021, net sales totaling 30,000 MT were reported late for Tunisia.
Barley:
No net sales or exports were reported for the week.
Sorghum:
For 2020/2021, net sales of 267,200 MT resulting in increases for China (289,200 MT, including 120,000 MT switched from unknown destinations and decreases of 15,200 MT), were offset by reductions for unknown destinations (22,000 MT). Exports of 353,200 MT–a
marketing-year high–were up noticeably from the previous week and from the prior 4-week average. The destination was China.
Rice:
Net sales of 112,300 MT for 2020/2021 were up noticeably from the previous week and up 48 percent from the prior 4-week average. Increases were primarily for Venezuela (30,000 MT), Mexico (25,900 MT, including decreases of 100 MT), Nicaragua (18,000 MT),
Haiti (15,100 MT, including decreases of 200 MT), and Japan (12,000 MT). Exports of 91,200 MT were up 89 percent from the previous week and 24 percent from the prior 4-week average. The destinations were primarily to Mexico (32,600 MT), Haiti (30,400 MT),
the United Kingdom (8,200 MT), Honduras (8,200 MT), and Canada (2,900 MT).
Soybeans:
Net sales of 202,400 MT for 2020/2021 were down 42 percent from the previous week and 31 percent from the prior 4-week average. Increases primarily for China (71,500 MT, including 66,000 MT switched from unknown destinations and decreases of 100 MT), Mexico
(66,000 MT, including decreases of 500 MT), Bangladesh (57,100 MT, including 55,000 MT switched from unknown destinations), Indonesia (31,300 MT, including decreases of 900 MT), and Japan (25,100 MT, including 10,700 MT switched from unknown destinations and
decreases of 1,300 MT), were offset by reductions primarily for unknown destinations (123,200 MT). Exports of 534,100 MT were down 24 percent from the previous week and 44 percent from the prior 4-week average. The destinations were primarily to Indonesia
(127,700 MT), Egypt (90,200 MT), China (82,000 MT), Mexico (70,500 MT), and Bangladesh (57,100 MT).
Exports
for Own Account:
The current exports for own account outstanding balance is 5,800 MT, all Canada.
Late
Reporting:
For 2020/2021, net sales totaling 600 MT were reported late for Taiwan.
Soybean
Cake and Meal:
Net sales of 234,600 MT for 2020/2021 were down 10 percent from the previous week, but up 1 percent from the prior 4-week average. Increases primarily for the Philippines (50,300 MT), Canada (42,500 MT), Guatemala (38,300 MT), Peru (23,000 MT), and Mexico
(19,400 MT, including decreases of 5,000 MT), were offset by reductions for Indonesia (4,400 MT) and Belgium (1,600 MT). For 2021/2022, net sales reductions of 300 MT resulting in increases primarily for Guatemala (5,900 MT), were offset by reductions for
El Salvador (6,300 MT). Exports of 246,700 MT were up 10 percent from the previous week, but down 16 percent from the prior 4-week average. The destinations were primarily to Indonesia (52,400 MT), Mexico (43,400 MT), Ecuador (33,000 MT), the Dominican Republic
(32,000 MT), and Canada (28,100 MT).
Soybean
Oil:
Net sales of 19,100 MT for 2020/2021 were up noticeably from the previous week and from the prior 4-week average. Increases primarily for Colombia (17,000 MT), the Dominican Republic (1,200 MT), Mexico (700 MT), and Jamaica (700 MT), were offset by reductions
for Canada (300 MT), Venezuela (200 MT), and Guatemala (100 MT). Exports of 7,900 MT were down 87 percent from the previous week and 75 percent from the prior 4-week average. The destinations were primarily to Venezuela (4,300 MT), Guatemala (1,900 MT),
Mexico (1,100 MT), Canada (400 MT), and Honduras (200 MT).
Cotton:
Net sales of 437,700 RB for 2020/2021 were up noticeably from the previous week and from the prior 4-week average. Increases primarily for Vietnam (135,300 RB, including 5,600 RB switched from China, 1,800 RB switched from South Korea, and 1,600 RB switched
from Japan), China (92,700 RB), Pakistan (58,500 RB), Turkey (51,200 RB), and Bangladesh (49,600 RB), were offset by reductions primarily for Hong Kong (1,000 RB). For 2021/2022, net sales of 143,300 RB were primarily for Mexico (112,900 RB). Exports of
351,900 RB were unchanged from the previous week, but up 6 percent from the prior 4-week average. Exports were primarily to China (86,000 RB), Vietnam (76,400 RB), Pakistan (61,000 RB), Turkey (28,400 RB), and Indonesia (26,902 RB). Net sales of Pima totaling
7,000 RB were down 44 percent from the previous week and 40 percent from the prior 4-week average. Increases for India (4,200 RB), China (2,500 RB), and Thailand (400 RB), were offset by reductions for Austria (100 RB). Exports of 10,300 RB were down 56
percent from the previous week and 27 percent from the prior 4-week average. The destinations were primarily to India (4,100 RB), Vietnam (3,800 RB), Italy (1,300 RB), Thailand (400 RB), and Turkey (400 RB).
Exports
for Own Account:
For 2020/2021, new exports for own account totaling 4,600 RB were to Vietnam (3,000 RB) and China (1,600 RB). Exports for own account totaling 2,700 RB to China (2,600 RB) and Bangladesh (200 RB) were applied to new or outstanding sales. The current exports
for own account outstanding balance of 36,800 RB is for China (27,300 RB), Vietnam (9,100 RB), and Bangladesh (400 RB).
Hides
and Skins:
Net sales of 557,900 pieces for 2021 were up 8 percent from the previous week and 54 percent from the prior 4-week average. Increases primarily for China (412,200 whole cattle hides, including decreases of 11,800 pieces), Mexico (66,400 whole cattle hides,
including decreases of 700 pieces), Thailand (29,200 whole cattle hides, including decreases of 500 pieces), South Korea (23,000 whole cattle hides, including decreases of 2,800 pieces), and Brazil (18,300 whole cattle hides, including decreases of 200 pieces),
were offset by reductions for Taiwan (1,200 pieces).
Exports of 364,300 pieces for 2021 were down 7 percent from the previous week, but up 5 percent from the prior 4-week average. Whole cattle hides exports were primarily to China (195,800 pieces), South Korea (74,900 pieces),
Mexico (31,700 pieces), Thailand (31,300 pieces), and Brazil (11,400 pieces).
Net
sales of 94,100 wet blues for 2021 were down 35 percent from the previous week and 14 percent from the prior 4-week average. Increases were primarily for China (34,400 unsplit), Vietnam (24,700 unsplit, including decreases of 100 unsplit), Taiwan (10,400
unsplit and 5,100 grain splits), Mexico (6,800 unsplit and 2,900 grain splits), and Italy (5,300 unsplit, including decreases of 700 unsplit). Exports of 99,400 wet blues for 2021 were down 9 percent from the previous week and 1 percent from the prior 4-week
average. The destinations were primarily to China (28,900 unsplit), Vietnam (25,900 unsplit), Italy (15,500 unsplit and 9,600 grain splits), Taiwan (3,500 grain splits and 3,200 unsplit), and Thailand (5,800 unsplit). Net sales of 181,100 splits resulting
in increases for China (192,300 pounds, including decreases of 14,700 pounds), were offset by reductions for Vietnam (11,200 pounds). Exports of 391,100 pounds were to Vietnam.
Beef:
Net
sales of 25,900 MT reported for 2021 were up 24 percent from the previous week and 39 percent from the prior 4-week average. Increases were primarily for Japan (8,100 MT, including decreases of 600 MT), South Korea (5,400 MT, including decreases of 400 MT),
China (5,300 MT, including decreases of 100 MT), Taiwan (2,000 MT, including decreases of 100 MT), and Hong Kong (1,700 MT, including decreases of 200 MT). Exports of 17,800 MT were unchanged from the previous week, but up 4 percent from the prior 4-week
average. The destinations were primarily to Japan (5,700 MT), South Korea (4,000 MT), China (2,700 MT), Mexico (1,300 MT), and Taiwan (1,100 MT).
Pork:
Net
sales of 39,700 MT reported for 2021 were up 23 percent from the previous week and 5 percent from the prior 4-week average. Increases primarily for Mexico (18,200 MT, including decreases of 400 MT), China (5,800 MT, including decreases of 1,300 MT), Japan
(4,900 MT, including decreases of 300 MT), South Korea (4,200 MT, including decreases of 800 MT), and Canada (3,100 MT, including decreases of 400 MT), were offset by reductions primarily for Australia (200 MT). Exports of 40,600 MT were up 3 percent from
the previous week and 5 percent from the prior 4-week average. The destinations were primarily to China (12,700 MT), Mexico (8,900 MT), Japan (5,200 MT), South Korea (3,600 MT), and the Philippines (2,200 MT).
Terry Reilly
Senior Commodity Analyst – Grain and Oilseeds
Futures International
One Lincoln Center
18 W 140 Butterfield Rd.
Oakbrook Terrace, Il. 60181
W: 312.604.1366
ICE IM:
treilly1
Skype: fi.treilly

Trading of futures, options, swaps and other derivatives is risky and is not suitable for all persons. All of these investment products are leveraged, and you can lose more than your initial deposit. Each investment product is offered
only to and from jurisdictions where solicitation and sale are lawful, and in accordance with applicable laws and regulations in such jurisdiction. The information provided here should not be relied upon as a substitute for independent research before making
your investment decisions. Futures International, LLC is merely providing this information for your general information and the information does not take into account any particular individual’s investment objectives, financial situation, or needs. All investors
should obtain advice based on their unique situation before making any investment decision. The contents of this communication and any attachments are for informational purposes only and under no circumstances should they be construed as an offer to buy or
sell, or a solicitation to buy or sell any future, option, swap or other derivative. The sources for the information and any opinions in this communication are believed to be reliable, but Futures International, LLC does not warrant or guarantee the accuracy
of such information or opinions. Futures International, LLC and its principals and employees may take positions different from any positions described in this communication. Past results are not necessarily indicative of future results.