PDF attached
Private exporters reported sales of 184,000 metric tons of soybeans for delivery to unknown destinations during the 2022/2023 marketing year.
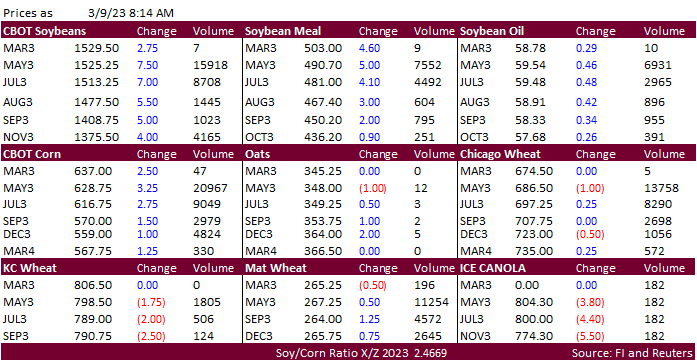
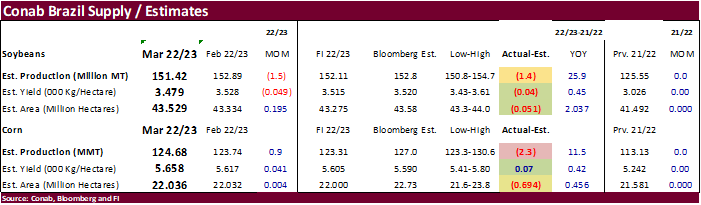
WTI crude oil turned higher, USD lower, and US equities rebounded. USDA export sales were poor for soybeans, good for meal, and ok for soybean oil. Corn sales were better than expected and slow for all-wheat. Soybeans are higher from strength in soybean meal on Argentina soybean crop production concerns after the Rosario grains exchange slashed their production estimate. Conab lowered Brazil soybean production and raised corn. Both production estimates were less than expected. Offshore values were leading SBO lower by about 36 points this morning and meal $3.90 short ton higher. Corn futures are higher on SA crop production concerns. Chicago wheat futures hit an 18-month low on Black Sea shipping deal extension optimism and large global supplies.
Weather
WORLD WEATHER HIGHLIGHTS FOR MARCH 9, 2023
- Argentina rainfall “may” increase after near and after March 15, according to the latest model runs overnight
- Confidence is relatively good for some increase in rainfall, but how significant that may or may not be remains to be seen
- World Weather, Inc. has been suggesting week 2 rainfall in Argentina would be closer to normal in its afternoon weather outlook maps in recent days and the model change overnight seems to fit this relatively well
- Brazil will continue wet or at least will experience frequent precipitation over the next ten days to two weeks except in Rio Grande do Sul and a few areas in Bahia and Espirito Santo where limited rain is expected to continue.
- India weather is still advertised a little wetter in the east and south during the second week of the outlook today while precipitation through March 15 is more limited and
- The moisture will come too late for most crops, but a quality improvement would be possible for some
- The moisture will help hold back the temperatures and that in itself will help reduce crop stress potentially
- China’s Yangtze River Basin will receive sufficient rain to support crop development favorably
- Other areas in China will experience net drying and warmer than usual weather for a while
- Central through southeastern Queensland, Australia will receive significant rain over the next few days benefiting all crops, especially those not irrigated
- Europe is still trending wetter with the biggest improvement likely in France, Germany and the U.K.
- Drought or abnormally dry conditions will continue in Norway, eastern Spain and the lower Danube River Basin
- U.S. west-central and southwestern Plains will continue lacking rain with unirrigated wheat needing rain
- South Texas and the Texas Coastal Bend could get some rain during the middle to latter part of next week
- Snow will fall from southern Canada’s Prairies into parts of the Midwest through the weekend
- Impressive snowfall and coastal rain will impact California over the coming week Friday’s storm may produce record snowfall in the southern Sierra Nevada
- North Africa is still advertised dry
Source: World Weather, INC.
Bloomberg Ag calendar
Thursday, March 9:
- USDA weekly net-export sales for corn, soybeans, wheat, cotton, pork and beef, 8:30am
- Port of Rouen data on French grain exports
- Brazil’s Conab releases data on production, yield and area for corn and soybeans
Friday, March 10:
- ICE Futures Europe weekly commitments of traders report
- CFTC commitments of traders weekly report on positions for various US futures and options, 3:30pm
- Malaysian Palm Oil Board’s data on stockpiles, production and exports
- FranceAgriMer’s weekly crop conditions reports
- Brazil’s Unica may release cane crush and sugar output data (tentative)
- Coffee festival in Dak Lak province, Vietnam
Source: Bloomberg and FI
CFTC Commitment of Traders as of February 14
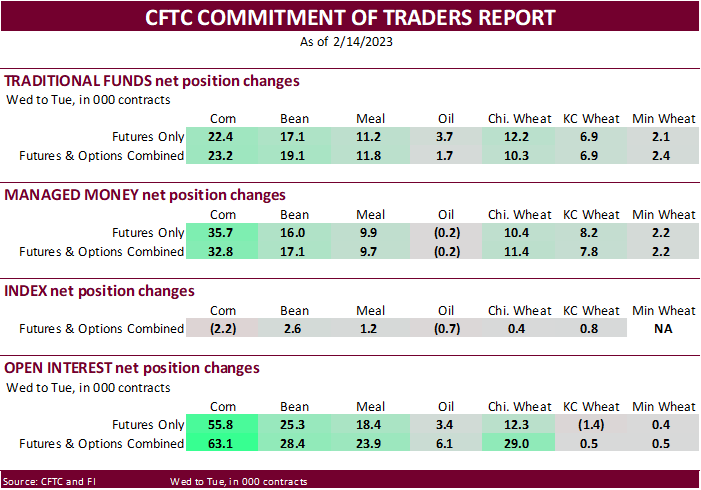
Reuters table
SUPPLEMENTAL Non-Comm Indexes Comm
Net Chg Net Chg Net Chg
Corn 157,055 25,490 355,686 -2,218 -425,857 -20,562
Soybeans 144,324 19,309 138,354 2,601 -236,114 -21,469
Soyoil -86 2,438 103,949 -699 -109,441 -1,257
CBOT wheat -68,163 11,312 98,922 404 -27,822 -10,105
KCBT wheat -3,517 5,119 49,707 847 -45,167 -8,458
=================================================================================
FUTURES + OPTS Managed Swaps Producer
Net Chg Net Chg Net Chg
Corn 234,865 32,847 220,037 1,481 -421,698 -21,950
Soybeans 182,208 17,132 82,250 4,514 -226,955 -23,131
Soymeal 152,399 9,689 79,296 652 -266,561 -13,878
Soyoil 22,323 -171 100,640 1,552 -130,307 -2,767
CBOT wheat -59,957 11,434 66,375 683 -24,166 -9,359
KCBT wheat 11,607 7,825 36,574 -242 -45,547 -9,166
MGEX wheat 1,944 2,239 1,851 217 -6,857 -2,832
———- ———- ———- ———- ———- ———-
Total wheat -46,406 21,498 104,800 658 -76,570 -21,357
Live cattle 104,645 9,035 45,880 704 -152,909 -8,741
Feeder cattle -1,009 -256 1,759 -681 3,905 353
Lean hogs -3,247 8,671 45,549 -498 -41,153 -4,367
Other NonReport Open
Net Chg Net Chg Interest Chg
Corn 53,680 -9,668 -86,885 -2,710 1,685,824 63,086
Soybeans 9,062 1,926 -46,564 -440 868,514 28,403
Soymeal 18,257 2,154 16,607 1,384 512,704 23,934
Soyoil 1,767 1,868 5,577 -483 505,256 6,116
CBOT wheat 20,685 -1,150 -2,938 -1,610 457,528 28,999
KCBT wheat -1,611 -909 -1,024 2,492 206,923 516
MGEX wheat 2,324 139 738 238 60,304 506
———- ———- ———- ———- ———- ———-
Total wheat 21,398 -1,920 -3,224 1,120 724,755 30,021
Live cattle 15,336 570 -12,952 -1,567 392,842 15,813
Feeder cattle 2,367 1,246 -7,021 -662 59,528 206
Lean hogs -1,753 -1,841 604 -1,964 293,901 -3,921
USDA export sales
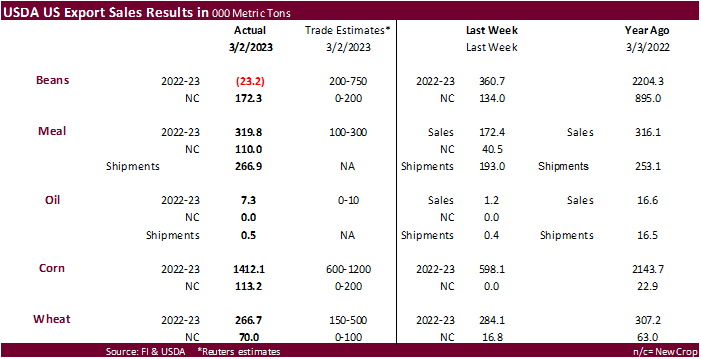
USDA reported a net reduction of 23,200 tons for 2022-23 soybeans and 172,300-ton increase for new-crop sales for the week ending March 2. 2022-23 soybean sales included many switching around for several countries and a net reduction for unknow of 307,600 tons and Pakistan reduction of 132,000 tons. Soybean meal sales were good at 319,800 tons old crop and 110,000 tons new crop. Philippines, Morocco, and Columbia were primary buyers. Soybean oil sales improved to 7,300 tons. US corn export sales were 1.412 million tons, well up from 598,100 tons previous week. Major countries included Japan (469,000 MT, including decreases of 94,800 MT and 101,700 MT – late), South Korea (377,900 MT, including 60,000 MT switched from unknown destinations and decreases of 10,700 MT), unknown destinations (201,300 MT), and Mexico (130,900 MT). Sorghum sales were 155,300 tons and were all for China. Pork sales were 22,100 tons. All-wheat sales of 266,700 tons were slightly above the previous week, and new-crop of 70,000 tons compare to 16,800 tons previous week. Increases were primarily for China (137,000 MT, including 130,000 MT switched from unknown destinations), South Korea (87,000 MT), and the Philippines (77,300 MT, including decreases of 2,200 MT).
Macros
US Initial Jobless Claims: 211K (exp 195K; prev 190K)
Continuing Claims Feb 25: 1718K (exp 1660K; prev 1665K)
· Corn futures are higher on Argentina crop concerns and downward revision to the Brazil corn crop by Conab. Higher WTI crude and lower USD is supportive.
· The Rosario grains exchange lowered its corn estimate to 35 million tons from 42.5 million tons.
· CME feeder cattle futures hit a 2015 high.
· Mexico plans to stick with their decision to partially ban US GMO corn imports and now Canada would like to open dialogs.
- Weekly US ethanol production increased 7,000 barrels per day to 1.010 million barrels. Traders were looking for a 9,000 increase. Stocks were up 545,000 barrels to 25.320 million barrels. Stocks estimate was for a 143,000 increase. For 2022-23, we are using 5.225 billion bushels, unchanged from previous, and compares to 5.250 billion by USDA and 5.326 billion for 2021-22.
Export developments.
· Soybean futures are higher following strength in meal and higher soybean oil. Palm oil snapped a three-day losing streak. Yesterday the Argentina’s Rosario grains exchange lowered their Argentina soybean crop projection to 27 million tons, well below 34.5 million tons estimated last month and below 27.5 million tons recently estimated by the Buenos Aires grains exchange. The AgMin has yet to update their estimate. But back in the dry conditions of 1999, Argentina soybean production was only 20 million tons. Note the area planted back then was smaller. Estimates started the season above 40 million tons. Argentina may see its driest season in more than 60 years. USDA is at 33 million tons for the Argentina soybean crop and we think that will be lowered again next month.
· A main road that feeds Brazil’s Paranagua port closed late Wednesday after heavy rain caused a large crack in the road. Some speculate soybean arrivals could slow while other believe products could be railed. Soybean basis has been under pressure there from harvest pressure.
· China’s Sinograin will start buying soybeans from Inner Mongolia and Heilongjiang province.
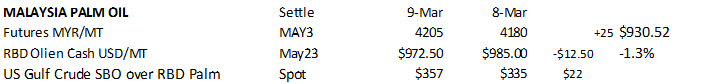
· Malaysia May palm futures were up 25 ringgit to 4,205 and May cash was down $12.50 at $972.50/ton.
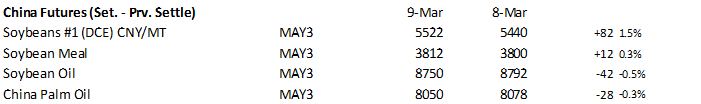
· China soybeans were up 1.5%, meal up 0.3%, SBO down 0.5% and palm oil futures down 0.3%.
· Nearby Rotterdam vegetable oils were mixed from this time yesterday morning and meal mostly 2.00-5.00 euros higher.
· Offshore values were leading SBO lower by about 36 points this morning and meal $3.90 short ton higher.
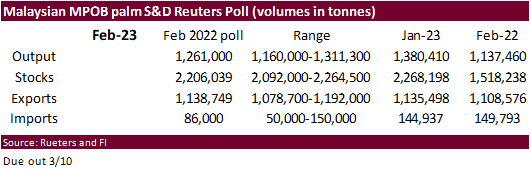
Reuters trade estimates for Malaysian palm oil S&D due out March 10.
Export Developments
· Private exporters reported sales of 184,000 metric tons of soybeans for delivery to unknown destinations during the 2022/2023 marketing year.
· Results awaited: Tunisia seeks up to 9,000 tons of vegetable oils, either crude degummed soyoil or crude degummed rapeseed oil. Delivery is sought between March 30 and April 12.
· Chicago wheat futures hit an 18-month low on Black Sea shipping deal extension optimism and large global supplies. The UN expects a Russian delegation to be in Geneva next week. At the electronic close, Chicago was mixed, KC lower and MN higher. Recall MN was down a good amount yesterday relative to KC.
· China looks to auction off 140,000 tons of wheat from state reserves on March 15.
· Ukraine’s national academy of agricultural science estimates Ukraine’s 2023 grain harvest could fall 37% to 34 million tons. The oilseed area could increase 13 percent to 19.3 million tons. Wheat was estimated between 15 and 18 million tons.
· Paris May wheat was lower by 0.25 euro earlier at 266.50 per ton, near a 1-year low.
Export Developments.
· Saudi Arabia seeks 480,000 tons of wheat for July – August shipment.
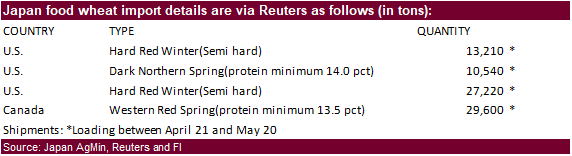
· Japan bought 80,570 tons of food wheat from the US and Canada. Original details as follows:
· Jordan seeks up to 120,000 tons of milling wheat, optional origin, on March 14, for shipment during Aug. 1-15, Aug. 16-31, Sept. 1-15 and Sept. 16-30.
Rice/Other
· None reported
USDA export sales
This summary is based on reports from exporters for the period February 24 – March 2, 2023.
Wheat: Net sales of 266,700 metric tons (MT) for 2022/2023 were down 6 percent from the previous week, but up 11 percent from the prior 4-week average. Increases primarily for China (137,000 MT, including 130,000 MT switched from unknown destinations), South Korea (87,000 MT), the Philippines (77,300 MT, including decreases of 2,200 MT), Taiwan (49,000 MT), and Tunisia (27,100 MT, including 25,000 MT switched from unknown destinations), were offset by reductions primarily for unknown destinations (173,000 MT). Net sales of 70,000 MT for 2023/2024 were reported for Mexico (41,000 MT), Thailand (28,500 MT), and Colombia (500 MT). Exports of 377,100 MT were down 38 percent from the previous week and 24 percent from the prior 4-week average. The destinations were primarily to China (135,000 MT), Mexico (65,500 MT), the Philippines (58,300 MT), South Korea (55,600 MT), and Tunisia (27,100 MT).
Corn: Net sales of 1,412,100 MT for 2022/2023 were up noticeably from the previous week and up 57 percent from the prior 4-week average. Increases primarily for Japan (469,000 MT, including decreases of 94,800 MT and 101,700 MT – late), South Korea (377,900 MT, including 60,000 MT switched from unknown destinations and decreases of 10,700 MT), unknown destinations (201,300 MT), Mexico (130,900 MT, including decreases of 52,400 MT), and Colombia (83,300 MT, including 46,000 MT switched from unknown destinations and decreases of 98,900 MT), were offset by reductions for Italy (35,000 MT), Costa Rica (1,500 MT), and Panama (200 MT). Total net sales of 113,200 MT for 2023/2024 were for Mexico. Exports of 1,052,000 MT–a marketing-year high–were up 58 percent from the previous week and 74 percent from the prior 4-week average. The destinations were primarily to Mexico (462,900 MT, including 10,200 MT – late), Colombia (169,600 MT), Japan (129,500 MT, including 101,700 MT – late), South Korea (104,900 MT), and Guatemala (39,600 MT).
Optional Origin Sales: For 2022/2023, the current outstanding balance of 190,000 MT were for South Korea (150,000 MT) and Egypt (40,000 MT).
Late Reporting: For 2022/2023, net sales totaling 101,700 MT of corn were reported late for Japan. Exports of 111,900 MT were late to Japan (101,700 MT) and Mexico (10,200 MT).
Barley: Total net sales of 6,000 MT for 2023/2024 were for Japan. No exports were reported for the week.
Sorghum: Total net sales of 155,300 MT for 2022/2023 were up noticeably from the previous week and up 93 percent from the prior 4-week average. Increases were for China, including decreases of 3,700 MT. Exports of 49,300 MT were down 53 percent from the previous week, but up 11 percent from the prior 4-week average. The destination was to China.
Rice: Net sales of 141,900 MT for 2022/2023–a marketing-year high–were up noticeably from the previous week and from the prior 4-week average. Increases were primarily for Colombia (65,000 MT), Haiti (41,300 MT, including decreases of 200 MT), Mexico (24,800 MT), Iraq (4,000 MT), and El Salvador (2,500 MT). Total net sales of 5,000 MT for 2023/2024 were for Mexico. Exports of 173,200 MT–a marketing-year high–were up noticeably from the previous week and from the prior 4-week average. The destinations were primarily to Colombia (59,000 MT), Iraq (44,000 MT), Mexico (26,300 MT), Haiti (22,200 MT), and Guatemala (12,100 MT).
Soybeans: Net sales reductions of 23,200 MT for 2022/2023–a marketing-year low–were down noticeably from the previous week and from the prior 4-week average. Increases primarily for China (178,500 MT, including 172,000 MT switched from unknown destinations and decreases of 3,200 MT), Japan (69,900 MT, including 50,000 MT switched from unknown destinations, decreases of 10,500 MT, and 10,700 MT – late), Mexico (57,200 MT, including decreases of 1,700 MT), Indonesia (49,900 MT, including 30,000 MT switched from unknown destinations and decreases of 200 MT), and Vietnam (25,500 MT, including decreases of 400 MT), were more than offset by reductions for unknown destinations (307,600 MT) and Pakistan (132,000 MT). Net sales of 172,300 MT for 2023/2024 were reported for Pakistan (66,000 MT), China (63,000 MT), Japan (34,500 MT), and unknown destinations (8,800 MT). Exports of 581,000 MT were down 34 percent from the previous week and 62 percent from the prior 4-week average. The destinations were primarily to China (262,200 MT, including 68,400 – late), Mexico (107,700 MT, including 38,400 – late), Japan (99,300 MT, including 10,700 MT – late), Indonesia (49,900 MT), and Vietnam (13,900 MT).
Optional Origin Sales: For 2022/2023, the current outstanding balance of 300 MT, all South Korea.
Export for Own Account: For 2022/2023, the current exports for own account outstanding balance of 1,600 MT are for Canada (1,500 MT) and Taiwan (100 MT).
Export Adjustments: Accumulated exports of soybeans to China were adjusted down 68,396 MT for week ending December 8th. This shipment was reported in error.
Late Reporting: For 2022/2023, net sales totaling 11,100 MT of soybeans were reported late for Japan (10,700 MT) and South Korea (400 MT). Late exports of 124,700 MT were primarily to China (68,400 MT), Mexico (38,400 MT), Japan (10,700 MT), and Colombia (6,900 MT).
Soybean Cake and Meal: Net sales of 319,800 MT for 2022/2023 were up 86 percent from the previous week and 85 percent from the prior 4-week average. Increases primarily for the Philippines (84,300 MT), Morocco (43,700 MT), Colombia (39,600 MT, including decreases of 36,900 MT), Guatemala (32,300 MT, including decreases of 1,400 MT), and Mexico (28,300 MT, including decreases of 5,800 MT), were offset by reductions primarily for unknown destinations (4,000 MT). Net sales of 110,000 MT for 2023/2024 were reported for Ecuador (96,000 MT) and Indonesia (14,000 MT). Exports of 266,900 MT were up 38 percent from the previous week and 11 percent from the prior 4-week average. The destinations were primarily to the Philippines (47,300 MT), Colombia (43,100 MT), Ecuador (32,100 MT), Morocco (23,700 MT), and Venezuela (19,100 MT).
Soybean Oil: Net sales of 7,300 MT for 2022/2023 were up noticeably from the previous week and from the prior 4-week average. Increases reported for Mexico (7,500 MT), were offset by reductions for Canada (200 MT). Exports of 500 MT were up 25 percent from the previous week, but down 75 percent from the prior 4-week average. The destinations were to Canada (400 MT) and Mexico (100 MT).
Cotton: Net sales of 114,500 RB for 2022/2023 were down 33 percent from the previous week and 57 percent from the prior 4-week average. Increases primarily for Vietnam (44,700 RB, including 400 RB switched from South Korea, 100 RB switched from China, and decreases of 2,300 RB), Turkey (17,400 RB, including decreases of 8,300 RB), China (15,300 RB, including 2,600 RB switched from Singapore and decreases of 18,300 RB), Pakistan (11,900 RB, including decreases of 1,100 RB), and Mexico (9,800 RB, including decreases of 100 RB), were offset by reductions primarily for Singapore (2,600 RB), Bangladesh (800 RB), and Nicaragua (700 RB). Net sales reductions of 68,300 RB for 2023/2024 resulting in increases primarily for Mexico (8,100 RB) and Japan (5,300 RB), were more than offset by reductions for Pakistan (87,100 RB). Exports of 287,500 RB were up 38 percent from the previous week and 44 percent from the prior 4-week average. The destinations were primarily to Pakistan (75,100 RB), China (54,400 RB), Vietnam (47,500 RB), Turkey (36,100 RB), and Bangladesh (14,200 RB). Net sales of Pima totaling 3,800 RB for 2022/2023 were up noticeably from the previous week and from the prior 4-week average. Increases were primarily for China (1,500 RB), India (900 RB), Thailand (600 RB), Vietnam (400 RB), and Pakistan (300 RB). Exports of 2,900 RB were down 1 percent from the previous week and 41 percent from the prior 4-week average. The destinations were to China (1,700 RB), Peru (900 RB), Bahrain (100 RB), Thailand (100 RB), and Japan (100 RB).
Optional Origin Sales: For 2022/2023, options were exercised to export 1,900 RB to Malaysia from the United States. The current outstanding balance of 7,300 RB, all Malaysia.
Export for Own Account: For 2022/2023, new exports for own account totaling 900 RB were to China. Exports for own account totaling 7,100 RB to Vietnam (4,900 RB) and Turkey (2,200 RB) were applied to new or outstanding sales. The current exports for own account outstanding balance of 113,900 RB are for China (67,300 RB), Vietnam (34,200 RB), Pakistan (5,000 RB), Turkey (3,500 RB), South Korea (2,400 RB), and India (1,500 RB).
Hides and Skins: Net sales of 299,500 pieces for 2023 were down 23 percent from the previous week and 34 percent from the prior 4-week average. Increases primarily for China (178,300 whole cattle hides, including decreases of 18,000 pieces), Mexico (28,700 whole cattle hides, including decreases of 5,600 pieces), Brazil (25,300 whole cattle hides), South Korea (23,400 whole cattle hides, including decreases of 200 pieces), and Indonesia (21,400 whole cattle hides), were offset by reductions for Taiwan (400 pieces) and Italy (100 pieces). In addition, net sales of 2,600 kip skins resulting in increases for Belgium (2,900 kip skins), were offset by reductions for Japan (200 pieces). Exports of 366,500 pieces were down 29 percent from the previous week and 24 percent from the prior 4-week average. Whole cattle hides exports were primarily to China (267,100 pieces), Mexico (37,200 pieces), South Korea (24,600 pieces), Thailand (14,700 pieces), and Brazil (7,000 pieces).
Net sales of 136,500 wet blues for 2023 were down 10 percent from the previous week, but up 23 percent from the prior 4-week average. Increases primarily for Vietnam (57,600 unsplit and 12,000 grain splits), Thailand (23,200 unsplit, including decreases of 200 pieces), Italy (16,700 unsplit, including decreases of 100 pieces), Hong Kong (13,800 unsplit, including decreases of 200 pieces), and China (8,600 unsplit), were offset by reductions for Japan (600 grain splits) and Brazil (100 grain splits). Total net sales of 13,200 unsplit for 2024 were for Vietnam. Exports of 122,200 wet blues were down 25 percent from the previous week and 19 percent from the prior 4-week average. The destinations were primarily to Italy (32,000 unsplit), China (26,600 unsplit), Vietnam (26,500 unsplit), Thailand (16,500 unsplit), and Hong Kong (9,800 unsplit). Net sales reductions of 2,100 splits were reported for Hong Kong (1,900 pounds) and Vietnam (200 pounds). Exports of 108,500 pounds were to Hong Kong (71,300 pounds) and Vietnam (37,200 pounds).
Beef: Net sales of 5,600 MT for 2023–a marketing-year low–were down 31 percent from the previous week and 67 percent from the prior 4-week average. Increases primarily for Japan (3,200 MT, including decreases of 700 MT), Mexico (1,400 MT, including decreases of 300 MT), China (500 MT, including decreases of 100 MT), Canada (300 MT, including decreases of 100 MT), and Hong Kong (200 MT, including decreases of 200 MT), were offset by reductions for South Korea (1,100 MT). Exports of 13,000 MT were down 19 percent from the previous week and 20 percent from the prior 4-week average. The destinations were primarily to South Korea (3,300 MT), Japan (3,000 MT), China (2,200 MT), Mexico (1,200 MT), and Taiwan (1,000 MT).
Pork: Net sales of 22,100 MT for 2023 were down 29 percent from the previous week and 44 percent from the prior 4-week average. Increases primarily for Mexico (10,700 MT, including decreases of 500 MT), South Korea (3,800 MT, including decreases of 500 MT), Colombia (1,200 MT, including decreases of 100 MT), Chile (1,100 MT), and China (800 MT, including decreases of 300 MT), were offset by reductions for Canada (300 MT). Exports of 30,300 MT were unchanged from the previous week, but up 1 percent from the prior 4-week average. The destinations were primarily to Mexico (13,700 MT), Japan (4,200 MT), China (3,900 MT), South Korea (2,500 MT), and Canada (1,600 MT).
U.S. EXPORT SALES FOR WEEK ENDING 3/2/2023
|
|
CURRENT MARKETING YEAR |
NEXT MARKETING YEAR |
||||||
|
COMMODITY |
NET SALES |
OUTSTANDING SALES |
WEEKLY EXPORTS |
ACCUMULATED EXPORTS |
NET SALES |
OUTSTANDING SALES |
||
|
CURRENT YEAR |
YEAR AGO |
CURRENT YEAR |
YEAR AGO |
|||||
|
|
THOUSAND METRIC TONS |
|||||||
|
WHEAT |
|
|
|
|
|
|
|
|
|
HRW |
65.8 |
682.5 |
1,775.3 |
68.6 |
4,057.6 |
5,655.3 |
0.0 |
112.3 |
|
SRW |
25.7 |
581.2 |
584.6 |
31.8 |
2,117.0 |
2,102.0 |
30.5 |
218.6 |
|
HRS |
64.2 |
953.6 |
1,128.1 |
58.6 |
4,313.0 |
3,895.0 |
39.5 |
89.3 |
|
WHITE |
109.0 |
852.0 |
551.3 |
191.0 |
3,529.3 |
2,709.1 |
0.0 |
43.2 |
|
DURUM |
2.1 |
43.6 |
18.8 |
27.1 |
271.6 |
169.7 |
0.0 |
36.9 |
|
TOTAL |
266.7 |
3,113.0 |
4,058.0 |
377.1 |
14,288.5 |
14,531.2 |
70.0 |
500.3 |
|
BARLEY |
0.0 |
3.9 |
13.8 |
0.0 |
8.0 |
14.7 |
6.0 |
6.0 |
|
CORN |
1,412.1 |
14,568.2 |
22,669.2 |
1,052.0 |
16,081.8 |
27,533.0 |
113.2 |
1,675.8 |
|
SORGHUM |
155.3 |
687.1 |
3,687.4 |
49.3 |
521.0 |
2,987.2 |
0.0 |
0.0 |
|
SOYBEANS |
-23.2 |
6,604.4 |
10,759.6 |
581.0 |
42,117.8 |
41,611.2 |
172.3 |
1,480.1 |
|
SOY MEAL |
319.8 |
2,931.7 |
3,203.5 |
266.9 |
5,113.6 |
5,441.0 |
110.0 |
229.0 |
|
SOY OIL |
7.3 |
27.3 |
172.6 |
0.5 |
32.0 |
409.2 |
0.0 |
0.6 |
|
RICE |
|
|
|
|
|
|
|
|
|
L G RGH |
93.1 |
152.2 |
249.6 |
103.3 |
414.1 |
868.1 |
0.0 |
0.0 |
|
M S RGH |
0.0 |
32.1 |
8.5 |
0.1 |
18.4 |
5.2 |
5.0 |
5.0 |
|
L G BRN |
0.1 |
4.4 |
17.6 |
0.4 |
14.3 |
31.9 |
0.0 |
0.0 |
|
M&S BR |
0.1 |
35.8 |
44.0 |
0.1 |
8.7 |
42.0 |
0.0 |
0.0 |
|
L G MLD |
46.3 |
106.5 |
88.6 |
67.7 |
436.5 |
524.7 |
0.0 |
0.0 |
|
M S MLD |
2.2 |
129.6 |
192.2 |
1.7 |
175.2 |
250.9 |
0.0 |
0.0 |
|
TOTAL |
141.9 |
460.5 |
600.5 |
173.2 |
1,067.2 |
1,722.7 |
5.0 |
5.0 |
|
COTTON |
|
THOUSAND RUNNING BALES |
||||||
|
UPLAND |
114.5 |
4,969.0 |
7,760.1 |
287.5 |
5,674.4 |
5,524.3 |
-68.3 |
1,326.0 |
|
PIMA |
3.8 |
40.2 |
159.0 |
2.9 |
99.8 |
256.9 |
0.0 |
3.5 |
| Terry Reilly Senior Commodity Analyst – Grain and Oilseeds |
| Futures International One Lincoln Center 18W140 Butterfield Rd. Suite 1450 Oakbrook terrace, Il. 60181 |
| Work: 312.604.1366 ICE IM: treilly1 Skype IM: fi.treilly |
| treilly@futures-int.com
|
| DISCLAIMER: The contents of this communication and any attachments are for informational purposes only and under no circumstances should they be construed as an offer to buy or sell, or a solicitation to buy or sell any future, option, swap or other derivative. The sources for the information and any opinions in this communication are believed to be reliable, but Futures International, LLC does not warrant or guarantee the accuracy of such information or opinions. This communication may contain links to third party websites which are not under the control of FI and FI is not responsible for their content. Trading of futures, options, swaps and other derivatives is risky and is not suitable for all persons. All of these investment products are leveraged, and you can lose more than your initial deposit. Each investment product is offered only to and from jurisdictions where solicitation and sale are lawful, and in accordance with applicable laws and regulations in such jurisdiction. The information provided here should not be relied upon as a substitute for independent research before making your investment decisions. Futures International, LLC is merely providing this information for your general information and the information does not take into account any particular individual’s investment objectives, financial situation, or needs. All investors should obtain advice based on their unique situation before making any investment decision. Futures International, LLC and its principals and employees may take positions different from any positions described in this communication. Past results are not necessarily indicative of future results. |