PDF Attached
UNITED
STATES
IT
IS ALL ABOUT THE TROPICS
- Weather
in North America over the next few weeks will be largely determined by the tropics and the interaction of frequent tropical cyclones and the North America high pressure ridge
- An
active tropical pattern will be firing up in another week to no more than ten days - Once
the more active pattern begins it will last for two weeks - The
subtropical jet stream will bring frequent storms toward the southeastern United States and there will often be a trough of low pressure over the southeastern U.S. that will limit moisture from flowing into the Midwest helping to reduce rainfall - Monsoonal
precipitation has been and will continue restricted in the southwestern U.S. and that, too, limits the moisture influx for the Midwest later this month and especially in September
- The
combination of a late season ridge of high pressure over the Plains and Rocky Mountain region, the active tropical weather pattern with a trough of low pressure in the southeastern U.S. and limited monsoonal moisture will lead to less rain less frequently
in the Midwest and an opportunity for net drying in the Midwest - A
close watch on the tropics is warranted because any storm that comes to the Gulf of Mexico might have some potential to disrupt the drying bias for parts of the Midwest and Delta, although Gulf storms may favor Texas landfalls rather than Delta landfalls.
- Not
all of the Midwest, Delta and Great Plains will be dry and World Weather, Inc. is certainly not advocating a complete absence of rain, but we remind you of the late summer weather outlook promoting less rain and a net drying bias only to be disrupted by some
brief periods of light rainfall - Bouts
of cool air will alternate with seasonable to slightly warmer than usual conditions - The
above comments of generality should rule over the next few weeks
EUROPE/BLACK
SEA
Not
major changes occurred overnight
- Rain
will fall periodically this week in most of western and central Europe and sufficient amounts of rain will occur to bring relief to parts of the driest areas of France, the U.K., Belgium and a few areas of Germany - Central
France seems less favored for “significant” rain today than in previous days this week - Northeastern
Europe will dry down for a while, but that will be a welcome change after frequent rainfall this summer and the same is expected in western portions of the CIS - Eastern
and southern Ukraine into Russia’s Southern Region will continue to experience restricted rainfall and seasonable temperatures promoting ongoing crop moisture stress for unirrigated grains and oilseeds
RUSSIA
NEW LANDS
Rain
is still expected in most of the Russian New Lands during the coming week to ten days. Sufficient amounts will occur to bolster soil moisture in those areas that have been drier biased in recent weeks
- A
little too much rain may return to a part of the Ural Mountains region where the ground is already plenty moist - This
region could fall vulnerable to some crop quality declines if the wet weather prevails too long - Temperatures
will be seasonable in the eastern New Lands and a little cooler than usual in the west
CHINA
Waves
of rain will continue to impact much of the nation east of Tibet over the next ten days leaving many areas plenty wet and some a little too wet
- All
areas get rain at one time or another and northern areas may be wettest relative to normal; however
some heavy rain is expected in central Sichuan where some flooding is likely into this weekend - Some
rain in northern China may also continue heavy at times into next week resulting in periodic localized flooding - Net
drying is expected in the middle and lower Yangtze River Basin and in some areas in the interior southeastern parts of the nation, although completely dry weather is not likely
AUSTRALIA
Waves
of light rain will continue to move across the nation over the next ten days to two weeks maintaining a favorable outlook for winter crops as they approach spring
Greater
volumes of rain are still needed in South Australia and parts of Queensland where the lowest soil moisture remains
Source:
World Weather Inc.
7
Day Precipitation Outlook
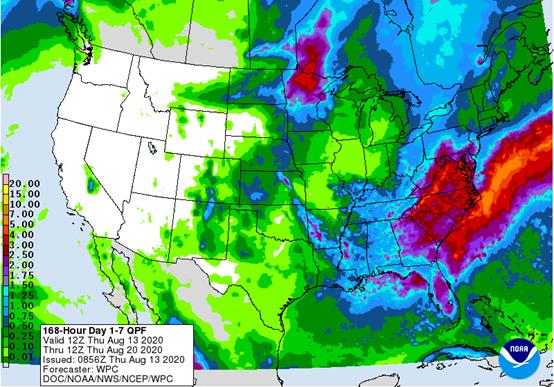
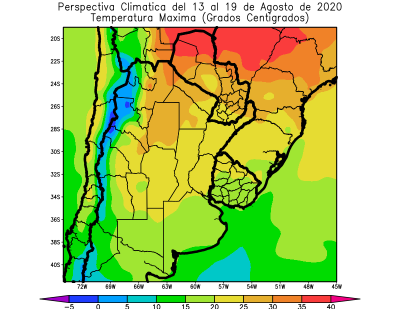
Argentina’s
wheat growing belt will continue to see less than ideal precipitation
- ICE
Futures Europe weekly commitments of traders report, 1:30pm (6:30pm London) - CFTC
commitments of traders weekly report on positions for various U.S. futures and options, 3:30pm - FranceAgriMer
weekly update on crop conditions - EARNINGS:
Golden Agri-Resources
SATURDAY,
August 15:
- Malaysia
palm oil export data for Aug 1-15 from AmSpec
Source:
Bloomberg and FI
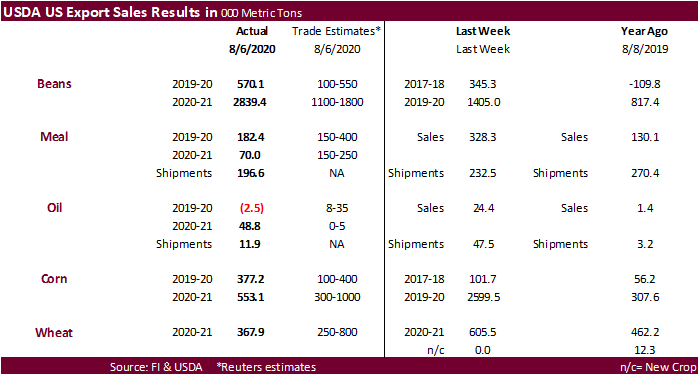
USDA
export sales
exceeded expectations for old crop soybeans and new-crop topped 2.8 million tons, well above expectations. Soybean meal export sales were within expectations. Soybean oil was negative 2,500 tons for old crop but new-crop was very good at 48,300
tons. Corn export sales were within expectations. All-wheat of nearly 368,000 tons were ok. Sorghum export sales were excellent at 282,400 tons an included a large portion for China.
New-crop-sorghum were a whopping 527,500 tons including 348,000 tons for China. Pork sales were 10,500 tons.
US
Initial Jobless Claims Aug 8: 963K (est 1100K; prevR 1191K; prev 1186K)
US
Continuing Clams Aug 1: 15486K (est 15800K; prevR 16090K; prev 16107K)
-
September
corn futures ended 10.75 cents higher
at $3.2525, an impressive move that resulted, in just one day, took out the top end of our revised September trading range of $3.25. December settled 11.50 cents higher at $3.3875, highest level since July 20. The benchmark December position is probably
going to close its July 10-13th gap of $3.4200 and $3.4375, maybe as early as tomorrow.
-
Corn
futures exploded to the upside, trading 3 percent about higher during the session, on improving demand, short covering (managed money was about net short 156k headed into Thursday) and talk of large production losses for IA and Il and surrounding areas impacted
by Monday’s derecho weather event. Yesterday we noted the corn loss in IA alone could amount north of 240 million bushels. Some 1.0+ million corn acres could have been lost.
-
USDA
this morning announced 110,000 tons of corn was sold to unknown. Traders think it could have been Mexico or China as the destination. Meanwhile, old and new-crop US sorghum weekly export sales of a large 527,500 tons were the largest weekly volume (for new-crop)
since August 30, 2017. But not all trade news earlier today was rosy. South Korea, Taiwan and Iran passed on corn.
Perhaps
those countries want to see lower global cash prices. -
Weekly
old-crop sorghum export sales were excellent at 282,400 tons an included a large portion for China. New-crop-sorghum were a whopping 527,500 tons and included 348,000 tons for China. . USDA export sales for corn were within expectations at 377,200 tons
old crop and 553,100 tons new-crop. Pork sales were 10,500 tons -
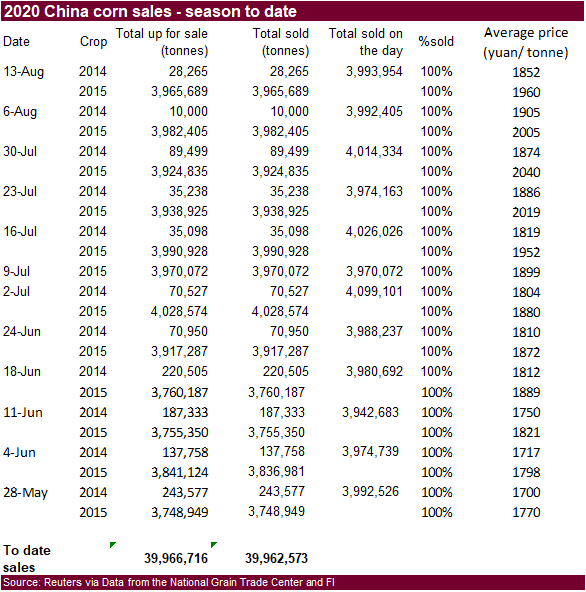
China
sold all of its 3.994MMT corn offered at auction at an average price of 1,959 yuan per ton.
-
Today
was the last day of the “Goldman Roll.” -
China
announced they found traces of coronavirus in imported frozen food packaging from Brazil.
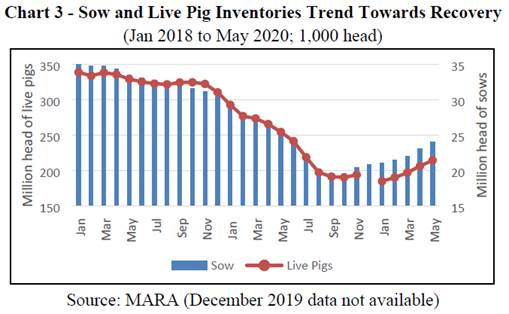
USDA
Attaché on China pork production
Corn
Export Developments
·
Under the 24-hour USDA export sales reporting system, private exporters reported the following activity: Export sales of 110,000 metric tons of corn for delivery to unknown destinations. Of the
total, 30,000 metric tons is for delivery during the 2019/2020 marketing year and 80,000 metric tons is for delivery during the 2020/2021 marketing year.
·
Israel passed on about 200,000 tons of corn but bought an unknown amount of soybean meal. They were in for 350,000 tons of soybean meal.
·
Taiwan’s MFIG passed on up to 65,000 tons of optional origin corn for October 28-Nov 16 shipment. Lowest offer was believed to be for Argentine corn at an estimated premium of 186.50 U.S. cents
a bushel c&f over the Chicago March 2021 corn contract.
·
South Korea’s NOFI group passed on 69,000 tons of corn.
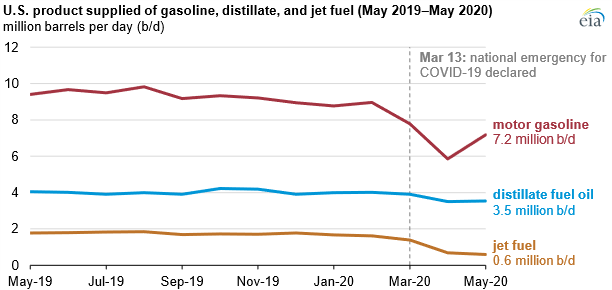
https://www.eia.gov/todayinenergy/detail.php?id=44736&src=email
-
September
corn is seen in a $3.10 and $3.35 range. December $3.00-$3.50 range.
-
Soybeans
surged to the upside, to a 2-week high, on improving US export demand and follow through short covering. In addition, part of a port in China shut down after a Brazilian boat crew member tested positive for Coronavirus. September soybeans ended 15.75 cents
higher and November up 16.50 cents. September meal was up sharply by $7.90/short ton to $292.10 and soybean September soybean oil was down 33 points to 29.21 points.
-
Per
USDA’s 24-hour announcement system, China has bought US soybeans for the seventh consecutive day. In addition, USDA export sales for soybeans were excellent. The soybean products saw a reversal from Wednesday’s price action. Strength in soybean meal supported
soybeans and pressured CBOT soybean oil, despite another rally in Asian vegetable oils. China soybean oil rallied 3.2 percent on rumors China was going to replenish 2 million tons of domestic soybean reserves. Note on Wednesday soybean oil share jumped to
35.7 from 35.0 previous day. -
USDA
export sales exceeded expectations for old crop soybeans and new-crop topped 2.8 million tons, well above expectations. Soybean meal export sales were within expectations. Soybean oil was negative 2,500 tons for old crop but new-crop was very good at 48,300
tons. -
We
heard China bought up to 3-4 US Q4 soybean cargoes out of the Gulf and PNW on Tuesday.
-
There
was talk of a soybean oil Argentina wash sale. Some 60,000 tons were cancelled destined for Asia from what we heard.
-
Results
awaited: China’s Sinograin will sell 24,611 tons of domestic soybean reserves on Thursday.
-
Reuters:
China is still far behind the pace needed to meet its commitment of buying $36.5 billion worth of U.S. agricultural goods under a Phase 1 deal. The United States exported just $7.274 billion in agricultural goods to China in the first half of the year, according
to the U.S. Census Bureau. -
Brazil
lowered their biodiesel mandate for Sep-Oct to 10 percent from 12 percent after the country plowed through their 2020 soybean supplies leaving a shortage of soybeans for crushing.
·
Israel passed on about 200,000 tons of corn but bought an unknown amount of soybean meal. They were in for 350,000 tons of soybean meal.
·
Under the 24-hour USDA export sales reporting system, private exporters reported the following activity:
o
Export sales of 197,000 metric tons of soybeans for delivery to China during the 2020/2021 marketing year
o
Export sales of 202,000 metric tons of soybeans for delivery to unknown destinations during the 2020/2021 marketing year
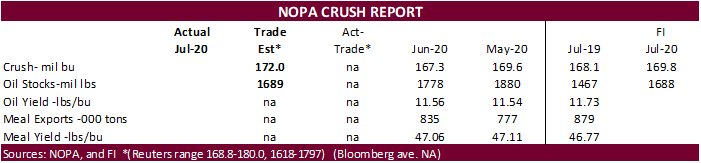
NOPA.
We
are hearing downtime during July was larger than June and much larger than July 2019.
-
September
soybeans are seen in a $8.70-$9.15 range. November $8.60-$9.25. -
September
soybean meal is seen in a $285 to $310 range. December $285-$320. -
September
soybean oil range is seen in a 30.00 to 32.50 range. December 29.75-33.00 range.
-
US
wheat futures
traded higher led by KC type wheat from bottom picking and higher corn. Chicago Sep was up 5.50 cents, KC Sep up 7.25 cents, and MN Sep up 4.75 cents. Egypt bought 415,000 tons of Russian wheat.
-
All-wheat
export sales of nearly 368,000 tons were ok. -
German
agricultural cooperatives group DRV lowered German wheat production to 21.5MMT tons, down from July’s estimate of 22.5MMT, in large part to a lower estimate of the planted acreage from Germany’s statistics office, with winter-wheat acreage now seen down about
10% from last year. -
Dry
weather is starting to impact the Argentina wheat planted area. The Rosario Grains Exchange now estimates production at 18 million tons from 19 million previously.
-
Australia
will see rain through Saturday for New South Wales and Victoria, and parts of southern Queensland, eastern South Australia, and southwestern Western Australia.
-
Paris
December wheat was up 0.75 euro at 178.50.
Export
Developments.
-
Egypt
seeks wheat and lowest offer was $204.90/ton for Russian wheat. Traders
gave the following breakdown of the purchase in dollars per ton:
|
Supplier |
Quantity |
Origin |
FOB |
Freight |
C&F |
|
GTCS |
55,000 |
Russian |
$206.30 |
$15.68 |
$221.98 |
|
Solaris |
60,000 |
Russian |
$206.48 |
$15.95 |
$222.43 |
|
Solaris |
60,000 |
Russian |
$206.48 |
$15.95 |
$222.43 |
|
Solaris |
60,000 |
Russian |
$206.48 |
$15.95 |
$222.43 |
|
Posco |
60,000 |
Russian |
$206.95 |
$15.95 |
$222.90 |
|
Gemcorp |
60,000 |
Russian |
$207.00 |
$15.95 |
$222.95 |
|
Grain |
60,000 |
Russian |
$207.38 |
$15.95 |
$223.33 |
-
Pakistan
seeks 1.5 million tons of wheat on August 18. -
Syria
looks to sell and export 100,000 tons of feed barley with offers by Sep 1.
-
Syria
seeks 200,000 tons of soft wheat from EU/Russia on Sept. 9 and 200,000 tons of wheat from Russia on Sept. 14.
·
Mauritius seeks 6,000 tons of white rice on August 17 for October through December delivery.
·
South Korea’s Agro-Fisheries & Food Trade Corp. seeks 60,556 tons of rice from Vietnam and other origins, on Aug. 19, for arrival in South Korea between Dec. 31, 2020, and February 28, 2021.
Updated
8/12/20
- Chicago
September is seen in a $4.70-$5.15 range. December $4.80-$5.30. - KC
September; $4.00-$4.40 range. December $4.10-$4.45. - MN
September $4.75-$5.05 range. December $4.95-$5.25.
U.S.
EXPORT SALES FOR WEEK ENDING 8/6/2020
|
|
CURRENT MARKETING YEAR |
NEXT MARKETING YEAR |
||||||
|
COMMODITY |
NET SALES |
OUTSTANDING SALES |
WEEKLY EXPORTS |
ACCUMULATED EXPORTS |
NET SALES |
OUTSTANDING SALES |
||
|
CURRENT YEAR |
YEAR |
CURRENT YEAR |
YEAR |
|||||
|
WHEAT |
THOUSAND |
|||||||
|
HRW |
24.1 |
1,558.3 |
1,406.6 |
192.9 |
2,263.0 |
2,385.9 |
0.0 |
0.0 |
|
SRW |
14.0 |
678.3 |
696.4 |
39.7 |
351.0 |
535.5 |
0.0 |
0.0 |
|
HRS |
170.7 |
1,853.0 |
1,578.6 |
169.7 |
1,325.0 |
1,040.0 |
0.0 |
5.0 |
|
WHITE |
147.6 |
1,318.2 |
1,011.2 |
44.2 |
848.0 |
747.8 |
0.0 |
0.0 |
|
DURUM |
11.5 |
187.0 |
334.4 |
21.5 |
209.3 |
90.6 |
0.0 |
0.0 |
|
TOTAL |
367.9 |
5,594.9 |
5,027.3 |
468.0 |
4,996.3 |
4,799.8 |
0.0 |
5.0 |
|
BARLEY |
0.0 |
31.4 |
47.2 |
5.1 |
7.8 |
9.5 |
0.0 |
0.0 |
|
CORN |
377.2 |
4,137.9 |
2,592.8 |
1,333.1 |
40,021.9 |
47,391.2 |
553.1 |
11,480.3 |
|
SORGHUM |
282.4 |
342.2 |
138.4 |
479.2 |
4,291.5 |
1,589.2 |
527.5 |
1,723.1 |
|
SOYBEANS |
570.1 |
6,445.9 |
5,647.9 |
1,103.9 |
41,064.8 |
42,944.3 |
2,839.4 |
17,975.5 |
|
SOY MEAL |
182.4 |
1,652.0 |
1,831.8 |
196.5 |
10,305.5 |
9,974.8 |
70.0 |
1,055.4 |
|
SOY OIL |
-2.5 |
177.7 |
155.6 |
11.9 |
1,089.2 |
721.4 |
48.7 |
80.7 |
|
RICE |
|
|
|
|
|
|
|
|
|
L G RGH |
0.3 |
164.8 |
259.5 |
4.4 |
4.4 |
50.5 |
0.0 |
0.0 |
|
M S RGH |
0.0 |
28.2 |
27.7 |
0.7 |
0.7 |
1.1 |
0.0 |
0.0 |
|
L G BRN |
0.0 |
8.9 |
1.6 |
0.7 |
0.7 |
0.6 |
0.0 |
0.0 |
|
M&S BR |
0.1 |
30.9 |
0.1 |
0.9 |
0.9 |
0.1 |
0.0 |
0.0 |
|
L G MLD |
4.6 |
38.7 |
230.4 |
3.4 |
3.4 |
34.3 |
0.0 |
0.0 |
|
M S MLD |
1.3 |
65.9 |
99.5 |
4.5 |
4.5 |
27.8 |
0.0 |
0.0 |
|
TOTAL |
6.3 |
337.2 |
618.8 |
14.7 |
14.7 |
114.4 |
0.0 |
0.0 |
|
COTTON |
|
THOUSAND |
|
|||||
|
UPLAND |
6.9 |
6,288.5 |
7,427.8 |
278.6 |
278.6 |
346.9 |
8.8 |
316.2 |
|
PIMA |
10.4 |
172.9 |
139.1 |
5.6 |
5.6 |
14.7 |
0.0 |
0.0 |
|
FINAL 2019/20 MARKETING YEAR |
||||
|
COMMODITY |
NET SALES |
CARRYOVER
SALES 1/ |
07/31/2020
EXPORTS |
ACCUMULATED
EXPORTS |
|
PIMA |
-0.4 |
116.4 |
3.7 |
486.6 |
|
COTTON |
|
|
|
|
|
UPLAND |
1.4 |
2,883.2 |
43.6 |
14,174.5 |
|
RICE |
|
|
|
|
|
L G RGH |
0.0 |
93.3 |
0.0 |
1,329.4 |
|
M S RGH |
0.0 |
23.2 |
0.0 |
73.2 |
|
L G BRN |
0.1 |
9.6 |
0.1 |
59.5 |
|
M&S BR |
0.0 |
31.7 |
0.0 |
87.7 |
|
L G MLD |
2.1 |
36.1 |
2.3 |
900.2 |
|
M S MLD |
3.5 |
65.3 |
3.5 |
686.5 |
|
TOTAL |
5.7 |
259.1 |
5.9 |
3,136.5 |
This
summary is based on reports from exporters for the period July 31-August 6, 2020.
Wheat: Net
sales of 367,900 metric tons (MT) for 2020/2021 were down 39 percent from the previous week and 45 percent from the prior 4-week average. Increases primarily for South Korea (117,900 MT), Japan (68,600 MT), the Philippines (66,800 MT), Brazil (63,300 MT,
including 60,000 MT switched from unknown destinations), and Italy (33,600 MT), were offset by reductions primarily for unknown destinations (52,400 MT). Exports of 468,000 MT were down 22 percent from the previous week and 18 percent from the prior 4-week
average. The destinations were primarily to the Philippines (90,800 MT), Japan (86,000 MT), China (63,000 MT), Nigeria (49,900 MT), and Mexico (42,500 MT).
Corn:
Net sales of 377,200 MT for 2019/2020 were up noticeably from the previous week and up 18 percent from the prior 4-week average. Increases primarily for South Korea (125,000 MT, including 55,000 MT switched from unknown destinations and decreases of 200 MT),
Japan (79,300 MT, including decreases of 4,600 MT), China (76,500 MT), Colombia (60,700 MT, including 42,000 MT switched from unknown destinations, decreases of 2,700 MT, and 13,800 MT late – see below), and Venezuela (59,100 MT, including 29,100 MT late –
see below), were offset by reductions primarily for unknown destinations (97,000 MT) and Nicaragua (9,000 MT). For 2020/2021, net sales of 553,100 MT primarily for Colombia (176,500 MT), Mexico (165,200 MT), unknown destinations (129,700 MT), Peru (50,000
MT), and Taiwan (10,600 MT), were offset by reductions for Guatemala (1,500 MT). Exports of 1,333,100 MT were up 95 percent from the previous week and 43 percent from the prior 4-week average. The destinations were primarily to China (396,600 MT), Mexico
(225,800 MT), Colombia (167,300 MT, including 13,800 MT late – see below), Japan (163,900 MT, including 28,200 MT late – see below), and South Korea (125,100 MT).
Optional
Origin Sales:
For 2019/2020, options were exercised to export 65,000 MT to South Korea from the United States. The current outstanding balance of 390,000 MT is for South Korea (260,000 MT), Vietnam (65,000 MT), and Taiwan (65,000 MT). For 2020/2021, the current outstanding
balance of 260,000 MT is for Vietnam (195,000 MT) and South Korea (65,000 MT).
Late
Reporting:
For 2019/2020, net sales totaling 42,900 MT were reported late. These sales were reported for Venezuela (29,100 MT) and Colombia (13,800 MT). For 2019/2020, exports totaling 71,100 MT were reported late. The destinations were to Venezuela (29,100 MT), Japan
(28,200 MT), and Colombia (13,800 MT).
Barley:
No net sales for 2020/2021 were reported for the week. Exports of 5,100 MT–a marketing-year high–were up noticeably from the previous week and from the prior 4-week average. The destination was Japan.
Sorghum:
Net sales of 282,400 MT for 2019/2020 were up noticeably from the previous week and from the prior 4-week average. Increases primarily for China (348,300 MT, including 66,000 MT switched from unknown destinations, decreases of 65,000 MT, and 336,300 MT late
– see below), were offset by reductions for unknown destinations (66,000 MT). For 2020/2021, net sales of 527,500 MT were reported for China (348,000 MT) and unknown destinations (179,500 MT). Exports of 479,200 MT–a marketing-year high–were up noticeably
from the previous week and from the prior 4-week average. The destination was China (including 407,800 MT late – see below).
Late
Reporting:
For 2019/2020, net sales totaling 336,300 MT were reported late. These sales were reported for China. For 2019/2020, exports to China (407,800 MT) were reported late.
Rice:
Net
sales of 6,300 MT were reported for 2020/2021, which began August 1. Increases primarily for Mexico (2,300 MT), Saudi Arabia (1,600 MT), Canada (1,600 MT, including decreases of 200 MT), Israel (600 MT), and Singapore (200 MT), were offset by reductions primarily
for the Dominican Republic (200 MT) and the Netherlands (100 MT). A total of 259,100 MT in sales were outstanding on July 31, and carried over to 2020/2021. Accumulated exports in 2019/2020 totaled 3,136,500 MT were up 2 percent from the prior year’s total
of 3,078,300 MT. Exports for 2019/2020 totaled 5,900 MT and were primarily to Saudi Arabia (2,600 MT), Israel (1,400 MT), Qatar (700 MT), Canada (600 MT), and Mexico (300 MT).
Soybeans:
Net sales of 570,100 MT for 2019/2020 were up 65 percent from the previous week and 96 percent from the prior 4-week average. Increases primarily for China (420,500 MT, including decreases of 2,000 MT, and 354,800 MT late – see below), the Netherlands (144,300
MT, including 137,000 MT switched from unknown destinations and decreases of 1,600 MT), Japan (64,500 MT, including decreases of 1,400 MT), Egypt (49,600 MT, including 52,000 MT switched from unknown destinations and decreases of 2,400 MT), and Taiwan (20,300
MT), were offset by reductions primarily for unknown destinations (191,000 MT). For 2020/2021, net sales of 2,839,400 MT were primarily for China (1,705,000 MT), unknown destinations (872,500 MT), Mexico (74,800 MT), Portugal (49,000 MT), and Taiwan (43,000
MT). Exports of 1,103,900 MT were up 36 percent from the previous week and 83 percent from the prior 4-week average. The destinations were primarily to China (630,400 MT, including 354,800 late – see below), the Netherlands (144,300 MT), Mexico (123,200
MT), Egypt (49,600 MT), and Japan (38,700 MT, including 10,100 MT late – see below).
Exports
for Own Account:
For 2019/2020, new exports for own account were for Canada (59,500 MT). The current exports for own account outstanding balance is 61,600 MT, all Canada.
Late
Reporting:
For 2019/2020, net sales totaling 355,800 MT were reported late. These sales were reported for China (354,800 MT) and the Philippines (1,000 MT). For 2019/2020, exports totaling 365,300 MT were reported late. The destinations were to China (354,800 MT),
Japan (10,100 MT), and the Philippines (400 MT).
Soybean
Cake and Meal:
Net sales of 182,400 MT for 2019/2020 were up 75 percent from the previous week and 24 percent from the prior 4-week average. Increases primarily for Canada (95,700 MT), Mexico (24,600 MT, including decreases of 100 MT), Colombia (16,000 MT, including decreases
of 3,000 MT), Peru (12,000 MT), and Indonesia (11,200 MT), were offset by reductions for Guatemala (4,900 MT), Costa Rica (1,900 MT), Belgium (1,700 MT), Jamaica (1,100 MT), and El Salvador (900 MT). For 2020/2021, net sales of 70,000 MT primarily for El
Salvador (18,000 MT), Colombia (18,000 MT), Mexico (15,900 MT), Canada (6,200 MT), and Panama (6,000 MT), were offset by reductions for the Philippines (2,200 MT). Exports of 196,500 MT were down 15 percent from the previous week and 5 percent from the prior
4-week average. The destinations were primarily to Japan (35,700 MT), Canada (35,600 MT), Mexico (34,700 MT), the Dominican Republic (24,500 MT), and Panama (16,400 MT).
Late
Reporting:
For 2019/2020, net sales totaling 400 MT were reported late. These sales were reported for the Philippines. For 2019/2020, exports totaling 800 MT were reported late. The destination was the Philippines.
Soybean
Oil: Net
sales reductions of 2,500 MT for 2019/2020–a marketing-year low–reported for the Dominican Republic (7,100 MT), Mexico (2,200 MT), and Canada (200 MT), were more than offset by reductions for Guatemala (12,000 MT). For 2020/2021, net sales of 48,700 MT
were for South Korea (28,000 MT), Guatemala (18,000 MT), and Canada (2,700 MT). Exports of 11,900 MT were down 75 percent from the previous week and 52 percent from the prior 4-week average. The destinations were primarily to Guatemala (9,700 MT), Mexico
(1,800 MT), and Canada (400 MT).
Cotton:
Net sales for 2020/2021, which began August 1, totaled 6,900 RB. Increases reported for Pakistan (10,100 RB, including decreases of 300 RB), Indonesia (7,500 RB, including 6,600 RB switched from the Philippines, 100 RB switched from Japan, and decreases of
100 RB), Vietnam (6,200 RB, including 1,300 RB switched from South Korea), Turkey (5,900 RB), and Japan (3,400 RB), were offset by reductions primarily for China (21,500 RB), the Philippines (6,600 RB), and El Salvador (1,200 RB). A total of 2,883,200 RB
in sales were carried over from the 2019/2020 marketing year, which ended July 31. Exports for the period ending July 31 of 43,600 RB brought accumulated exports to 14,174,500 RB, up 8 percent from the prior years’ total of 13,158,900 RB. The destinations
were primarily China (19,500 RB), Vietnam (13,800 RB), Bangladesh (2,300 RB), Peru (1,400 RB), and Thailand (1,300 RB). Exports for August 1 – 6 totaled 278,600 RB, with China (157,100 RB), Vietnam (56,300 RB), Turkey (13,700 RB), Pakistan (11,700 RB), and
Bangladesh (9,600 RB) being the primary destinations. Net sales of Pima for 2020/2021totaled 10,400 RB. Increases were primarily for China (6,200 RB), Bangladesh (1,700 RB), India (900 RB), Vietnam (900 RB), and Pakistan (600 RB). A total of 116,400 RB
in sales were carried over from the 2019/2020 marketing year, which ended July 31. Exports for the period ending July 31 of 3,700 RB brought accumulated exports to 486,600 RB, down 25 percent from the prior years’ total of 644,800 RB. The destinations were
primarily Pakistan (1,400 RB), Vietnam (900 RB), India (700 RB), China (400 RB), and Greece (200 RB). Exports for August 1 – 6 totaled 5,600 RB, with China (2,500 RB), Peru (1,200 RB), Vietnam (900 RB), Pakistan (900 RB) and Turkey (200 RB) being the primary
destinations.
Exports
for Own Account:
For 2019/2020, decreases were reported for 2,300 RB China. For 2020/2021 exports for own account total of 17,300 RB were carried over from the 2019/2020 marketing year, which ended July 31. Exports for own account totaling 4,000 RB to Vietnam (2,600 RB)
and Bangladesh (1,400 MT) were applied to new or outstanding sales. For 2020/2021, the outstanding balance of 32,700 RB including carryover is for China (24,300 RB), Indonesia (3,900 RB), Malaysia (2,600 RB), Bangladesh (1,000 RB), and Vietnam (900 RB).
Hides
and Skins:
Net sales of 429,700 pieces for 2020 were up 30 percent from the previous week, but down 4 percent from the prior 4-week average. Increases primarily for China (362,300 whole cattle hides, including decreases of 14,200 pieces), Mexico (41,100 whole cattle
hides, including decreases of 1,000 pieces), South Korea (17,400 whole cattle hides, including decreases of 500 pieces), Spain (4,500 whole cattle hides), and Hong Kong (700 whole cattle hides), were offset by reductions primarily for Thailand (4,200 whole
cattle hides), Taiwan (2,000 whole cattle hides), and Brazil (600 whole cattle hides). Additionally, net sales of 10,400 calf skins reported for Italy, were offset by reductions for Belgium (300 kip skins). Exports of 471,600 pieces reported for 2020 were
down 2 percent from the previous week, but up 1 percent from the prior 4-week average. Whole cattle hides exports were primarily to China (368,600 pieces), Mexico (43,000 pieces), South Korea (40,900 pieces), Indonesia (3,200 pieces), and Thailand (3,000
pieces). In addition, exports of 2,500 kip skins were to Mexico (1,300 kip skins) and Belgium (1,200 kip skins).
Net
sales of 134,900 wet blues for 2020 were up 67 percent from the previous week and 40 percent from the prior 4-week average. Increases primarily for China (61,600 unsplit and 4,500 grain splits), Thailand (26,600 unsplit, including decreases of 200 unsplit),
Vietnam (25,800 unsplit), Italy (13,200 unsplit, including decreases of 300 unsplit), and Mexico (3,300 unsplit, including decreases of 100 unsplit), were offset by reductions for Mexico (900 grain splits). Exports of 96,600 wet blues for 2020 were down 35
percent from the previous week and 6 percent from the prior 4-week average. The destinations were primarily to China (41,700 unsplit), Italy (34,800 unsplit and 3,700 grain splits), Thailand (6,200 unsplit), Mexico (3,100 grain splits and 2,600 MT unsplit),
and the Dominican Republic (2,400 unsplit). Total net sales of 156,200 splits were for Vietnam. Exports of 280,000 pounds were to Vietnam.
Beef:
Net
sales of 11,600 MT reported for 2020 were down 13 percent from the previous week and 46 percent from the prior 4-week average. Increases primarily for Japan (2,900 MT, including decreases of 500 MT), China (1,900 MT), Canada (1,400 MT, including decreases
of 100 MT), Hong Kong (1,300 MT, including decreases of 100 MT), and South Korea (1,200 MT, including decreases of 600 MT). Exports of 16,800 MT were down 4 percent from the previous week, but up 1 percent from the prior 4-week average. The destinations
were primarily to South Korea (5,500 MT), Japan (4,800 MT), Taiwan (1,500 MT), Mexico (1,100 MT), and Hong Kong (1,000 MT).
Pork:
Net
sales of 10,500 MT reported for 2020 were down 66 percent from the previous week and 70 percent from the prior 4-week average. Increases primarily for Mexico (8,800 MT, including decreases of 200 MT), Japan (2,700 MT, including decreases of 900 MT), Canada
(1,600 MT, including decreases of 400 MT), Australia (1,100 MT), and Chile (1,000 MT), were offset by reductions primarily for China (8,800 MT). For 2021, total net sales of 100 MT were for Australia. Exports of 34,900 MT were up 2 percent from the previous
week and 7 percent from the prior 4-week average. The destinations were primarily to Mexico (11,000 MT), China (9,900 MT), Japan (4,000 MT), Canada (2,300 MT), and South Korea (1,300 MT).
August
13, 2020 1 FOREIGN AGRICULTURAL SERVICE/USDA
SUMMARY OF EXPORT TRANSACTIONS
REPORTED UNDER THE DAILY SALES REPORTING SYSTEM
FOR PERIOD ENDING AUGUST 6, 2020
COMMODITY
DESTINATION QUANITY (MT)
MARKETING YEAR
SOYBEANS CHINA 1,170,000 MT 1/ 2020/2021
SOYBEANS UNKNOWN 8,000 MT 1/ 2019/2020
SOYBEANS UNKNOWN 363,000 MT 1/ 2020/2021
1/ Export sales.
Terry Reilly
Senior Commodity Analyst – Grain and Oilseeds
Futures International │190 S LaSalle St., Suite 410│Chicago, IL 60603
W: 312.604.1366
AIM: fi_treilly
ICE IM:
treilly1
Skype: fi.treilly

Trading of futures, options, swaps and other derivatives is risky and is not suitable for all persons. All of these investment products are leveraged, and you can lose more than your initial deposit. Each investment product is offered
only to and from jurisdictions where solicitation and sale are lawful, and in accordance with applicable laws and regulations in such jurisdiction. The information provided here should not be relied upon as a substitute for independent research before making
your investment decisions. Futures International, LLC is merely providing this information for your general information and the information does not take into account any particular individual’s investment objectives, financial situation, or needs. All investors
should obtain advice based on their unique situation before making any investment decision. The contents of this communication and any attachments are for informational purposes only and under no circumstances should they be construed as an offer to buy or
sell, or a solicitation to buy or sell any future, option, swap or other derivative. The sources for the information and any opinions in this communication are believed to be reliable, but Futures International, LLC does not warrant or guarantee the accuracy
of such information or opinions. Futures International, LLC and its principals and employees may take positions different from any positions described in this communication. Past results are not necessarily indicative of future results.