PDF Attached
USDA
24-hour: 126k soybeans for China. USDA export sales were the best we have seen for most of the commodities in a while.
UNITED
STATES
The
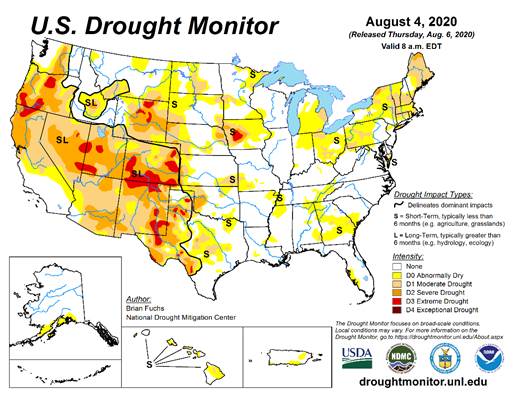
general weather theme for the United States has not changed much today relative to that of earlier this week. An erratic rainfall distribution is expected over the next ten days with some areas getting better rainfall than others. The next period of active
tropical weather is expected in ten days to two weeks and that is the earliest that weather in the U.S. can change again. In the meantime, higher heights aloft will bring back warmer temperatures and it will be difficult for many crop areas to get enough rain
to counter evaporation even though the GFS model continues to generate frequent precipitation.
EUROPE/BLACK
SEA
Relief
from dryness in France and neighboring areas is still being advertised for next week. The situation will be debated for a while over how significant the relief will be, but the nation is critically dry and needs rain. A notable warm up is expected to precede
the rain adding more stress to crops and making the already stressful situation worse.
- The
GFS model run does a better job today keeping the rain in western Europe relative to that of Wednesday’s outlook maps and that leads to greater drying in central and eastern Europe as the next ten days evolve - Some
showers are still expected, but areas east of France and the U.K. may not much increasing soil moisture - Ongoing
dryness is still advertised for the far southeastern part of the Balkan Countries including a part of the lower Danube River Basin for the next ten days - Showers
in Ukraine and Russia’s Southern region are not expected to generate enough rain to make much difference in crop or field conditions
Relief
expected in France and the U.K. next week may get as far east as Belgium and a few far western Germany locations, but not much farther than that. The moisture will provide some relief from the very warm to hot weather and limited rain that is expected today
into the weekend. All of the rain will be welcome, but it will come a little too late in the summer to have a big impact on production and the greatest moisture may be a little more sporadic than desired.
RUSSIA
NEW LANDS
Model
consistency today remains for abundant rain to fall near and immediately east of the Ural Mountains in the central New Lands over the coming ten days. Some areas may receive 2.00 to more than 5.00 inches of rain by the end of next week. Some of that same region
is already saturated or nearly saturated and that may raise some potential for flooding.
- Early
maturing wheat and sunseed in the region could experience a threat to crop quality and drier weather may soon be needed - Most
of the global forecast models have been suggesting an eastward shift of rainfall into the eastern New Lands next week - Not
all of the eastern New Lands will be impacted, but some areas near the north-central Kazakhstan border may get 1.00 to 2.00 inches of rain
- Areas
to the north and east of that region may not get as much rain with less than 0.50 inch resulting in some ongoing concern over dryness
- The
driest areas will be in western parts of Siberia after the end of next week
Overall,
the weather change advertised for next week will be mostly good, although concern over crop quality in the central New Lands will rise because of the wetter bias in that region.
CHINA
- Heavy
rain causing some local flooding occurred Wednesday from northern Shaanxi (where significant rain fell Tuesday) into Shanxi and western parts of Hebei where amounts varied from 3.00 to more than 6.00 inches
- Lighter
rain surrounded the region - Heavy
rain also expanded in North Korea with additional amounts of 2.75 to more than 6.00 inches resulting - More
flooding rain is expected in the Korean Peninsula periodically through the next week to ten days - China’s
forecast has not changed greatly for the next two weeks - Most
of the nation will get rain frequently and amounts will be great enough to either maintain moisture abundance or to induce a net boost in soil moisture - The
Yangtze River Basin will be the only exception with net drying likely in the lower half of the basin and especially in the interior southeastern part of the nation - Soil
conditions are already saturated in many crop regions in eastern China implying there is potential for local flooding nearly every day in areas of greatest rainfall - Korean
Peninsula is still advertised to receive copious amounts of rain over the next ten days resulting in serious flooding and possible crop and property damage
Overall,
no significant changes were noted or expected in eastern China’s key crop areas during the next ten days to two weeks.
AUSTRALIA
- No
significant change was noted in the first ten days of the outlook - However,
less rain was suggested for eastern South Australia Aug. 13-14 - Some
of the reduction was needed - GFS
model increased rainfall from southern Queensland to northeastern New South Wales August 17-20 - Some
of this increased rainfall was overdone
The
bottom line remains very good for future winter wheat, barley and canola development. Most crop areas get rain at one time or another during the next two weeks favoring a good start to the growing season when season warming evolves soon.
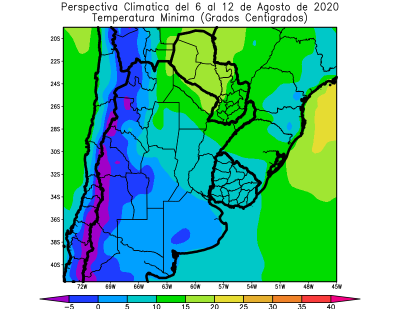
SOUTH
AMERICA
- Rain
was reduced in Argentina Aug. 18-19 - The
reduction was needed - The
GFS model run was still exaggerating rainfall for southern Brazil and may be promoting it a little too far to the north into Sao Paulo during the August 17-21 period - The
model also brings rain southern Minas Gerais and Rio de Janeiro Aug. 20-21 and that is not likely to verify
The
bottom line remains one of ongoing concern for western Argentina wheat and barley in where drought remains and is not likely to change. Improving Southern Brazil rainfall next week and out through Aug. 21 will improve wheat conditions and early corn planting
conditions, but it is still questionable how heavy that rainfall will be and how far to the north it might extend. A little too much rain may impact a few wheat areas and local flooding will be possible
Source:
World Weather Inc and FI
- FAO
World Food Price Index - USDA
weekly crop net-export sales for corn, soybeans, wheat, cotton, pork, beef, 8:30am - Port
of Rouen data on French grain exports
FRIDAY,
August 7:
- China’s
foreign trade data for July, including imports of soybeans and meat - ICE
Futures Europe weekly commitments of traders report, 1:30pm (6:30pm London) - CFTC
commitments of traders weekly report on positions for various U.S. futures and options, 3:30pm - FranceAgriMer
weekly update on crop conditions
Source:
Bloomberg and FI
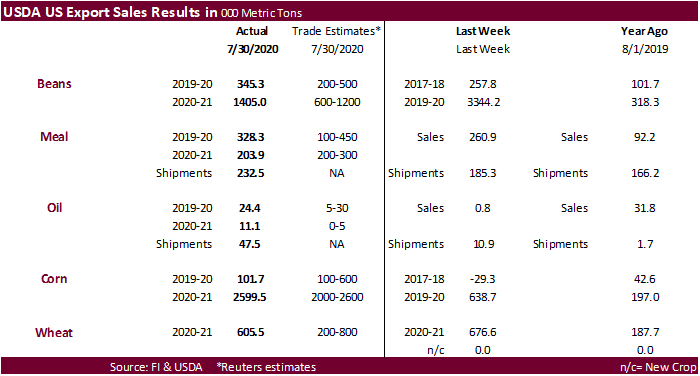
USDA
export sales
Very
good all around…
Old
crop and new-crop combined for US soybean meal export sales were impressive at over 525,000 short tons. New crop corn export sales were withing expectations at 2.6 million tons. Old crop soybeans were withing expectations but new crop was larger than expected.
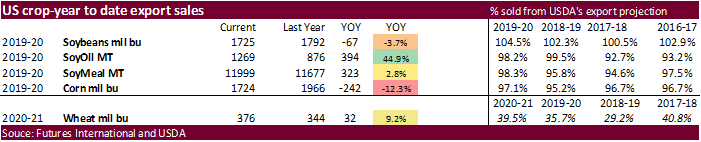
Soybean oil sales were good for old and new crop. All wheat sales topped 600,000 tons, and total commitments are highest since 2014-15. US pork sales were 30,300 tons. Old crop sorghum sales showed a net reduction of 13,300 tons but new crop added 211,600
tons, including 75,600 tons for China.
·
US Initial Jobless Claims Aug 1: 1186K (est 1400K; prevR1435K; prev 1434K)
·
US Continuing Claims Jul 25: 16107K (est 16900K; prevR16951K; prev 17018K)
-
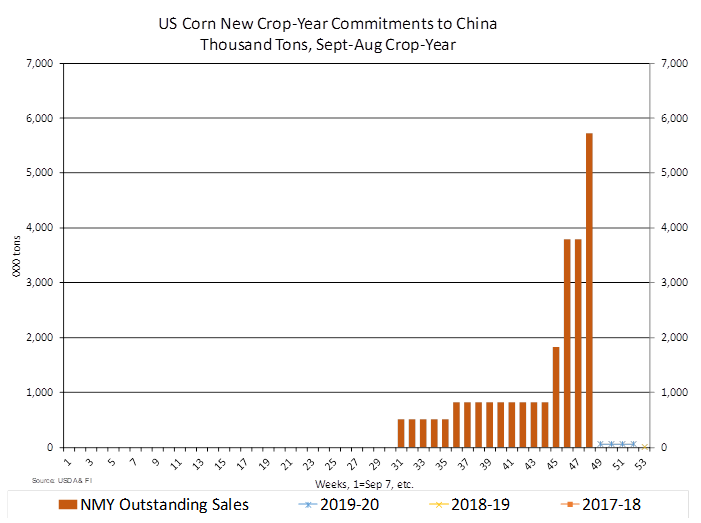
Corn
futures ended mixed with Sep and Dec slightly higher, Mar unchanged and back months slightly lower. Wheat prices were sharply lower witch limited upside movement in corn after USDA reported very good export sales. The large sales announcements didn’t surprise
given the large China corn announcement last week. Look for a two-sided trade in corn, soybean complex, and wheat today. US weekly ethanol production reported yesterday was slightly bearish for corn.
-
Dry
weather is expected through Saturday for the Eastern Corn Belt. While it may be drying down, the temps are mild and should cause no crop issues.
-
ProAgro
raised its Ukraine 2020 corn harvest forecast to 38.86 million tons from 38.49 MMT previously.
-
This
week marks the 15th anniversary of the Energy Policy Act of 2005, creating the Renewable Fuel Standard.
https://ethanolrfa.org/wp-content/uploads/2020/08/RFS-15th-Anniversary-Publication-Final.pdf
Corn
Export Developments
-
None
reported
Source:
Reuters and FI
- September
corn is seen in a $3.00 and $3.25 range. December lows could reach $2.95 (Updated 8/3). The US is staring down at a large crop.