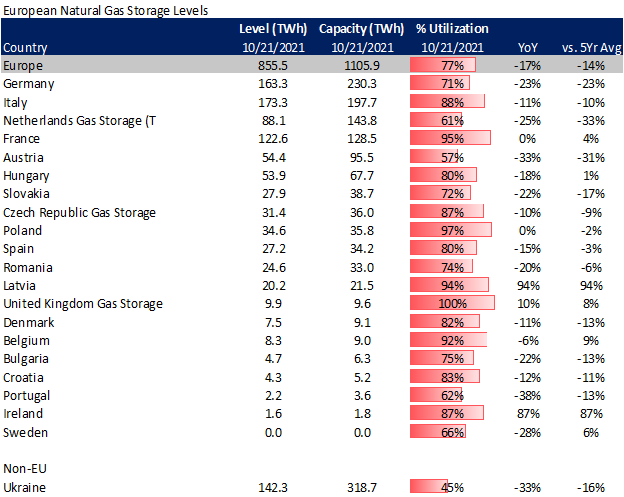
[Note: 1000 TWh = 3412 Bcf]
As with North America, the natural gas withdrawn during the winter is highly dependent on weather. That being said, Europe not a net net producer like North America and it’s highly reliant on imports. It imports a vast majority of its supplies via pipeline and LNG. So a cool winter + lower imports could blow its seasonal storage pull past what is normal. Here are the last four seasonal storage draws for reference:
Winter 16/17 698 TWh
Winter 17/18 772 TWh
Winter 18/19 506 TWh
Winter 19/20 479 TWh
Domestic gas production in Western Europe has been declining due to natural depletion and political pressure, creating a supply shortfall that has been mostly taken up by Russian piped gas. New supply sources have been recently constructed from the Eastern Mediterranean and the Balkans, but it still leaves a big gap that can only be filled by Russian piped supplies.
Russia’s Gazprom transports gas via the westerly route via Ukraine, the northwesterly TurkStream, and the Nord Stream in the Baltic Sea. And with the recent completion of Nord Stream 2, Europe will be even more tied to Russian. At the moment, this supply source is tied up in political limbo.
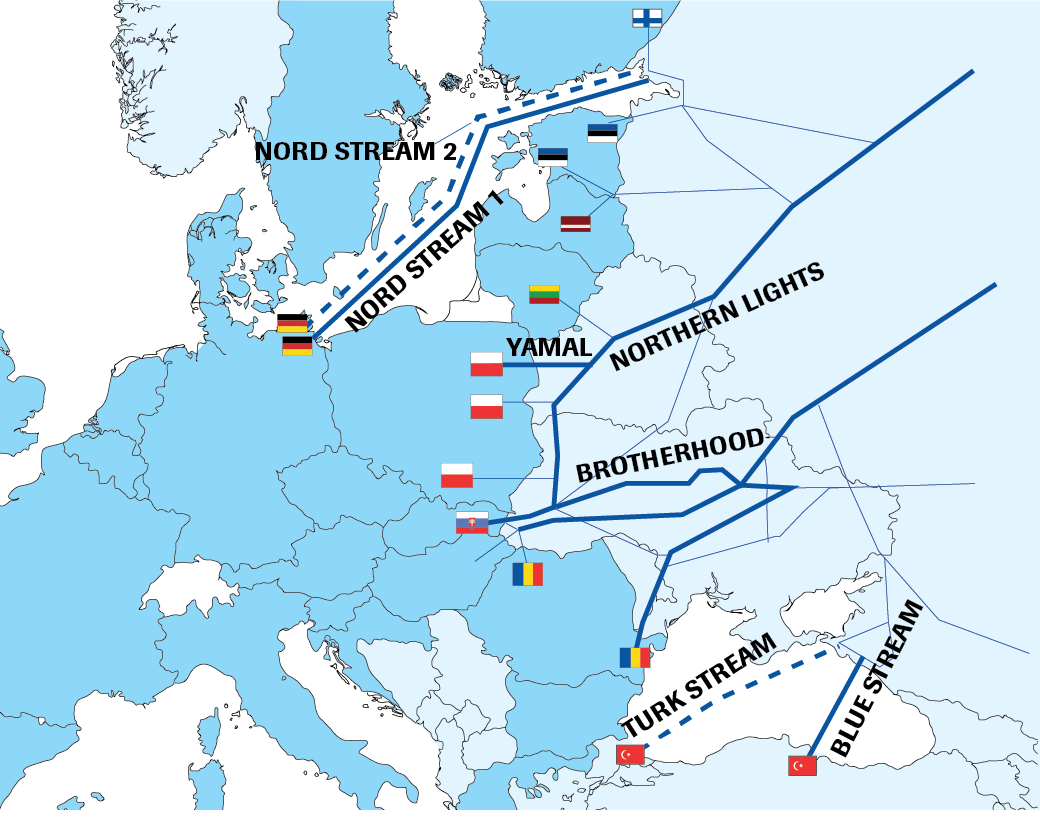
Source: https://spectator.clingendael.org/pub/2018/2/the-role-of-gas/
The market is not expecting increased Russian supply to Europe this winter, particularly given muted flows this summer (April–September 2021). Gazprom has stated they have needed the supplies to refill their domestic gas storage. Last week Reuters reported, “Gazprom’s domestic storage is almost full, giving the Russian state gas giant leeway to increase exports this winter”. No one is holding their breath for more Russian supplies this winter unless Europe agrees to more long-term contracts and for the certification of the recently completed Nord Stream 2 pipeline.
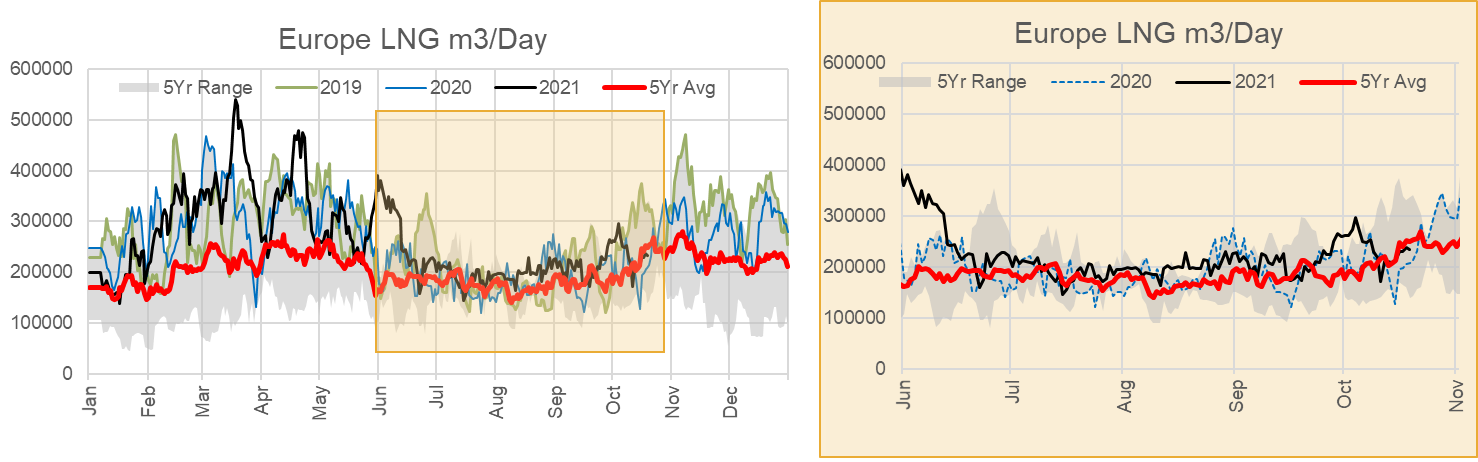
The EU has been looking to diversify its energy with declining domestic production, hence looking to LNG imports as the savior. With financial incentives for LNG receiving terminal construction, Europe now has 28 existing LNG receiving terminals and 22 in various development stages. Unlike summer 2020 when COVID led to LNG import cancellation, this past summer was quite the opposite. Europe has been in a constant struggle with Asia and South America for any flex LNG cargo. Any price move to make LNG more economic to head to Europe was matched by these other global destinations.
Since June, LNG deliveries averaged 30 m3/day which ties it with the record set in 2019 (for the same period). Unfortunately, this has not been enough with the increased power demand due to EU policy phasing out coal and making operation coal plants uneconomical with increasing carbon prices.
More of the US export supplies were suppose to be destined for Europe, but that just has not been the case with the strong Asian demand and drought in South America. This coming winter we could see a small bump up in US to Europe exports with new additional capacity coming online. We already see small flows to the Calcasieu Pass and we are expecting Sabine Pass’ T6 to start up in late Q4.
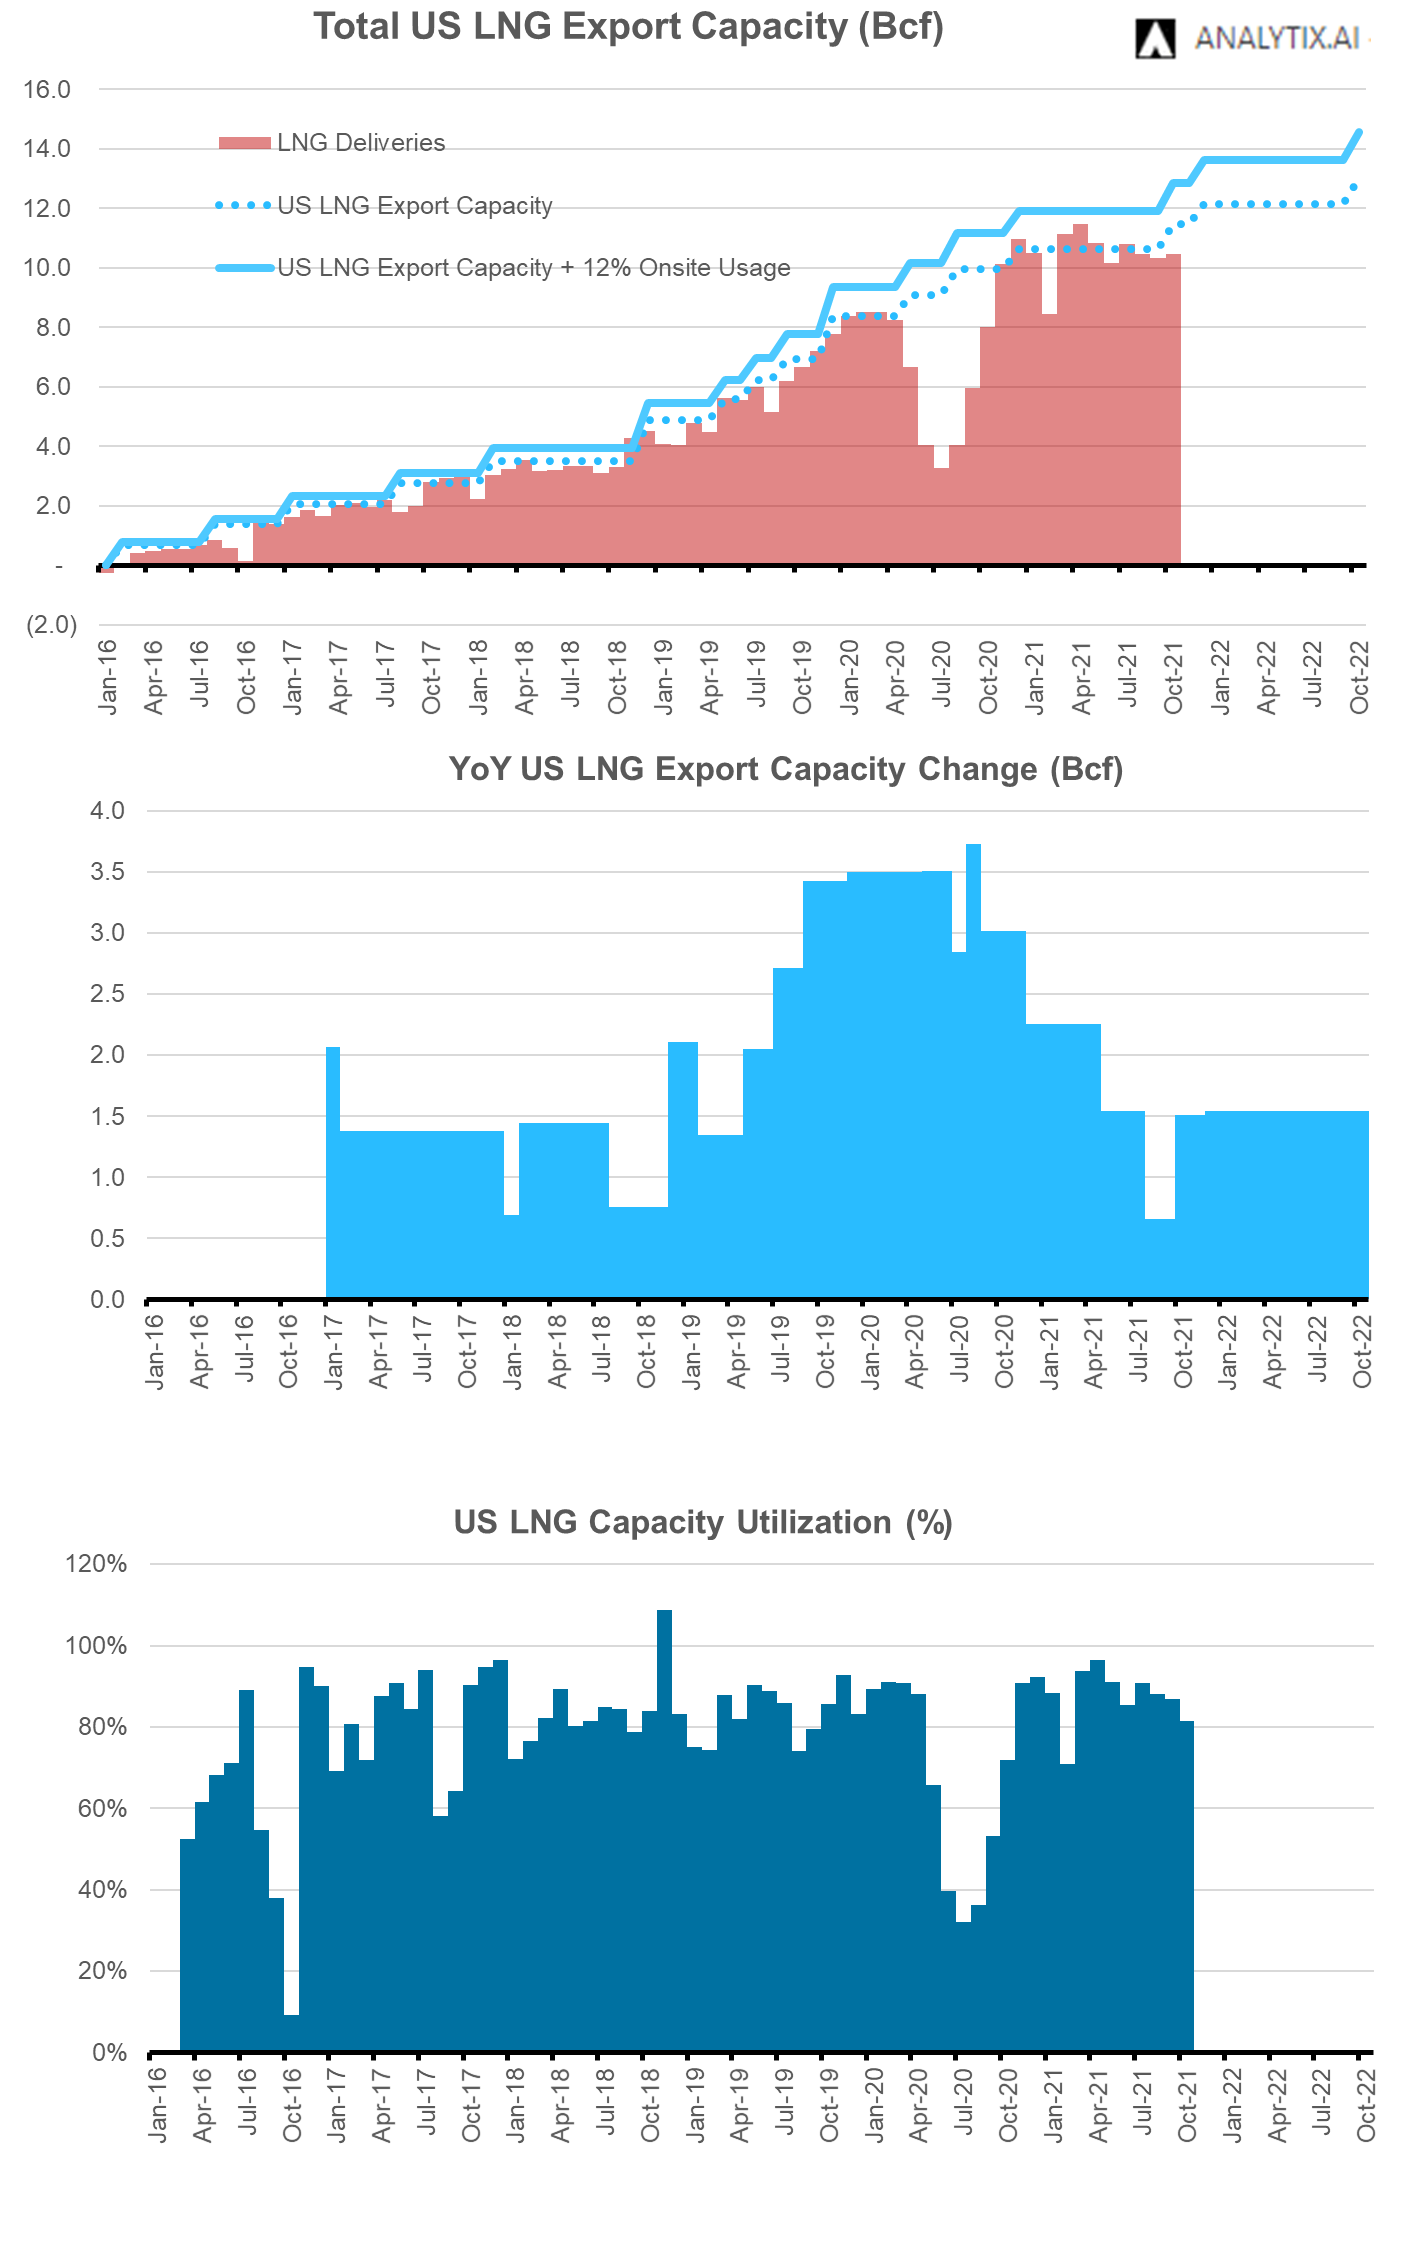
Our expectation is for feedgas levels to average 12.1 Bcf/d this winter with the new capacity coming online, and the overall capacity being utilized 90% on average. Typical winter utilization is 84-89%, but we are assuming a higher utilization with the strong global spreads.
Fundamentals for the week ending Oct 22:
The EIA reported a +92 Bcf injection for the week ending Oct 15, which was slightly above consensus but within the range of expectations. This was the 5th week in a row where the injection exceeded both LY and the 5Yr average injection levels. Wind continues to play a big role in the weekly storage number. For this specific week, power generation was relatively flat versus the previous week but the wind was a lot stronger. On average wind generation was 30 GWh higher, which we calculate to be 22% higher than the normally expected wind generation level. This helped ease power burn and put more gas into storage.
For the week ending Oct 22nd, our early view is +91 Bcf. The 5Yr average is a +62 Bcf injection. Our projected injection would take the L48 storage level to 3552 Bcf (-399 vs LY, -122 vs. 5Yr). As we mentioned last week, we are within striking distance of the 5Yr average end of the season. The next few weeks continue to show a warm trend; hence we are expecting injection into the first week of November. This should get storage to quite a comfortable level as we enter the winter months. [as a reminder: We are even closer if we adjust the 5Yr average by the 51 Bcf reclass by PG&E.]
Domestic dry gas production was lower by 0.2 Bcf/d to an average of 92.3 Bcf/d. There was some fluctuation amongst the different producing regions, but nothing too noteworthy. Canadian supplies were a lot higher this week taking the overall supply to a strong level.
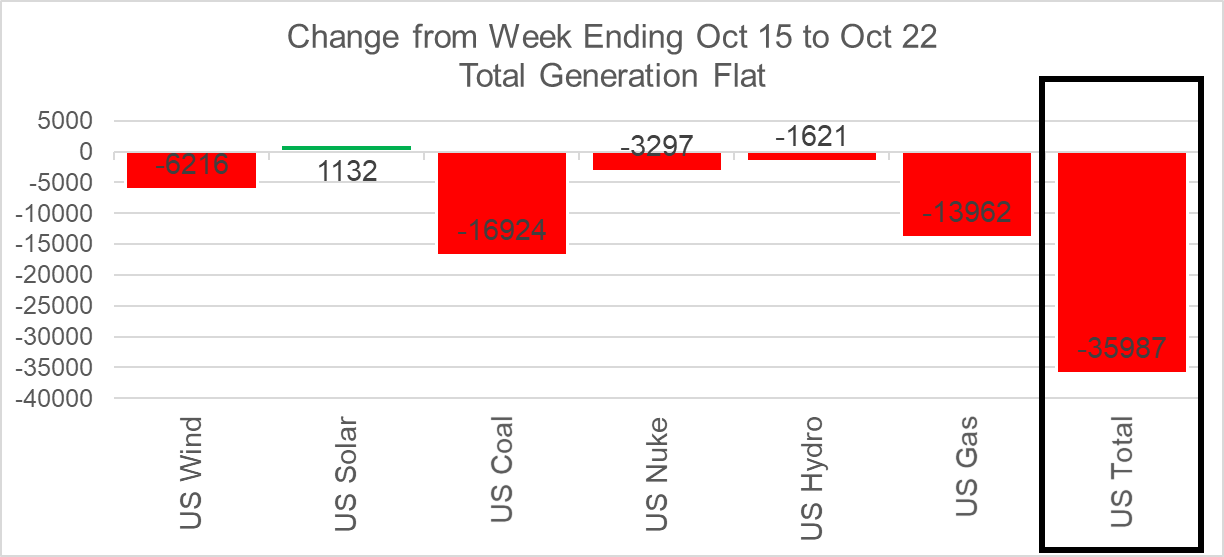
Total consumption was mixed this week as weather transitioned from CDDs to HDDs in most Northern regions. At the national level, we lost 1.9 CDDs and gained 2.2 HDDs WoW. Power loads, in general, are dropping with the lower cooling demand, and hence even with wind lower this week we saw natural gas generation lower. Here is how the generation stack changed week-on-week.
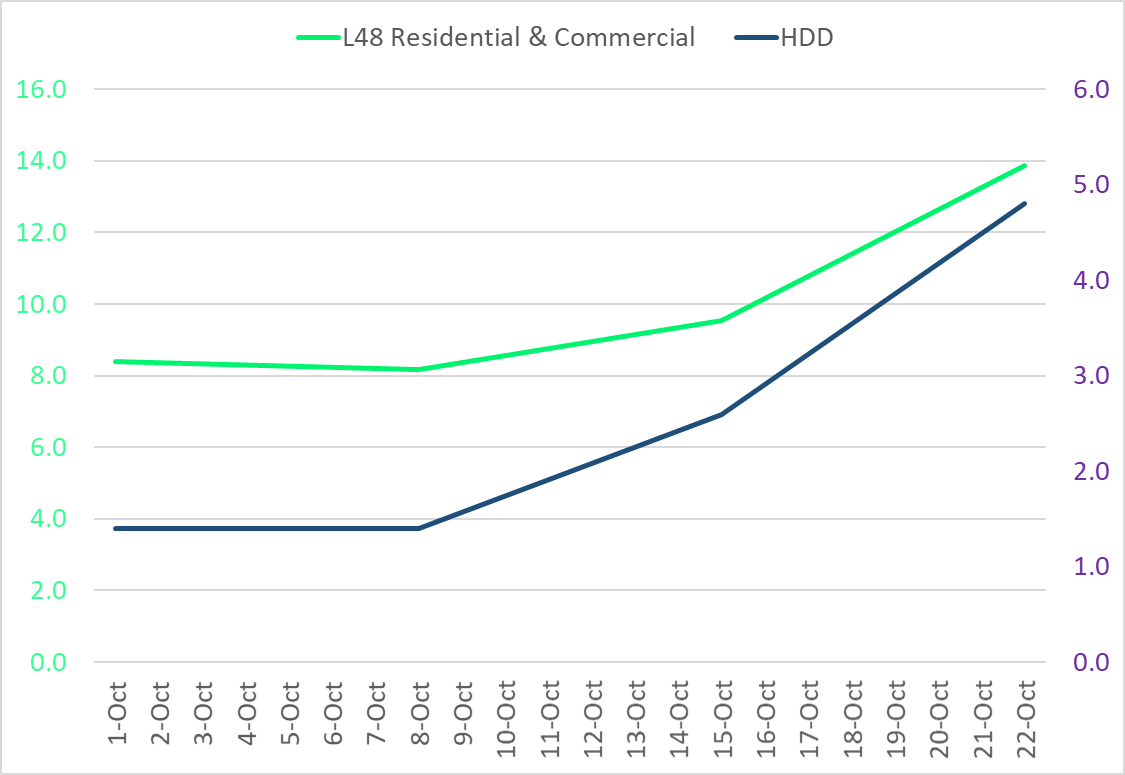
Net we saw an increase in total consumption by ResComm increasing by an estimated 4.3 Bcf/d week-on-week. Here comes the winter.
Deliveries to LNG facilities averaged 10.8 Bcf/d, which was +0.1 Bcf/d higher than the previous week. The biggest changing factor is the return of Cove Point from annual maintenance offset by lower Sabine Pass levels (T3 maintenance looks to continue into the weekend). Also, we should note that Freeport operations continue to remain a bit spotty post-Hurricane Ida. This week we once again saw feedgas flows drop 3 days from 2 Bcf/d to 1.5 Bcf/d.
The net balance was flat week-on-week.
Expiration and rolls: UNG ETF roll starts on Nov 11th and ends on Nov 16th.
Nov futures expire on Oct 27th, and Mov options expire on Oct 26th.
This email, any information contained herein and any files transmitted with it (collectively, the Material) are the sole property of OTC Global Holdings LP and its affiliates (OTCGH); are confidential, may be legally privileged and are intended solely for the use of the individual or entity to whom they are addressed. Unauthorized disclosure, copying or distribution of the Material, is strictly prohibited and the recipient shall not redistribute the Material in any form to a third party. Please notify the sender immediately by email if you have received this email by mistake, delete this email from your system and destroy any hard copies. OTCGH waives no privilege or confidentiality due to any mistaken transmission of this email.