We developed the “expected” weekly generation from each renewable generation type by looking at the historical performance which takes into consideration maintenance schedules and seasonality. We should note that we did not take price into the because in general renewables are free and fall at the bottom of the dispatch stack.
First, let look at the individual performance of each renewable generation type through the summer. In calculating the “expected” wind level, we do make the necessary adjustments to account for the increasing or decreasing capacity of that generation type.
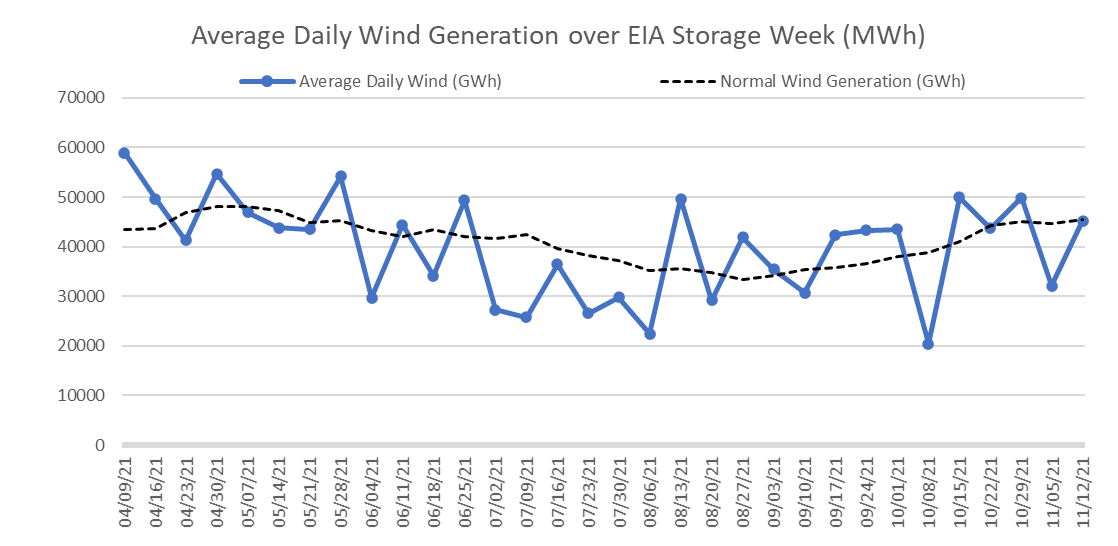
Wind: Wind generation is generally the weakest in the summer months. Overall wind generation’s average performance was on par with the expected, i.e. 32% capacity factor during the summer vs the expected 33%. April had extremely strong wind, while the peak summer months had very low wind. So we got the strong wind when we did not need it, and the low wind when power demand was at its highest. As we observed this past summer, the weekly level of wind had a very strong impact on the storage injections.
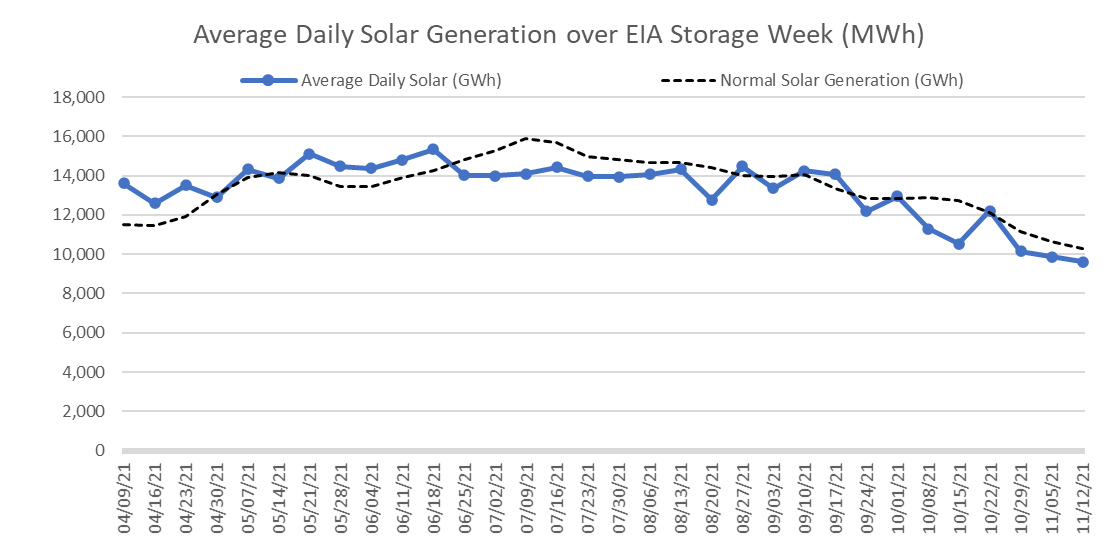
Solar: Solar generation is generally the strongest during the summer months which helps compliment the seasonality of wind. As with wind, overall solar generation’s average performance was on par with the expected, i.e. 24.8% capacity factor during the summer vs the expected 25.1%. Solar either performed or underperformed for weeks in a row, which made it very different from the erratic nature of wind.
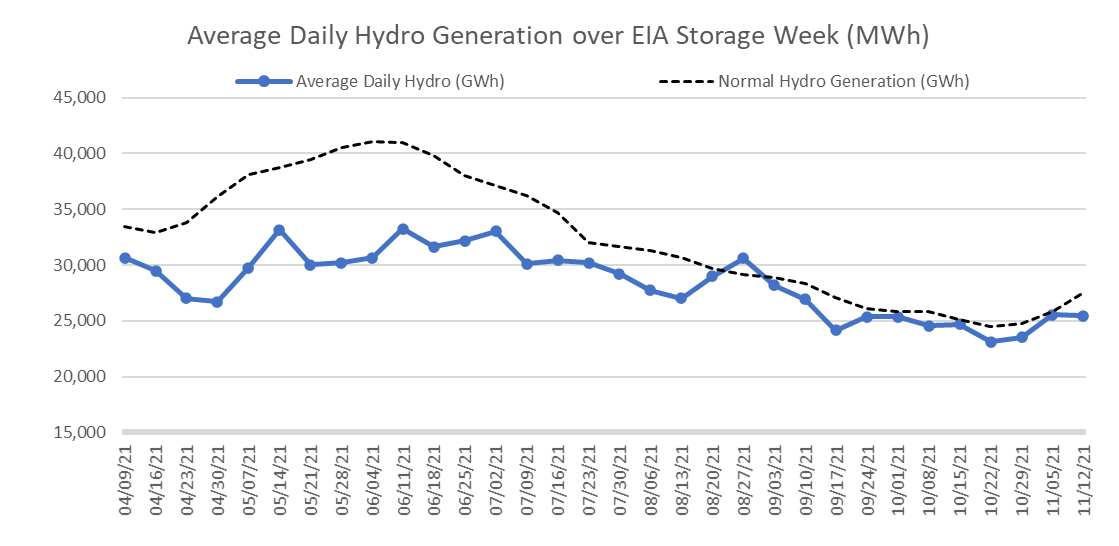
Hydro: Hydro looks to have the largest deviation away from expected levels. In the Q2 time frame, we saw very low levels of hydro power due to a combination of persistent unseasonably warm weather and low snowpack last winter. Overall hydro generation’s average performance was 4% below the expected, i.e. a 28% capacity factor vs 32% over the summer.
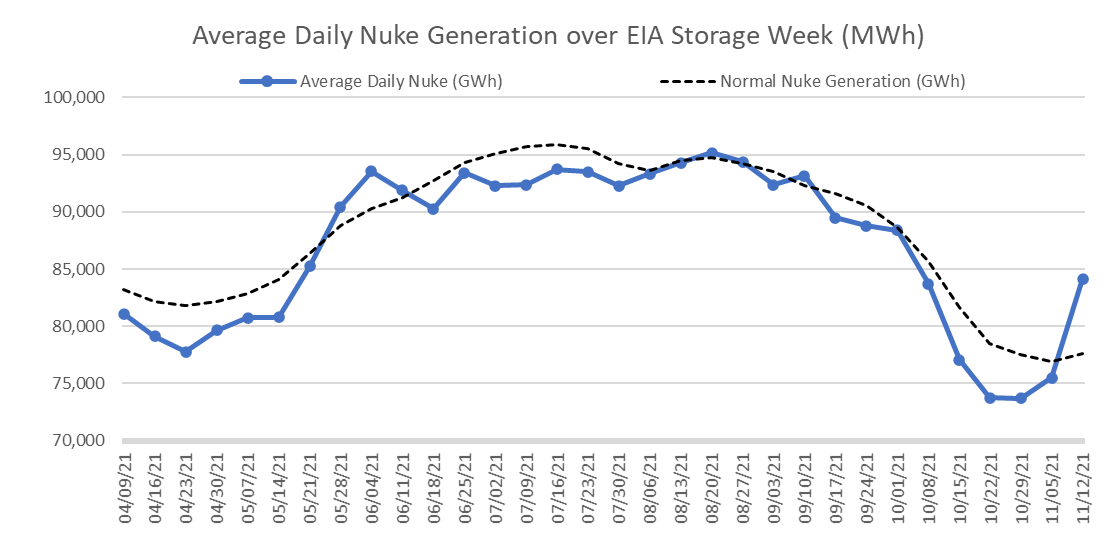
Nuke: Nuke performance lacked during the shoulder season relative to past years. This is generally the refueling/maintenance period where the fleet alternates going offline. We reckon that maintenance could have been a bit more extensive this year due to delays from the 2020 COVID year. Overall nuke generation’s average performance was 1.6% below the expected, i.e. an 87.9% capacity factor vs 89.5% expected over the summer. The month of October saw some of the lower nuke generation levels in recent history.
Below is the aggregate over/under performance data to see how the net impact of all the renewable assets had on the natural gas generation fleet (at the national level).
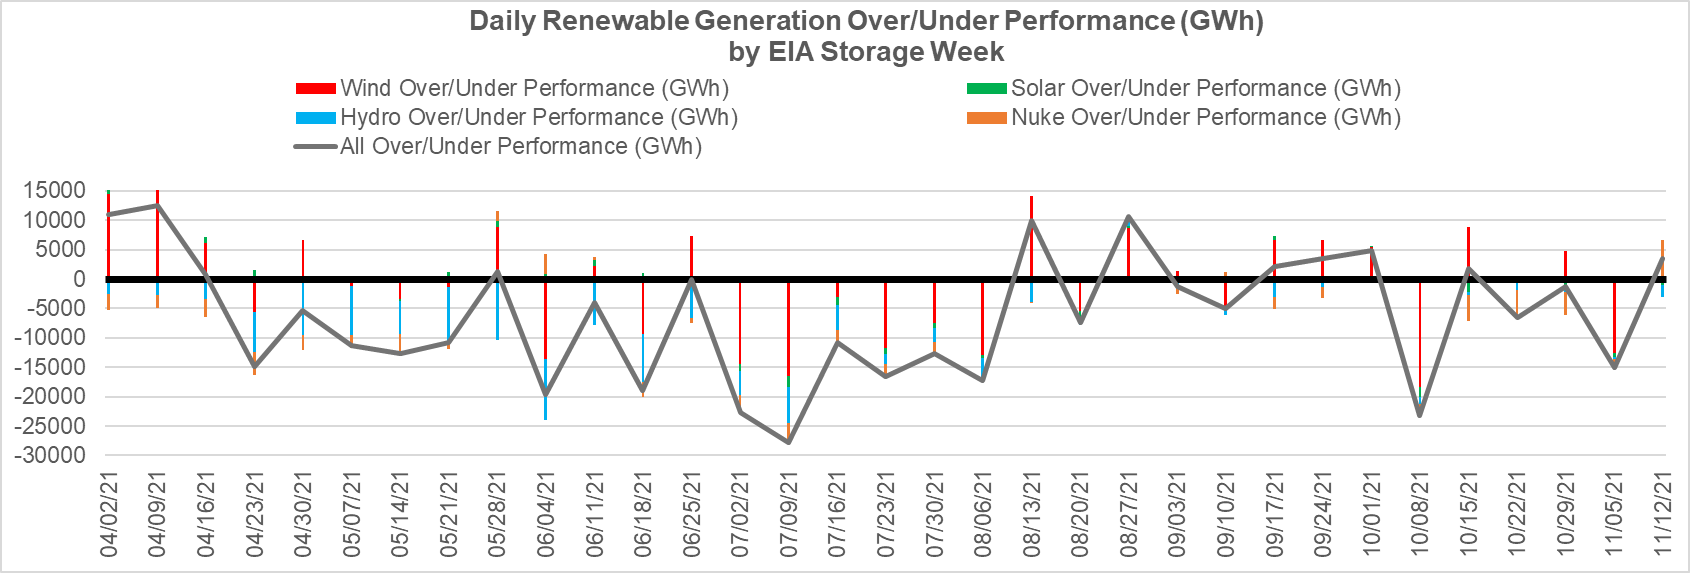
As seen, most of the summer we had renewables lag their expected levels leading to strong natural gas burns. Next, we calculate the daily natural volume impact in Bcf by assuming that a 7.5 heat rate gas plant is either activated or displaced. As seen, gas burns were stronger 2/3 of the summer weeks due to weak renewable generation.
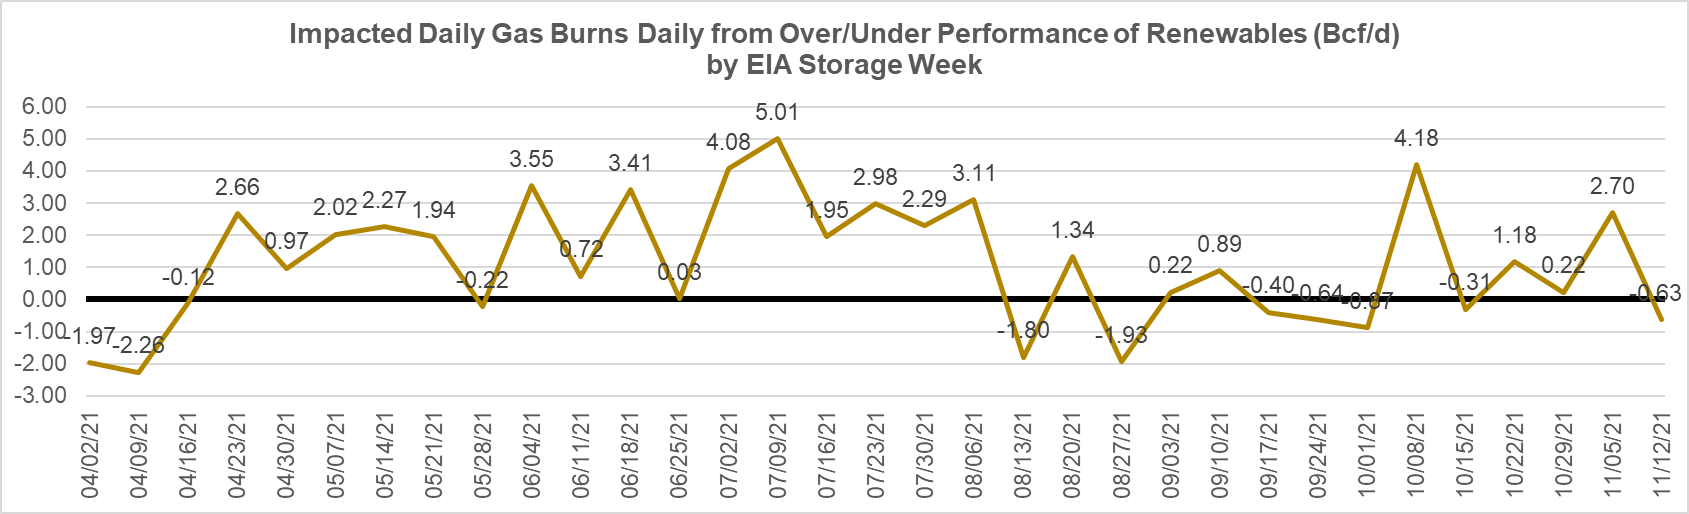
To focus on the last storage report, ie. the week ending Nov 5th, the lower renewables added 2.7 Bcf/d or 19 Bcf of extra power burns through the week. If we were to normalize the storage number for the over/under renewable performance we would have expected a +26 Bcf injection rather than the +7 Bcf that was reported.
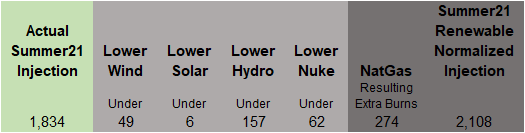
We went and did this every week over this summer to see what we would have injected if renewables would have performed at the expected levels. The total injections from the week ending April 9th to Nov 5th, we saw injections total 1,834 Bcf. If all the renewables did operate at expected levels, then we would have expected an additional +274 Bcf leading to a seasonal injection of 2,108 Bcf. Below is the breakdown by generation type.
This is hypothetical, but it does give us a good idea of how influential renewables are becoming. With the added capacity, its impact will only grow.
Fundamentals for the week ending Nov 12:
The EIA reported a +7 Bcf injection for week ending Nov 5th, which was in line with the market. This combination of cooler temp and low renewables led to strong demand during the reporting week and the single-digit injection. The East region saw a net withdrawal even with App basin production jumping the last few weeks.
For the week ending Nov 12th, our early view is +30 Bcf. Our projected injection would take the L48 storage level to 3648 Bcf (-306 vs LY, -77 vs. 5Yr).
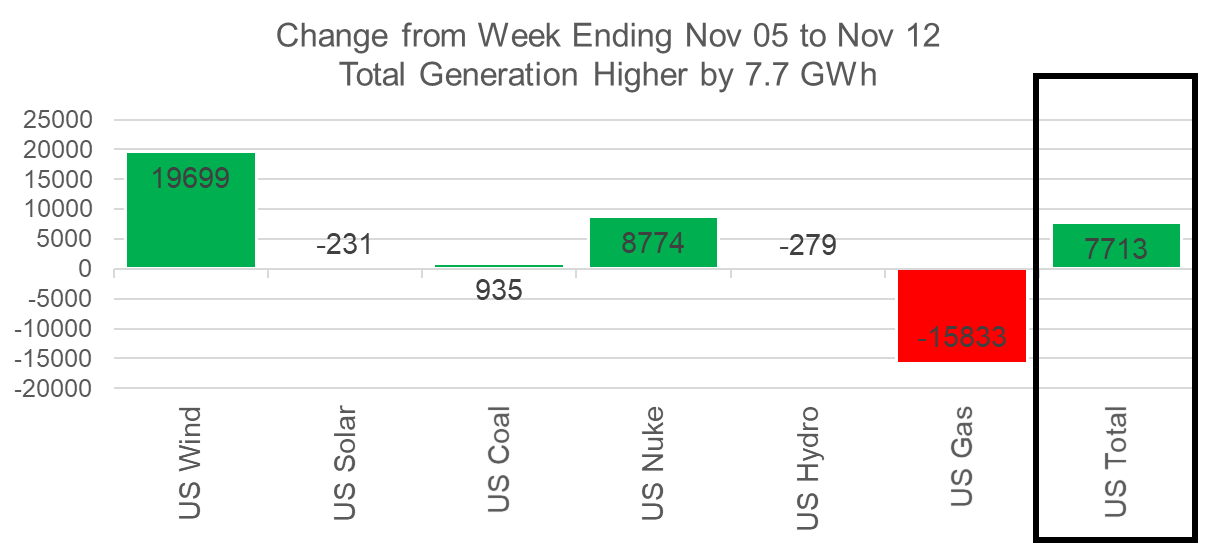
This week we see total consumption was brought lower week-on-week specifically with power burns dropping off. Overall weather was quite similar to the previous week, and with that, we see overall Res/Comm and Industrial consumption flat. The drop was in power burns was particularly related to both wind and nuke generation pushing out natgas generation. Wind was higher by an average of 19 GWh, and nuke was higher by an average of 9 GWh. Overall, we estimate natgas generators using 2.8 Bcf/d less than the previous week.
Domestic dry gas production once again made a move higher by +0.8 Bcf/d to an average of 95.8 Bcf/d. The growth comes particularly out of the Appalachian and Haynesville basins. Noteworthy was last weekend’s production which almost reached 97 Bcf/d based on Bloomberg’s daily estimates. This level was last seen in Q4 2019 before the strong production levels led to a severe supply/demand imbalance and cratering prices.
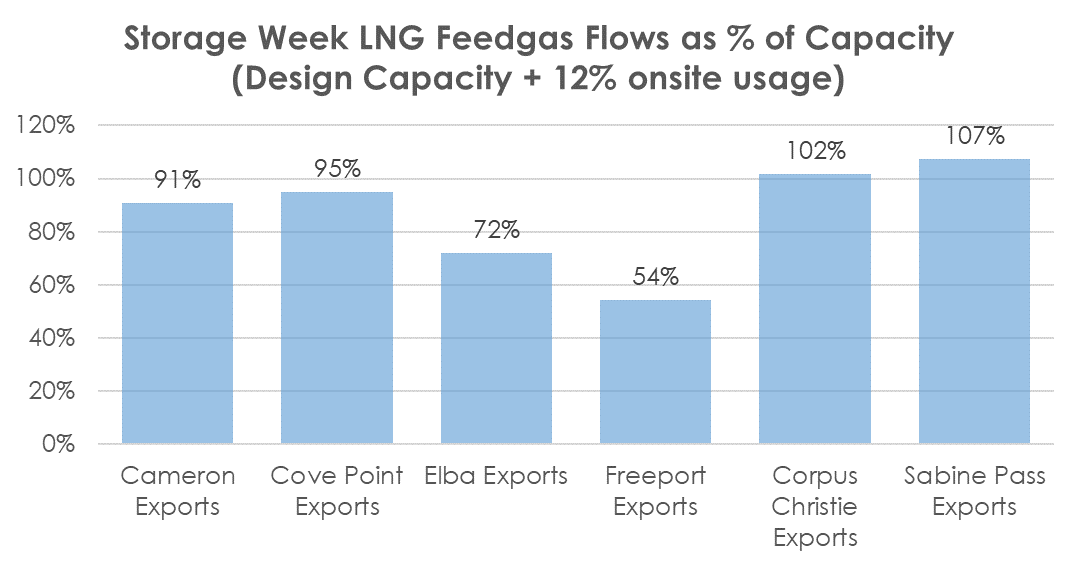
Deliveries to LNG facilities averaged 11.2 Bcf/d, which was +0.3 Bcf/d higher than last week. Freeport operations continued to remain low, while Sabine increased its feedgas level and hit a record last weekend. Freeport is expected to be conducting work on the pretreatment plant until Nov 20th. As seen in the chart below, all facilities are operating at strong levels with some above design capacity. [this could be initial signs of Sabine Train 6 receiving some test volumes]
The net balance was 3.9 Bcf looser week-on-week.
Expiration and rolls: UNG ETF roll starts on Nov 11th and ends on Nov 16th.
Dec futures expire on Nov 28th, and Nov options expire on Nov 24th.
This email, any information contained herein and any files transmitted with it (collectively, the Material) are the sole property of OTC Global Holdings LP and its affiliates (OTCGH); are confidential, may be legally privileged and are intended solely for the use of the individual or entity to whom they are addressed. Unauthorized disclosure, copying or distribution of the Material, is strictly prohibited and the recipient shall not redistribute the Material in any form to a third party. Please notify the sender immediately by email if you have received this email by mistake, delete this email from your system and destroy any hard copies. OTCGH waives no privilege or confidentiality due to any mistaken transmission of this email.