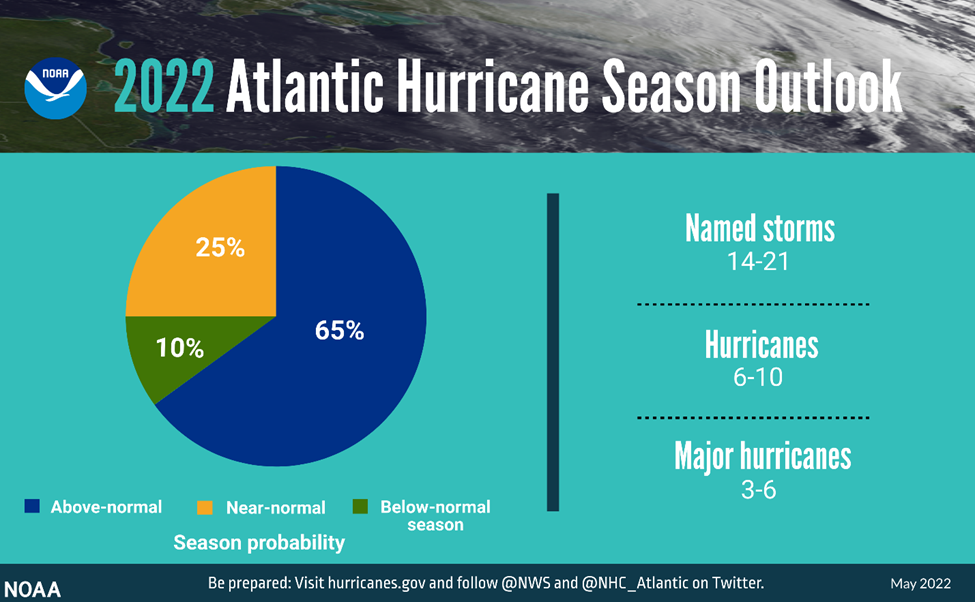
La Nina conditions are representative of:
- a warmer-than-average sea surface temperatures in the Atlantic Ocean and the Caribbean Sea,
- a weaker tropical Atlantic trade winds, and
- an enhanced west African monsoon (the enhanced west African monsoon supports stronger African Easterly waves, which seed many of the strongest and longest-lived hurricanes during most seasons)
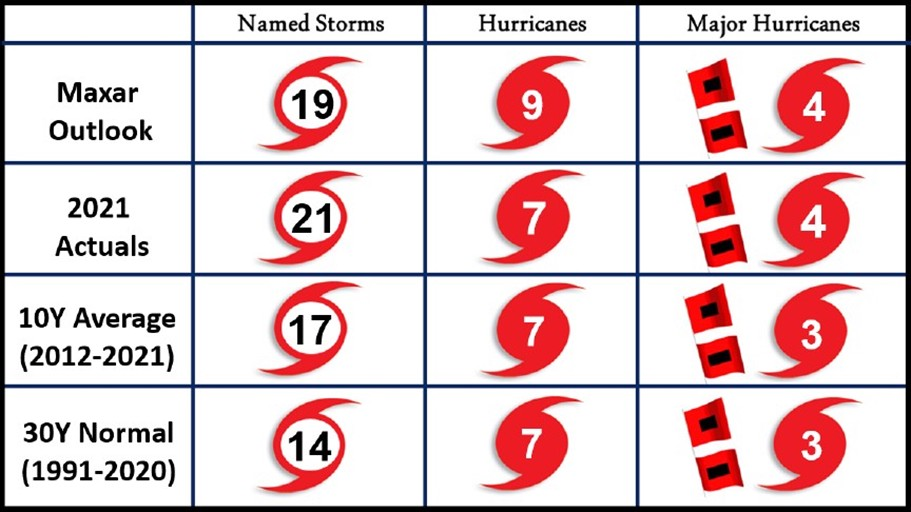
Maxar Weather reported similar activity for this upcoming hurricane season. Here is their most current season forecast:
For the energy markets, hurricanes can have both a supply and demand impact. Four main factors can lead to various scenarios:
- Path – Gulf of Mexico can disrupt production while the up the East Coast has a higher probability of reducing demand (destruction of power infrastructure and cooler temps)
- Intensity – wind speeds which are rated in terms of Cat 1 to 5. The Saffir-Simpson Hurricane Scale defines hurricane strength by categories. A Category 1 storm is the weakest hurricane (winds 74-95 mph or 64-82 kt); a Category 5 hurricane is the strongest (winds greater than 155 mph or 135 kt).
- Speed – A hurricane’s forward speed averages around 15-20 mph. However, some hurricanes stall, often causing destructive heavy rain and storm surge.
- Landfall – massive impact to demand where heavy winds, heavy rains/flooding can damage power infrastructure and reduce onshore infrastructure (including refineries, gas processing, petrochemical plants, and LNG export facilities).
We will be keeping a close eye on hurricane season. Here are a couple of important links
This NOAA page shows upcoming disturbances, TS, and active hurricanes:
National Hurricane Center (noaa.gov)
The BSEE track rig/platform evacuations and oil and gas production outages during GoM storm events:
Activity Statistics Update | Bureau of Safety and Environmental Enforcement (bsee.gov)
Here is a map of all energy infrastructure that is in the path of a hurricane:
Hurricanes, Cyclones, and Typhoons | U.S. Energy Atlas (eia.gov)
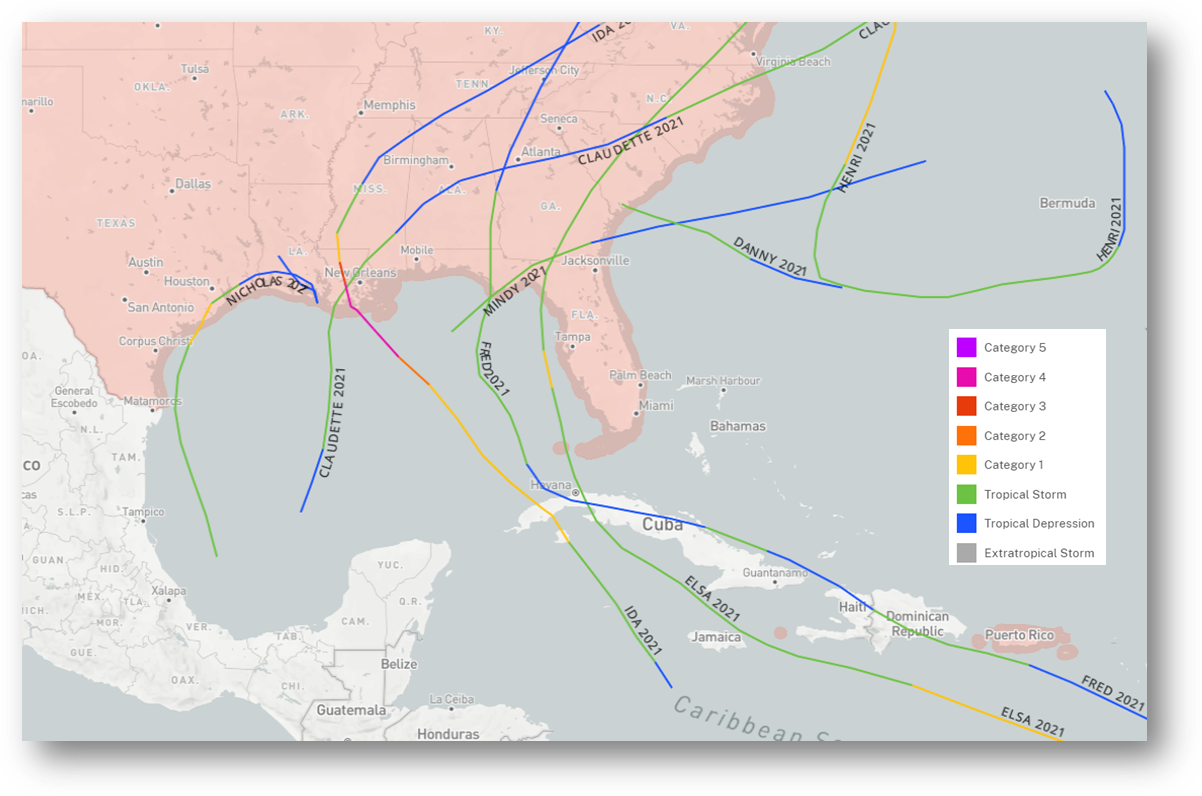
This NOAA tool allows you to track any historical storm:
https://oceanservice.noaa.gov/news/historical-hurricanes/
NatGas Storage Fundamentals:
The EIA reported a +80 Bcf injection for the week ending May 20th, which came in much lower than market estimates. The general range of expectation was +86 Bcf to +89 Bcf. This storage report takes the total level to 1812 Bcf, which is 387 Bcf less than last year at this time and 327 Bcf below the five-year average of 1,955 Bcf.
All the regions looked relatively fair to us, except the SC this week which reported +16 Bcf injection (+0 Salt/+15 Non-salt). This is the 2nd week in a row that we get some funny math from the EIA.
I inquired with an analyst at the EIA about the math last week, and this is what I was told in a nutshell.
First, the EIA estimates each region’s inventory level individually from their models that take in data from storage operators weekly. Second, the modeled result is rounded. Third, the week-on-week difference is taken by region. Remember they “round first, WoW difference next”.
(yes if you do it in the opposite order, you can get a different result).
Also note, in past conversations with the EIA they have mentioned a very HIGH weekly storage change sample from participants.
After a very loose April, the past reports have been tight to Q2 2021. This last week’s number was significantly tighter wx adjusted. We calculate last week’s report to be -1.7 Bcf/d tight vs Q2 2021 as seen in the chart below.
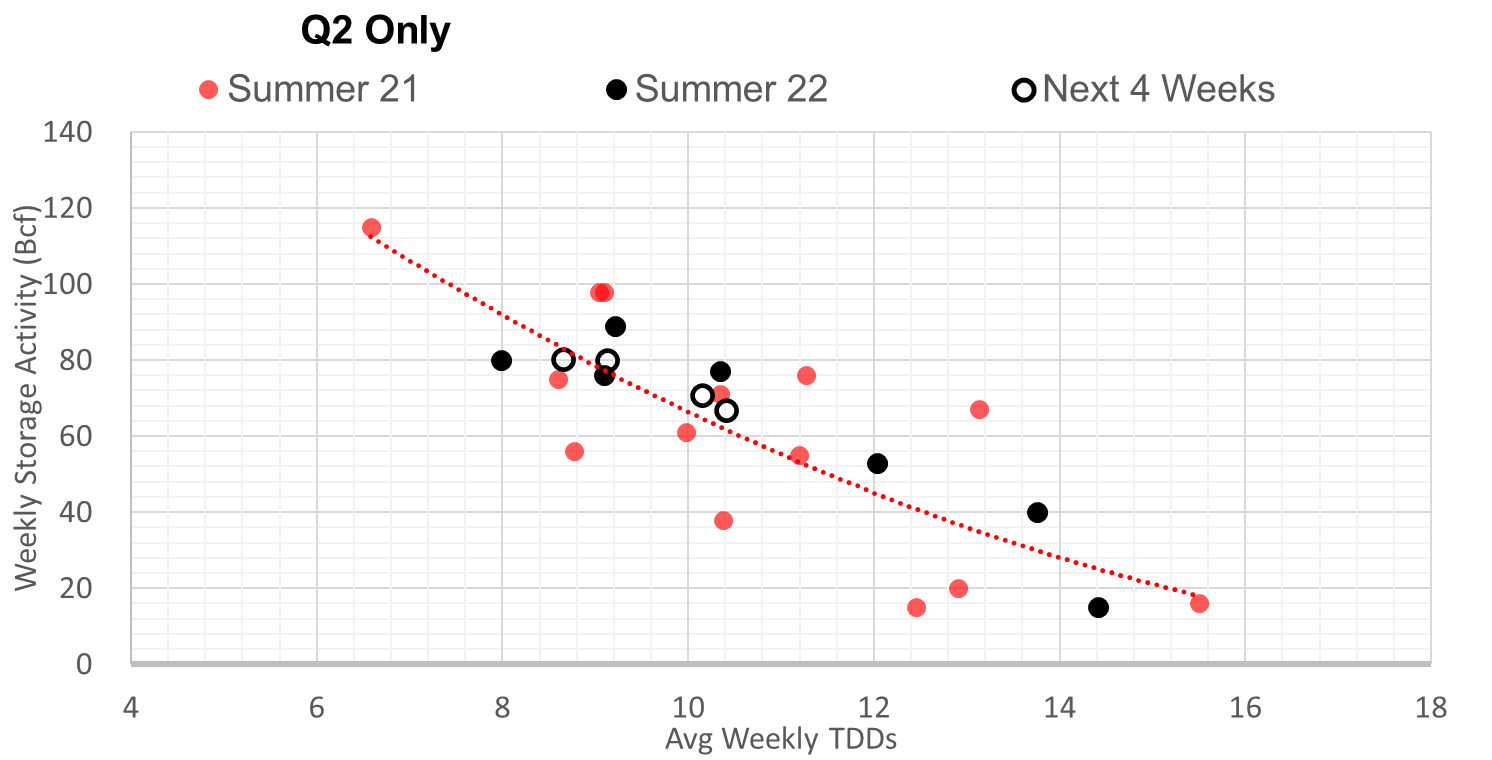
So we question what led to the extremely tight number. This week it was a combination of tightening from the supply side, and potentially under-estimating the level of power burns in the South. From the supply side, we saw a drop in domestic production (with various pipeline maintenance issues) and a drop in Canadian imports (due to maintenance on Northern Borders pipeline and T-South). Canadian imports had been quite strong lately.
On the gas consumption side, national GWHDDs decreased by 4.2F relative to the previous week, and CDDs picked up by 2.6F. The CDDs particularly picked up in the ERCOT power market as temps mimicked peak summer levels.
This temp at the national level was a relatively flat week on week, but the intensity of heat over Texas and a drop in wind led to the strong burns.
For the week ending May 20th, our early view is +78 Bcf. This reporting period will take L48 storage level to 1,890 Bcf (-409 vs LY, -349 vs. 5Yr). This estimate comes from our S/D model. We should note that this model has been on the high side by 1+ Bcf/d.
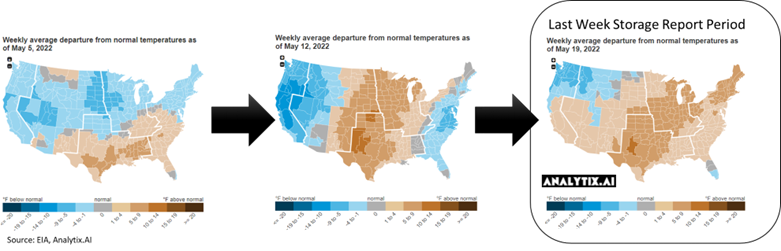
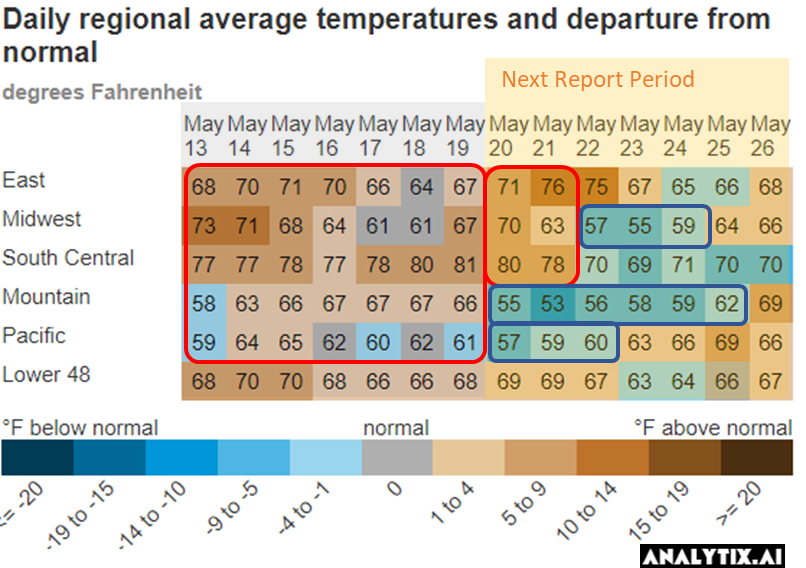
After an early start to the summer for the first 2 weeks of May, we saw the South Central to the Midwest return to more normal levels. The net result was the L48 GWHDD increasing by 0.9F relative to the previous week and population wt. CDDs stayed relatively flat with heat moving from the South to the West. May is typically that transition month where HDDs and CDDs are quite balanced.
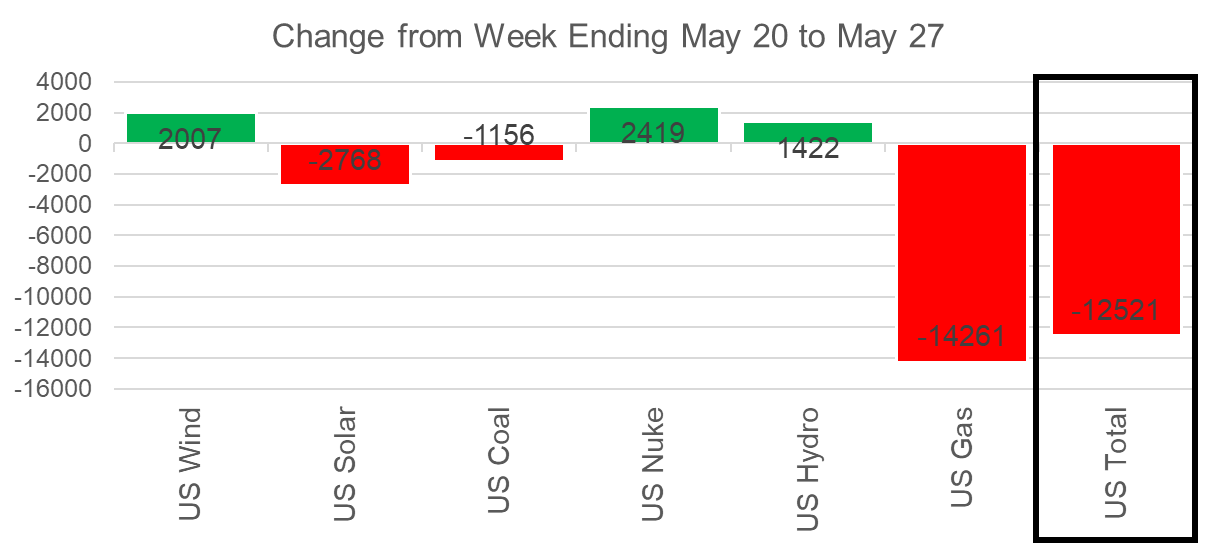
Overall, the power load was much lower week-on-week with more normal weather returning to the ERCOT region. With gas typically the marginal producing unit, we see the drop in natgas gen in line with total power loads. This chart is interesting, and it goes to show that coal generation is only running the baseload levels regardless of power load or price level. Seeing this, we continue to believe this is likely going to be a choppy summer with no flex left in the gas markets.
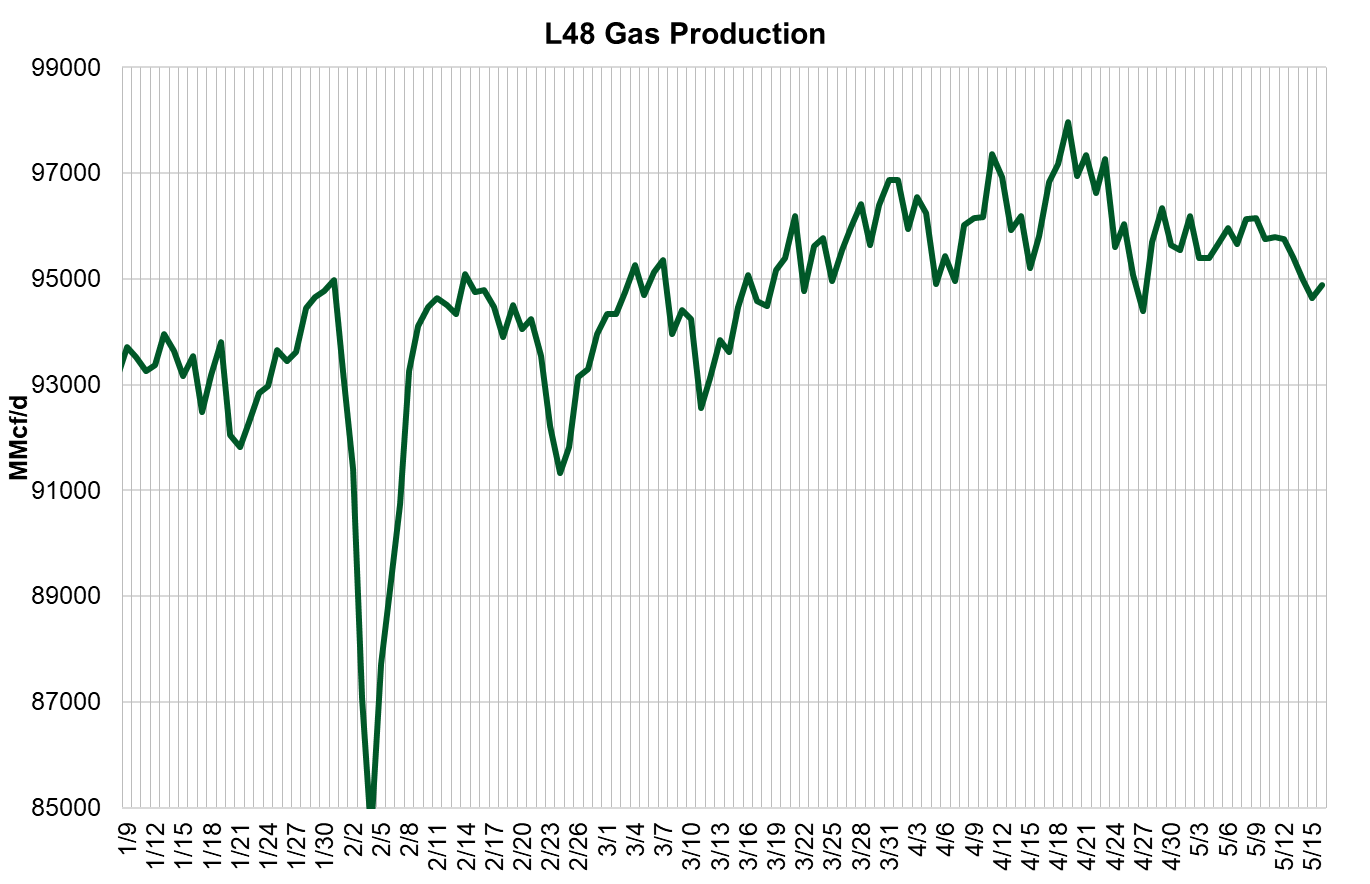
Domestic dry gas production was higher by 1.0 Bcf/d WoW. The big change came as a result of pipe maintenance completion in the Midcon and West Texas.
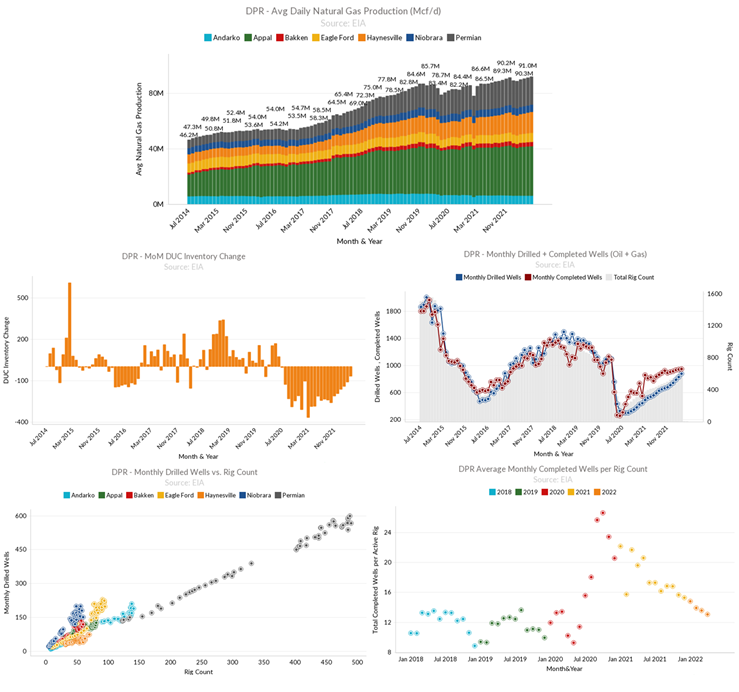
The DPR report was also released on May 16th. The EIA is still optimistic that production will grow from May to June. They show the 7 shale regions adding 0.75 Bcf to get to a total of 91.75 Bcf/d. The Haynesville is set to lead growth, adding 239 MMcf/d to reach 15.1 Bcf/d, while Appalachian production is set to grow 194 MMcf/d month-on-month to 35.670 Bcf/d. The oily Eagle Ford and Permian are expected to post natural gas production gains of 131 MMcf/d and 169 MMcf/d.
Here are 5 key charts from our interactive EIA DPR dashboard that lets you filter all the charts by region and report dates. If you want access to it, just drop me an email @ het@analytix.ai
Deliveries to LNG facilities averaged 13.0 Bcf/d last week, which is much higher than last week. Cameron completed its 3-week maintenance on Train 1 to start this past week, and Corpus Christie also was fully available.
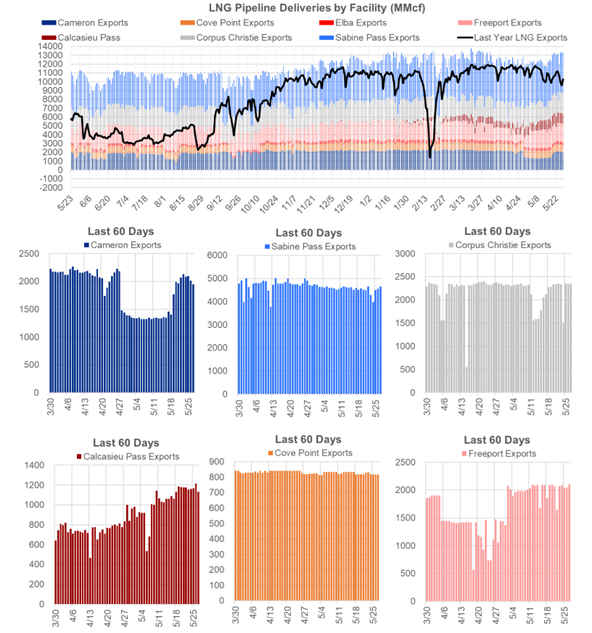
The net balance was -0.9 Bcf/d tighter week-on-week.
This email, any information contained herein and any files transmitted with it (collectively, the Material) are the sole property of OTC Global Holdings LP and its affiliates (OTCGH); are confidential, may be legally privileged and are intended solely for the use of the individual or entity to whom they are addressed. Unauthorized disclosure, copying or distribution of the Material, is strictly prohibited and the recipient shall not redistribute the Material in any form to a third party. Please notify the sender immediately by email if you have received this email by mistake, delete this email from your system and destroy any hard copies. OTCGH waives no privilege or confidentiality due to any mistaken transmission of this email.