On May 17, ERCOT and the Public Utility Commission of Texas spoke to the public about whether the Texas power grid is ready for the summer heat. They said they are ready but will operate with an abundance of caution to keep the grid reliable.
Texas is the only state with its own, isolated power grid (The Lonestar state). That means when extreme weather or other circumstances take out in-state generation, Texas cannot easily borrow from other power jurisdictions. Adding to that we have to note that the Texas power market is also “energy-only,” meaning generation companies are not rewarded to produce backup power.
To ensure they do not run into any issues, ERCOT asked power plants to delay maintenance and sent notices to the public urging them to conserve energy. This was especially important after six power plants tripped on May 13th. The power plant failures led to a loss of about 2,900 MW, but all did return last weekend. ERCOT did not disclose which power plants had shut down, nor did they give the reason for the failures. It is highly likely to be heat-related. At least one of the six generators that unexpectedly went offline Friday, a plant owned by Calpine, had been told by ERCOT to delay scheduled repairs and keep operating because of high power demand.
So let’s look at how ERCOT weathered the heat this past week from the EIA930 data and regional daily weather. Here are a series of charts that help explain what’s going on.
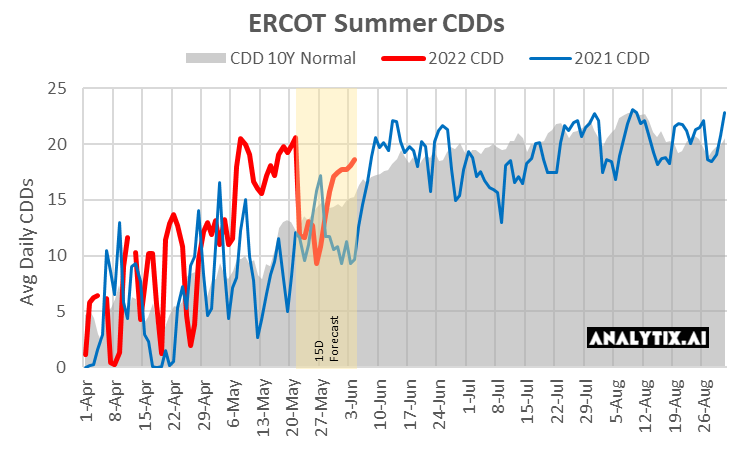
First, we start with current daily summer CDDs vs last year and the 10Y normal. As clearly seen, temps in May have been quite extreme. The level of temps we experienced the last two weeks are similar to the levels typically seen in late June to mid-July.
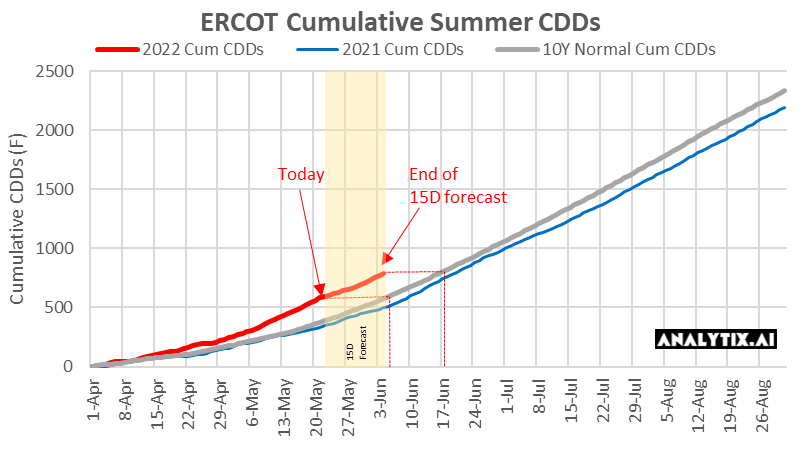
With the recent extreme heat, the total season CDD count by today and the end of the 15D forecast window are 2 weeks ahead of schedule for the summer. [Grey line is the 10Y normal]
Now finally, let’s look at the relationship between CDDs and power load historically and focusing in on the last two weeks.
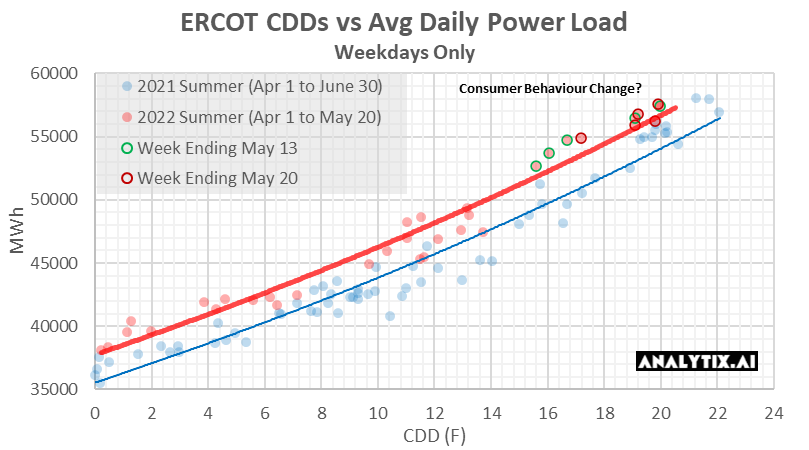
Here are some key observations from the chart below:
1) Temps in the past two weeks are close to levels seen in during peak summer. The chart shows daily average CDDs vs ERCOT power loads for weekdays only. The red dots cover the range of Apr 1 2022 to May 20 2022, and the blue dots cover the range of Apr 1 2021 to July 1 2021.
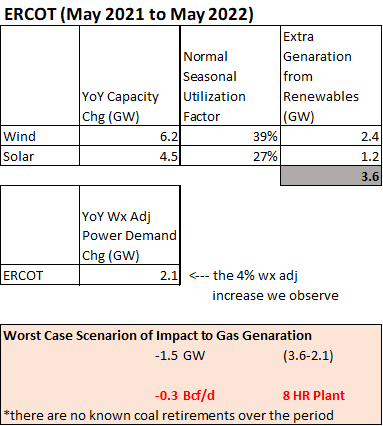
2) ERCOT power loads are ~4% higher YoY, but despite that overall burns should be lower due to the big increase in renewable generation YoY. Here is a quick calc for ERCOT.
3) Retail consumers did not modify their power usage behavior for the 2nd week of extreme heat across Texas. We were expecting demand to be lower last week, as it was only at the start of the 2nd week that the ERCOT asked electricity consumers to keep their thermostats at 78F and avoid using large appliances between 3 and 8pm. With no changes in consumer behavior, power prices hit $4000/MWh, which should hit power bills next month.
Will this preview of peak summer and high power bills and be enough to give Texans the further nudge needed to lower their energy consumption for the peak summer months? Could be Bearish if they do?
Finally, what should we expect for summer temps?
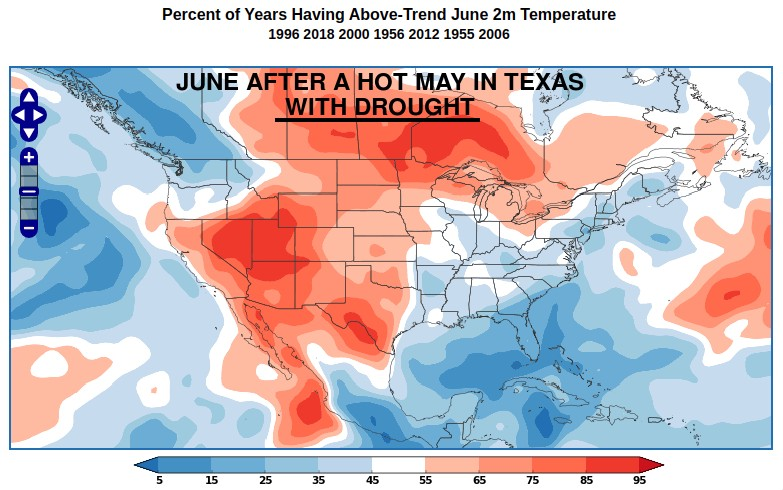
If May temps are a preview for the rest of summer, then we likely are going to have extreme power burns. Not to cause any alarm, but here is how June typically looks after a HOT MAY in Texas with drought conditions according to the Prescient Weather (their service is known as World Climate Service). This comes from a post put on enelyst last Friday.
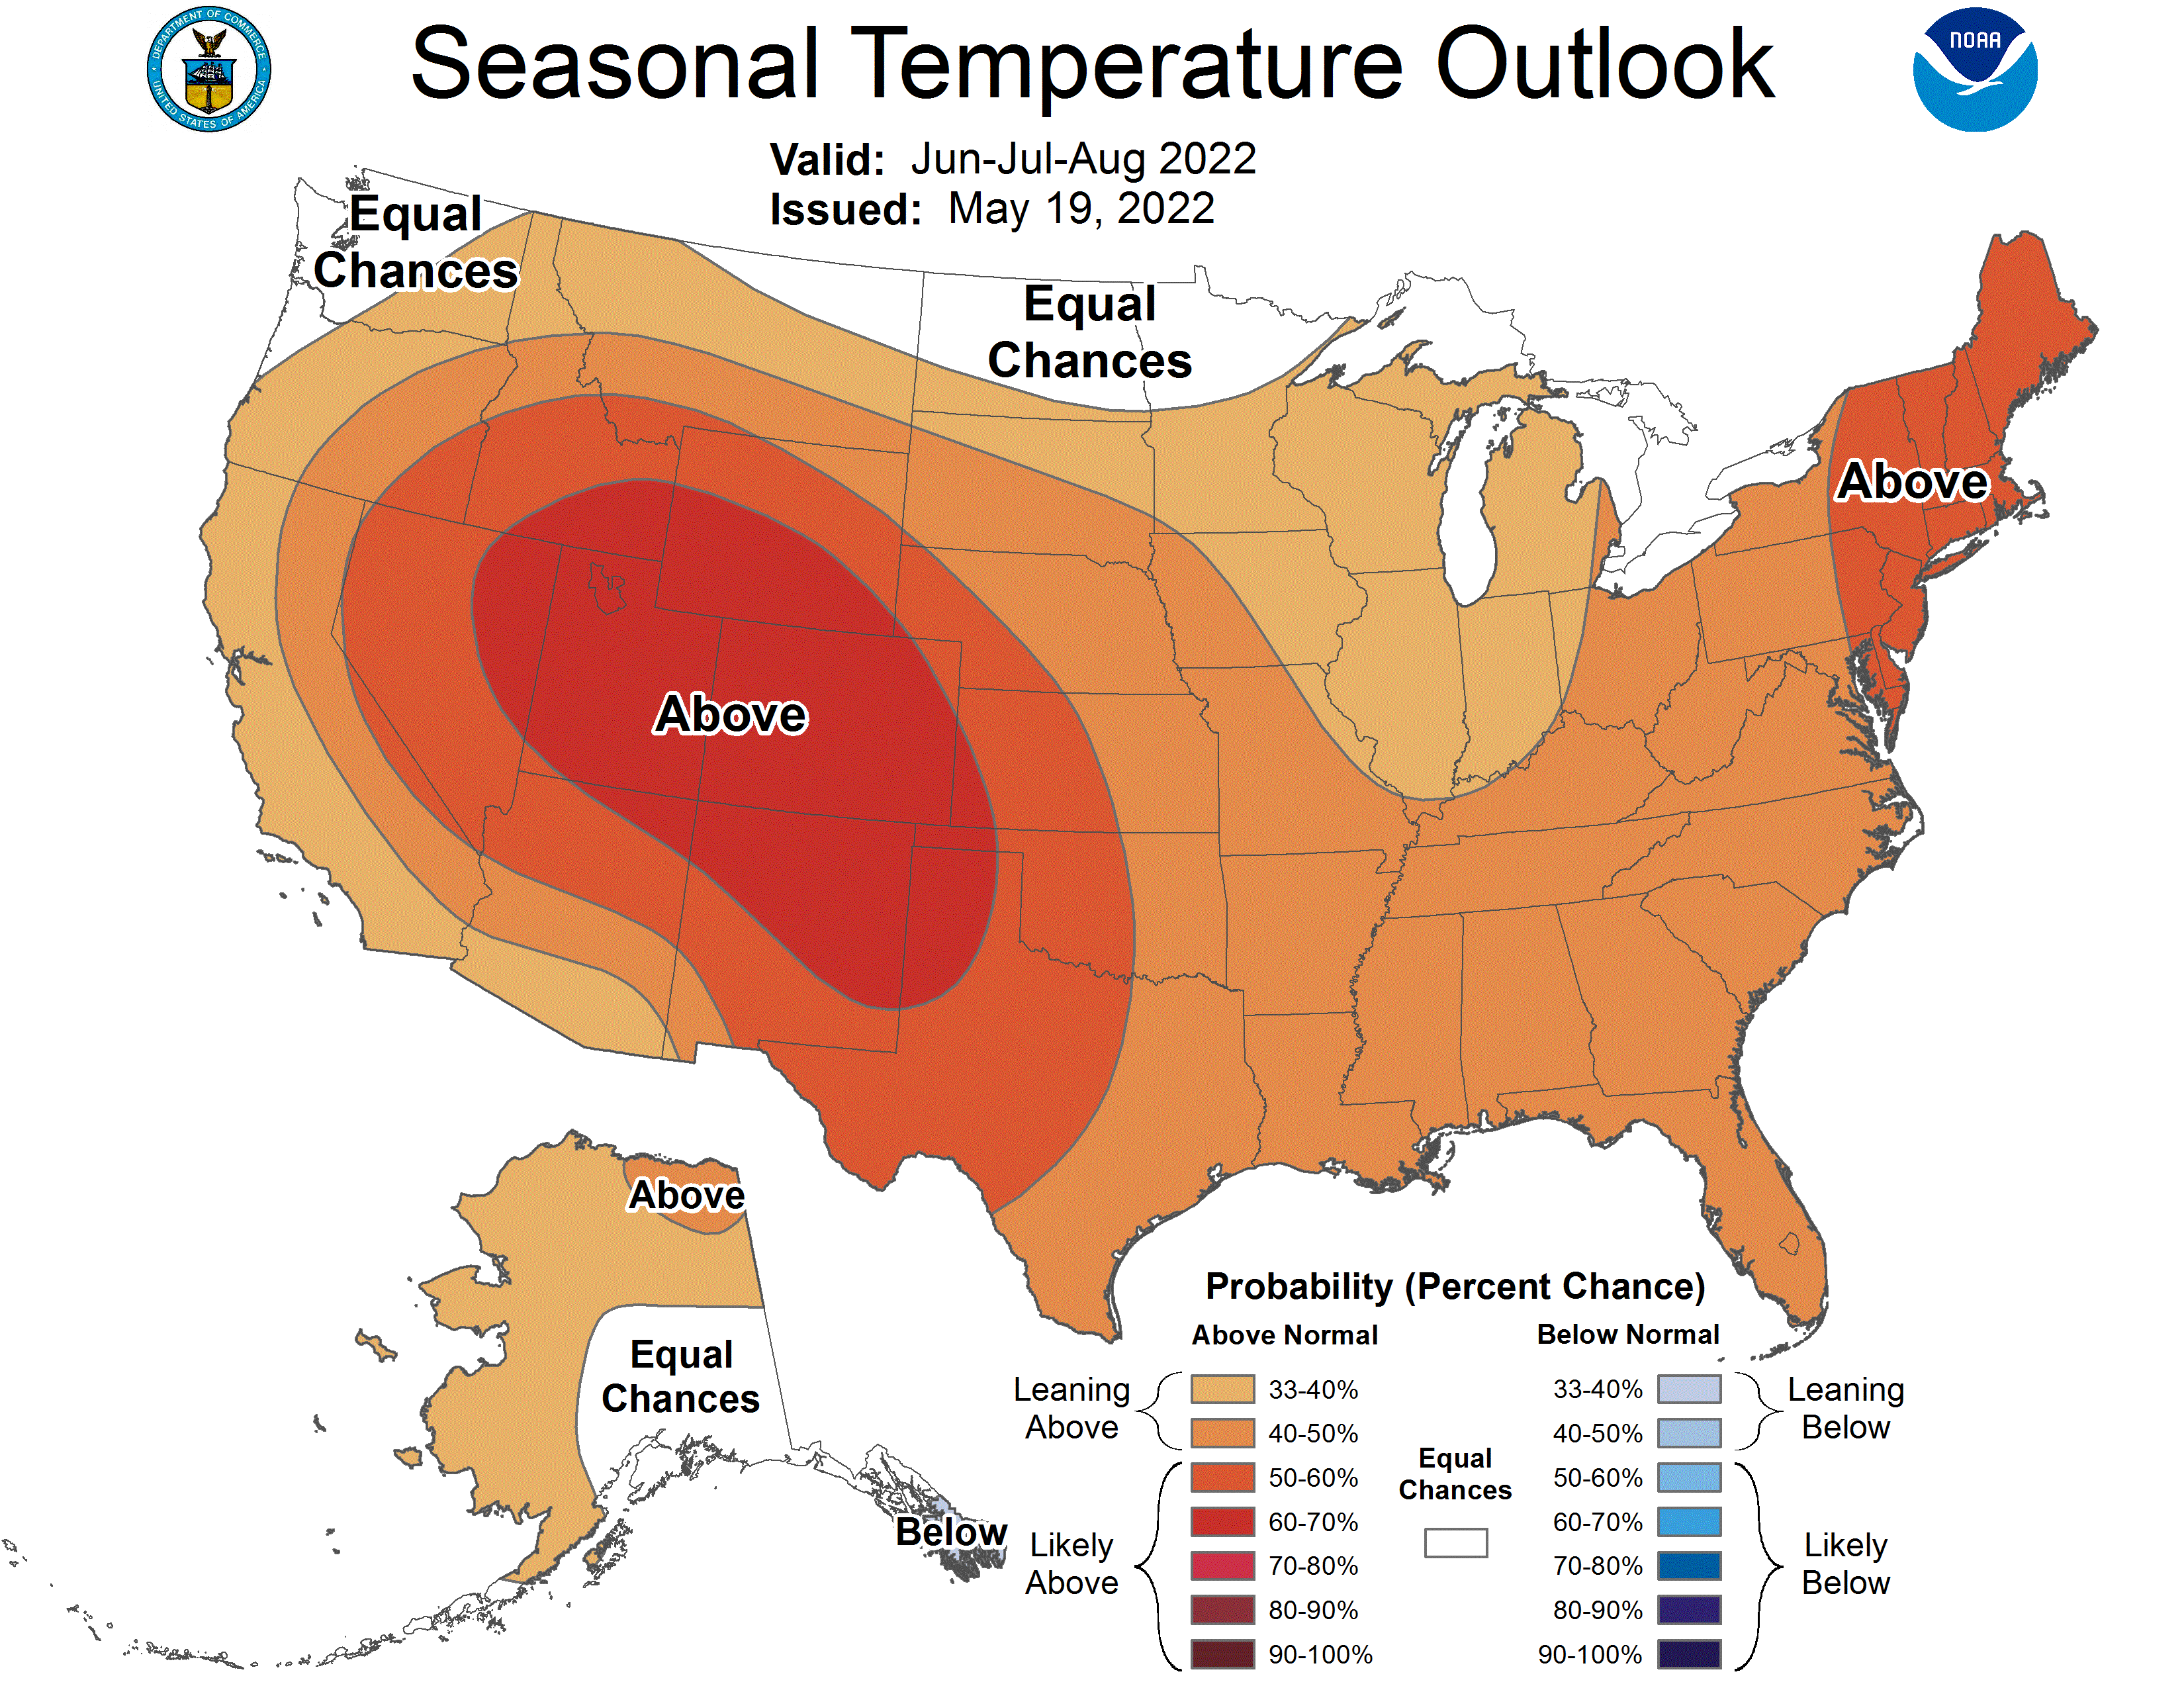
And here is the latest NOAA seasonal outlook:
https://www.cpc.ncep.noaa.gov/products/predictions/long_range/t02.2c.gif
NatGas Storage Fundamentals:
The EIA reported a +89 Bcf injection for the week ending May 6th, which came in right in the expected range. That being said, we dealt with funny EIA math once again this week. The SC components were +10 Salt and +24 Non-Salt yet the total for the region was +32 only. So this week’s number although reported as +89, could very well be +87 Bcf. This storage report takes the total level to 1732 Bcf, which is 358 Bcf less than last year at this time and 310 Bcf below the five-year average of 2,042 Bcf.
The overall number looked fair to us this week, but at the regional level, there were some discrepancies. SC once again should have stronger injections than expected, while the Midwest and East came in lighter by about 2 Bcf per region. We continue to believe that major vendors are missing Texas production. SC storage numbers for the week ending May 15th were light, and that seems to coincide with Permian Highway Pipeline (PHP) conducting the heaviest part of its 11-day maintenance. Between May 3-6 approximately 0.9 Bcf/d of production was potentially shut in due to lower throughput on that pipeline. The maintenance is now complete, and we expect to see continued looser storage estimates in next week’s report.
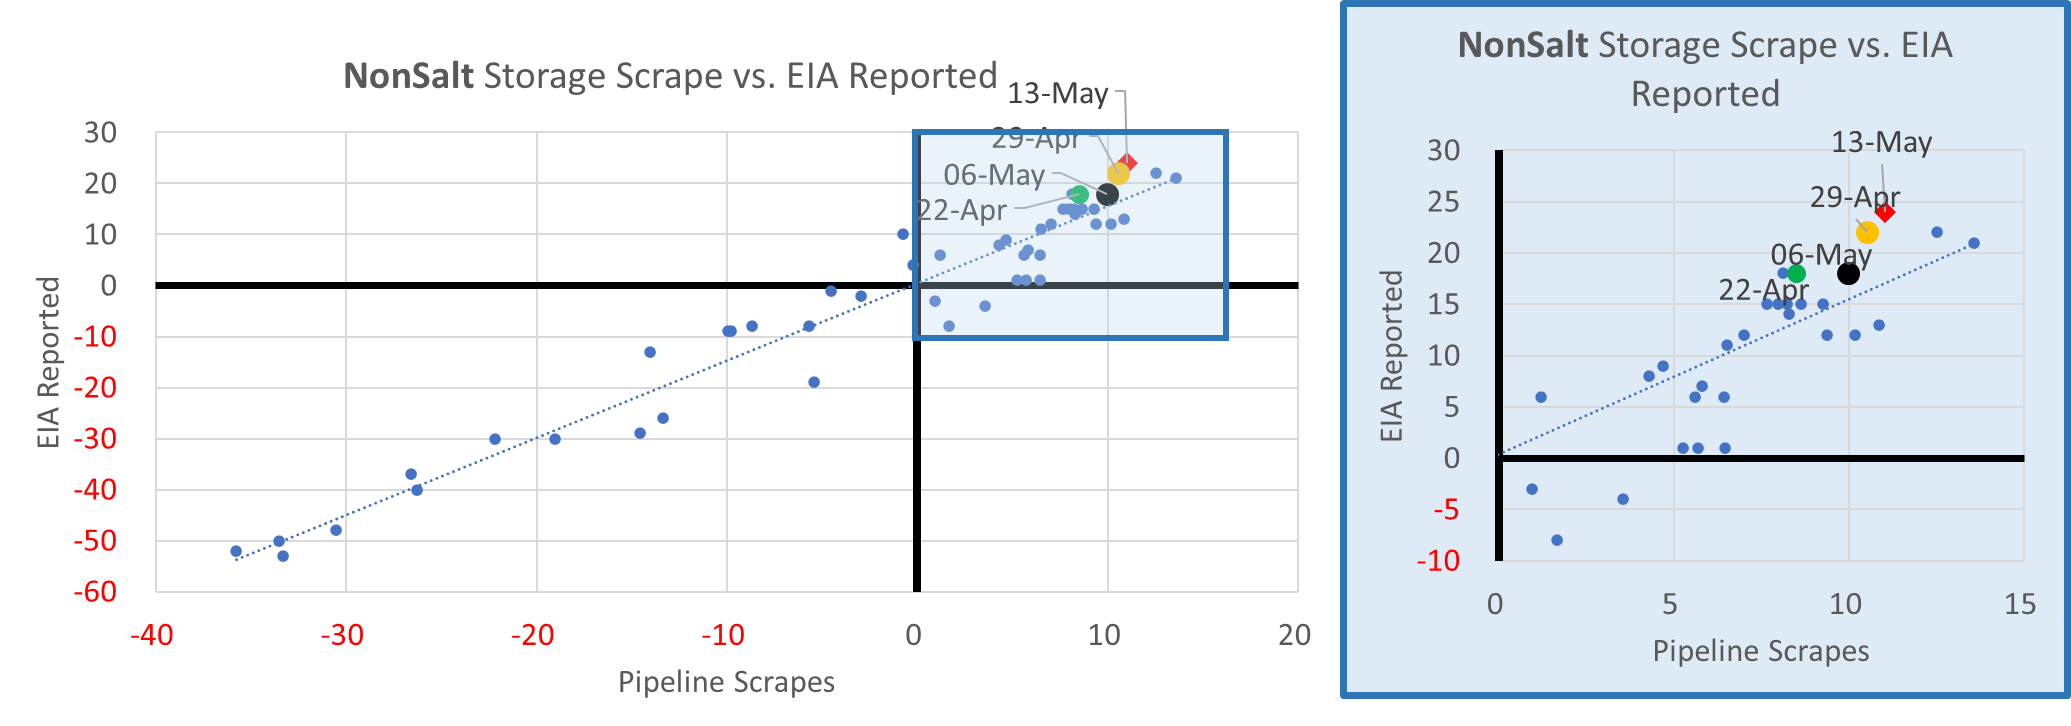
Here is a view of our Non-Salt flow model which shows reported injections coming in much higher than flow estimates in the SC (except for week ending May 6 when PHP was conducting maintenance). There is a good chance we continue to see strong SC injections this summer – which will lead to more bearish storage reports.
Once again (after a brief pause in the report for week ending May 6th), we estimate this +89Bcf injection was loose to last summer (wx adjusted). We compare this report to Q2 2021, we see it 1.8 Bcf/d loose YoY wx adjusted.

At the L48 level, GWHDD decreased by 0.7F relative to the previous week, and CDD slightly picked up by 0.8F; resulting in a 2.2 Bcf/d decrease in natural gas consumption. This helped direct more natgas to storage facilities relative to the previous reported week.
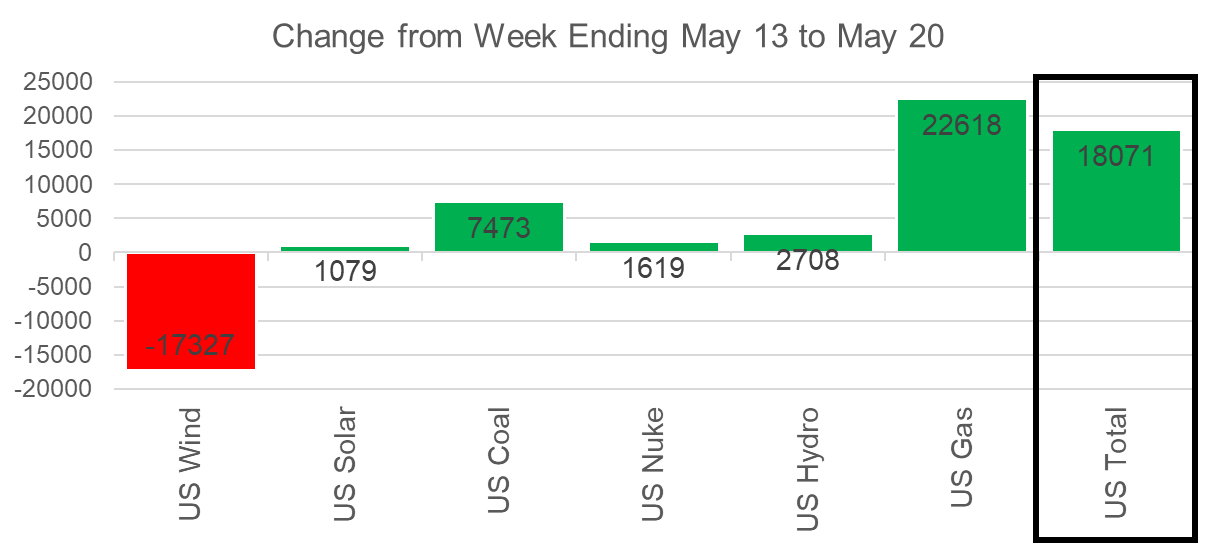
The warmer temp along with structural higher power loads led to higher power burns. If it was not for the week-on-week increase in wind generation (+7.7GWh), the burns would have been even higher.
For the week ending May 20th, our early view is +91 Bcf. This reporting period will take L48 storage level to 1,823 Bcf (-376 vs LY, -316 vs. 5Yr)
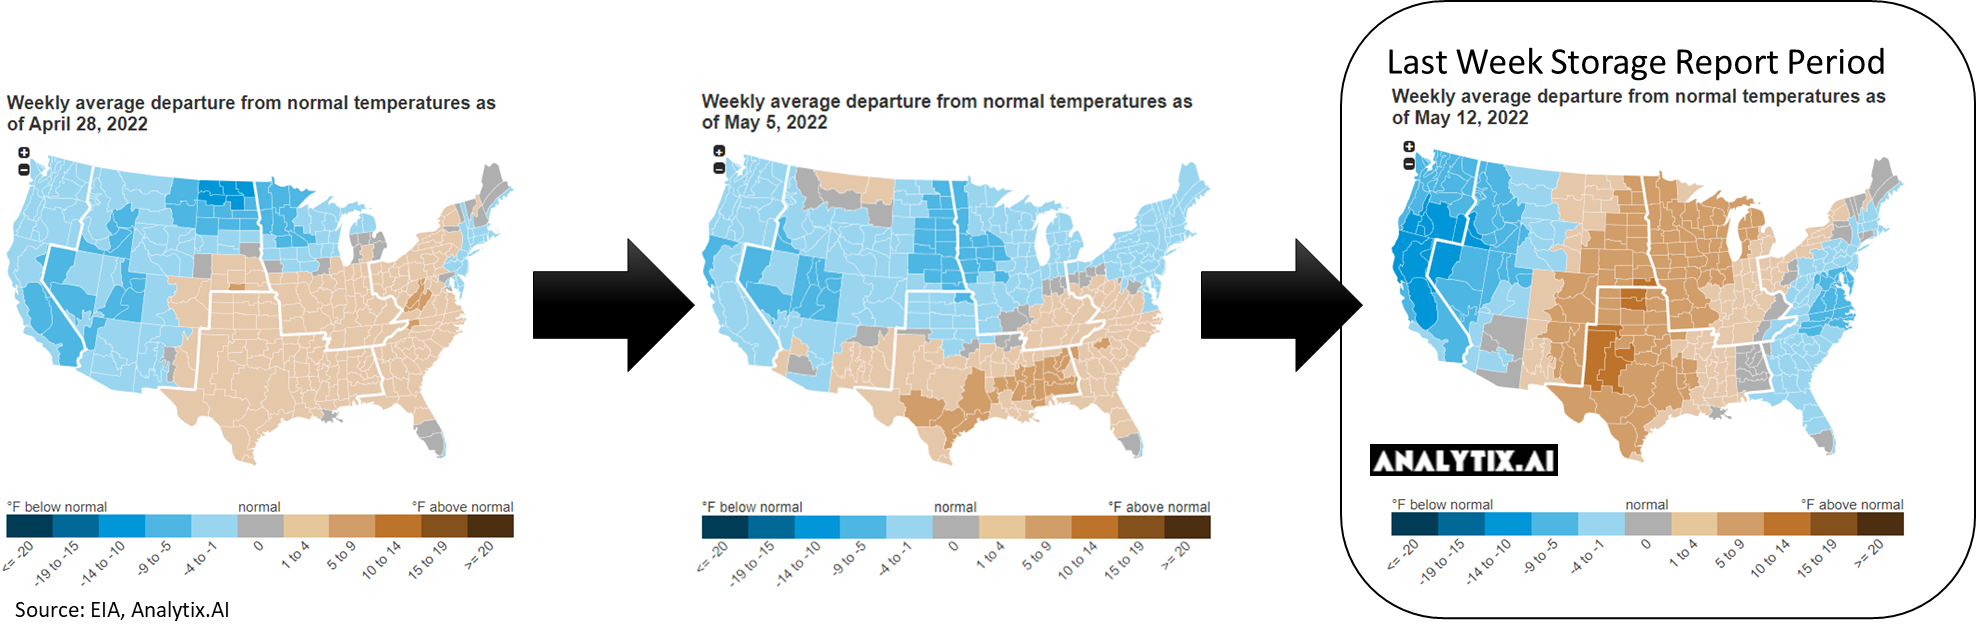
Once again this past week we saw record temps in the South, particularly the ERCOT region as we noted above. The net result was the L48 GWHDD decreasing by 4.2F relative to the previous week and population wt. CDDs increasing by 2.6F; resulting in a 1.3 Bcf/d decrease in natural gas consumption with RC consumption hitting the annual low.
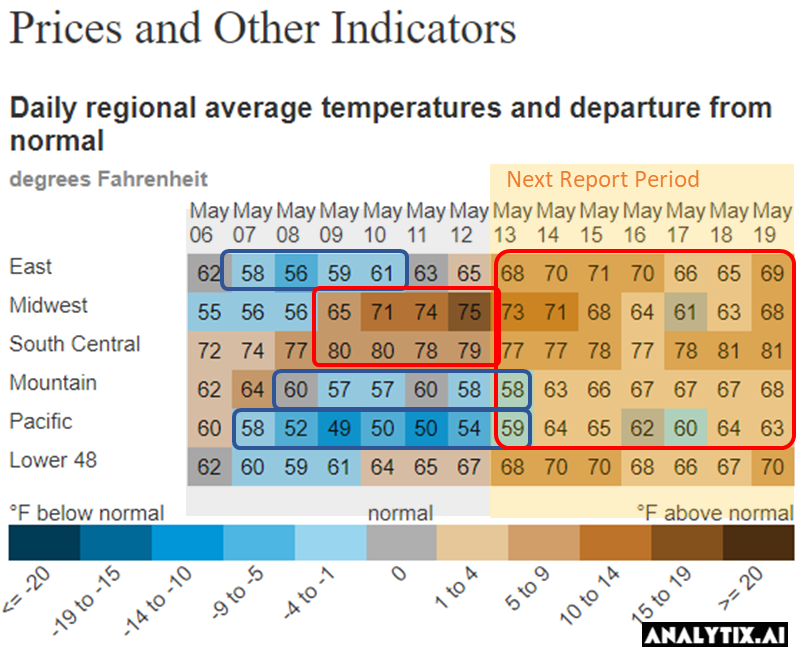
Overall, the power load was much higher week-on-week with the increased heat in all regions, but mainly the Southern regions. And unlike the past few weeks, the wind dropped off significantly with the heat leading to a big jump in gas burns.
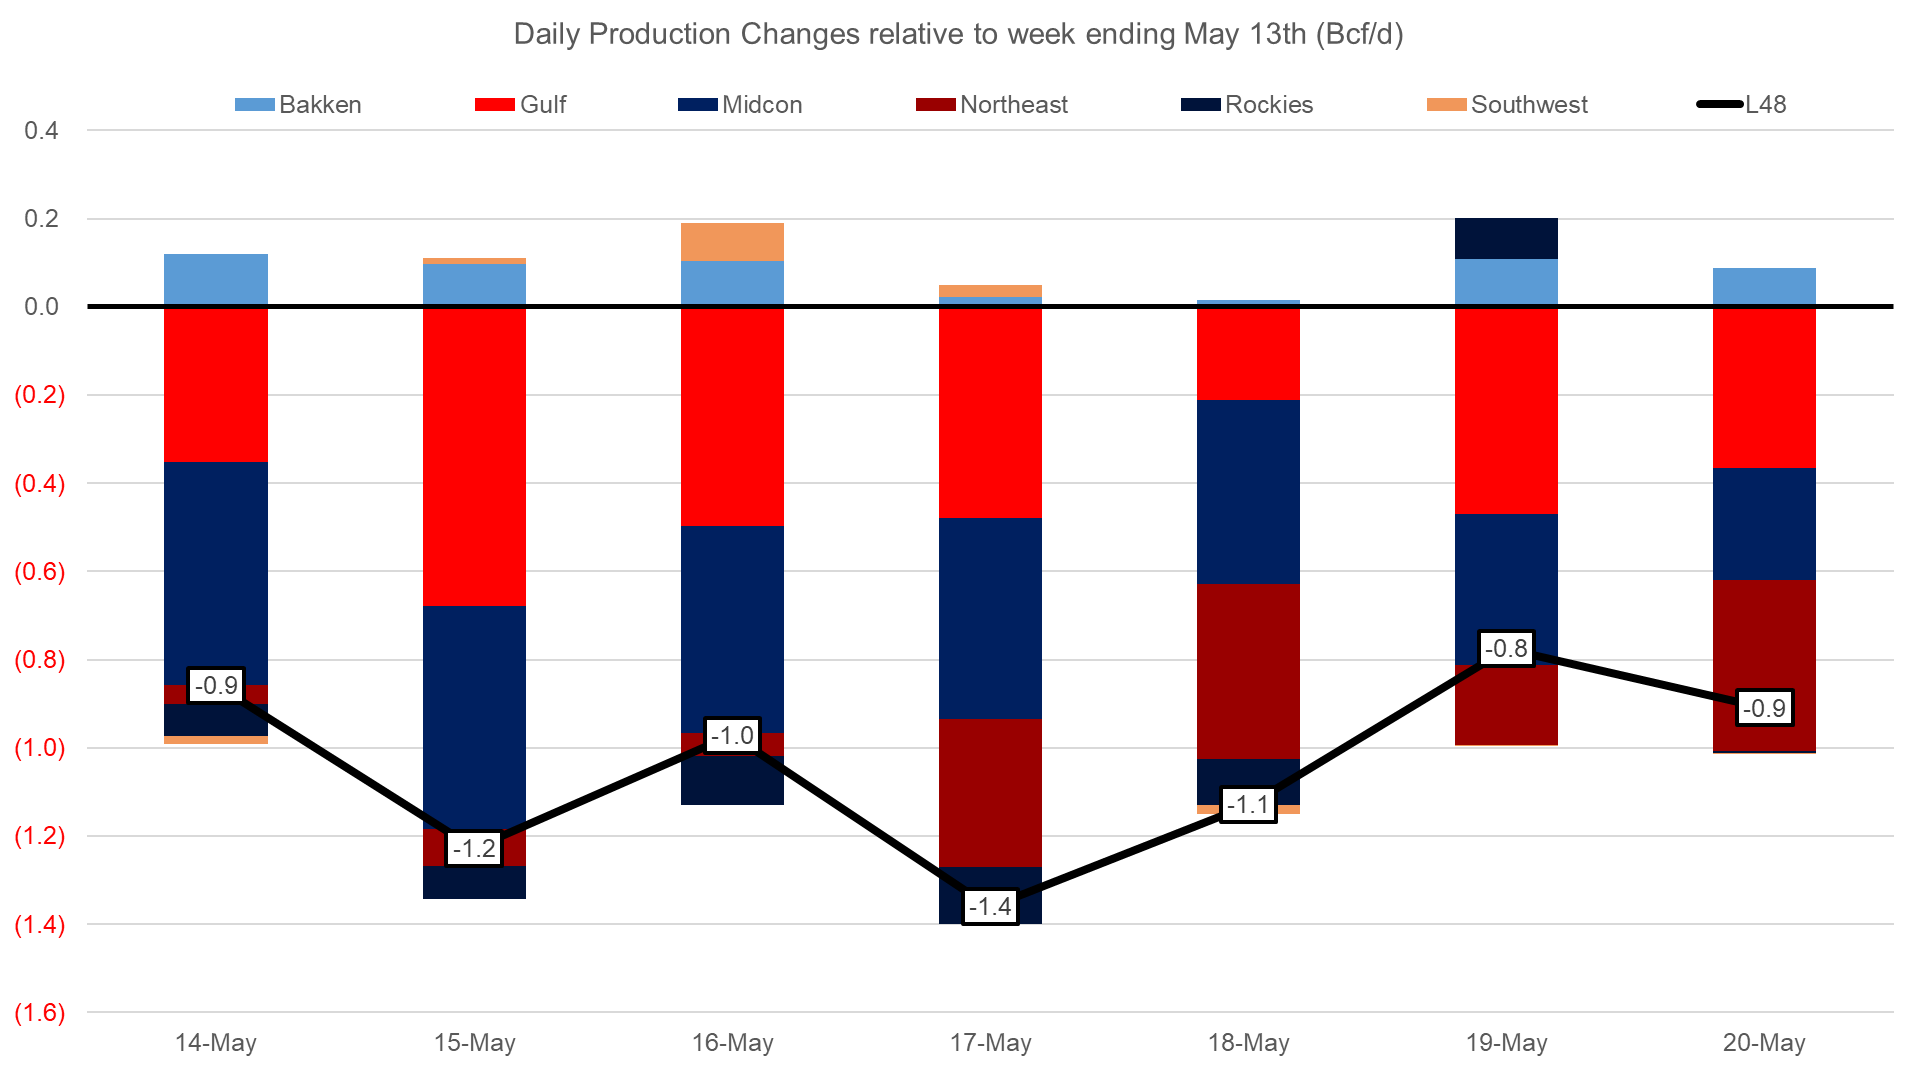
Domestic dry gas production was off by 1.0 Bcf/d WoW. The drop came from multiple regions as various pipeline maintenance projects continue to inhibit pipeline flows. Here is a look at which regions saw big changes in production this week.
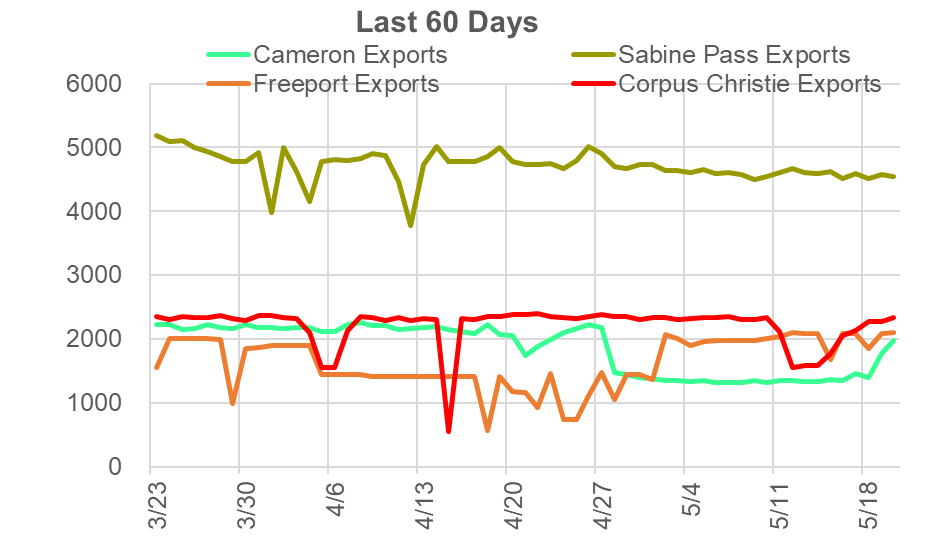
Deliveries to LNG facilities averaged 12.2 Bcf/d last week, which is flat with the previous week. That being said, we started the week at 11.8 Bcf/d of deliveries and ended the week at above 13 Bcf/d. The return of Cameron from its 3-week maintenance on Train 1, and the return of Corpus Christie got flows to LNG plants back up to these higher levels. Additionally, we saw Calcasieu Pass jump to 1.2 Bcf/d at the tail end of the week.
The net balance was +0.2 Bcf/d looser week-on-week.
This email, any information contained herein and any files transmitted with it (collectively, the Material) are the sole property of OTC Global Holdings LP and its affiliates (OTCGH); are confidential, may be legally privileged and are intended solely for the use of the individual or entity to whom they are addressed. Unauthorized disclosure, copying or distribution of the Material, is strictly prohibited and the recipient shall not redistribute the Material in any form to a third party. Please notify the sender immediately by email if you have received this email by mistake, delete this email from your system and destroy any hard copies. OTCGH waives no privilege or confidentiality due to any mistaken transmission of this email.