This weekend’s commentary comes from Brian Lovern at Bespoke Weather. Each month Brian Lovern will provide us with the latest medium-term outlook to provide more depth to our season outlook. If you have more questions, please contact Brian @ brian@bespokeweather.com.
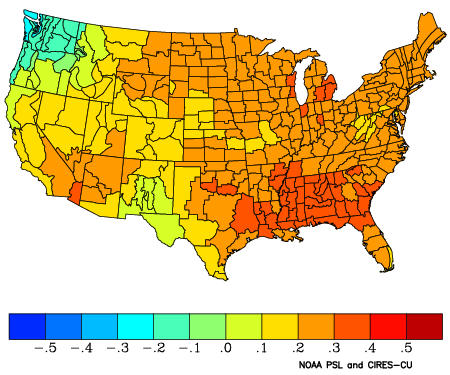
Our expectation is for another hotter summer this year, based on a La Niña-ish tilt in the atmospheric base state, and the fact that we are in a warmer climate regime, as summers have tended to run hot for several years now, regardless of the ENSO (El Niño / La Niña) state. All else being equal, however, La Niña does tend to enhance summer heat, as we see when looking at the correlation between La Niña and summer temperatures over the last 40 years.
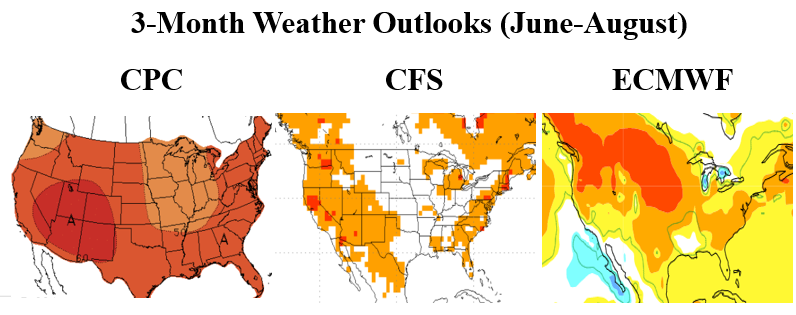
La Niña’s Correlation With Summer (June-August) Temperatures
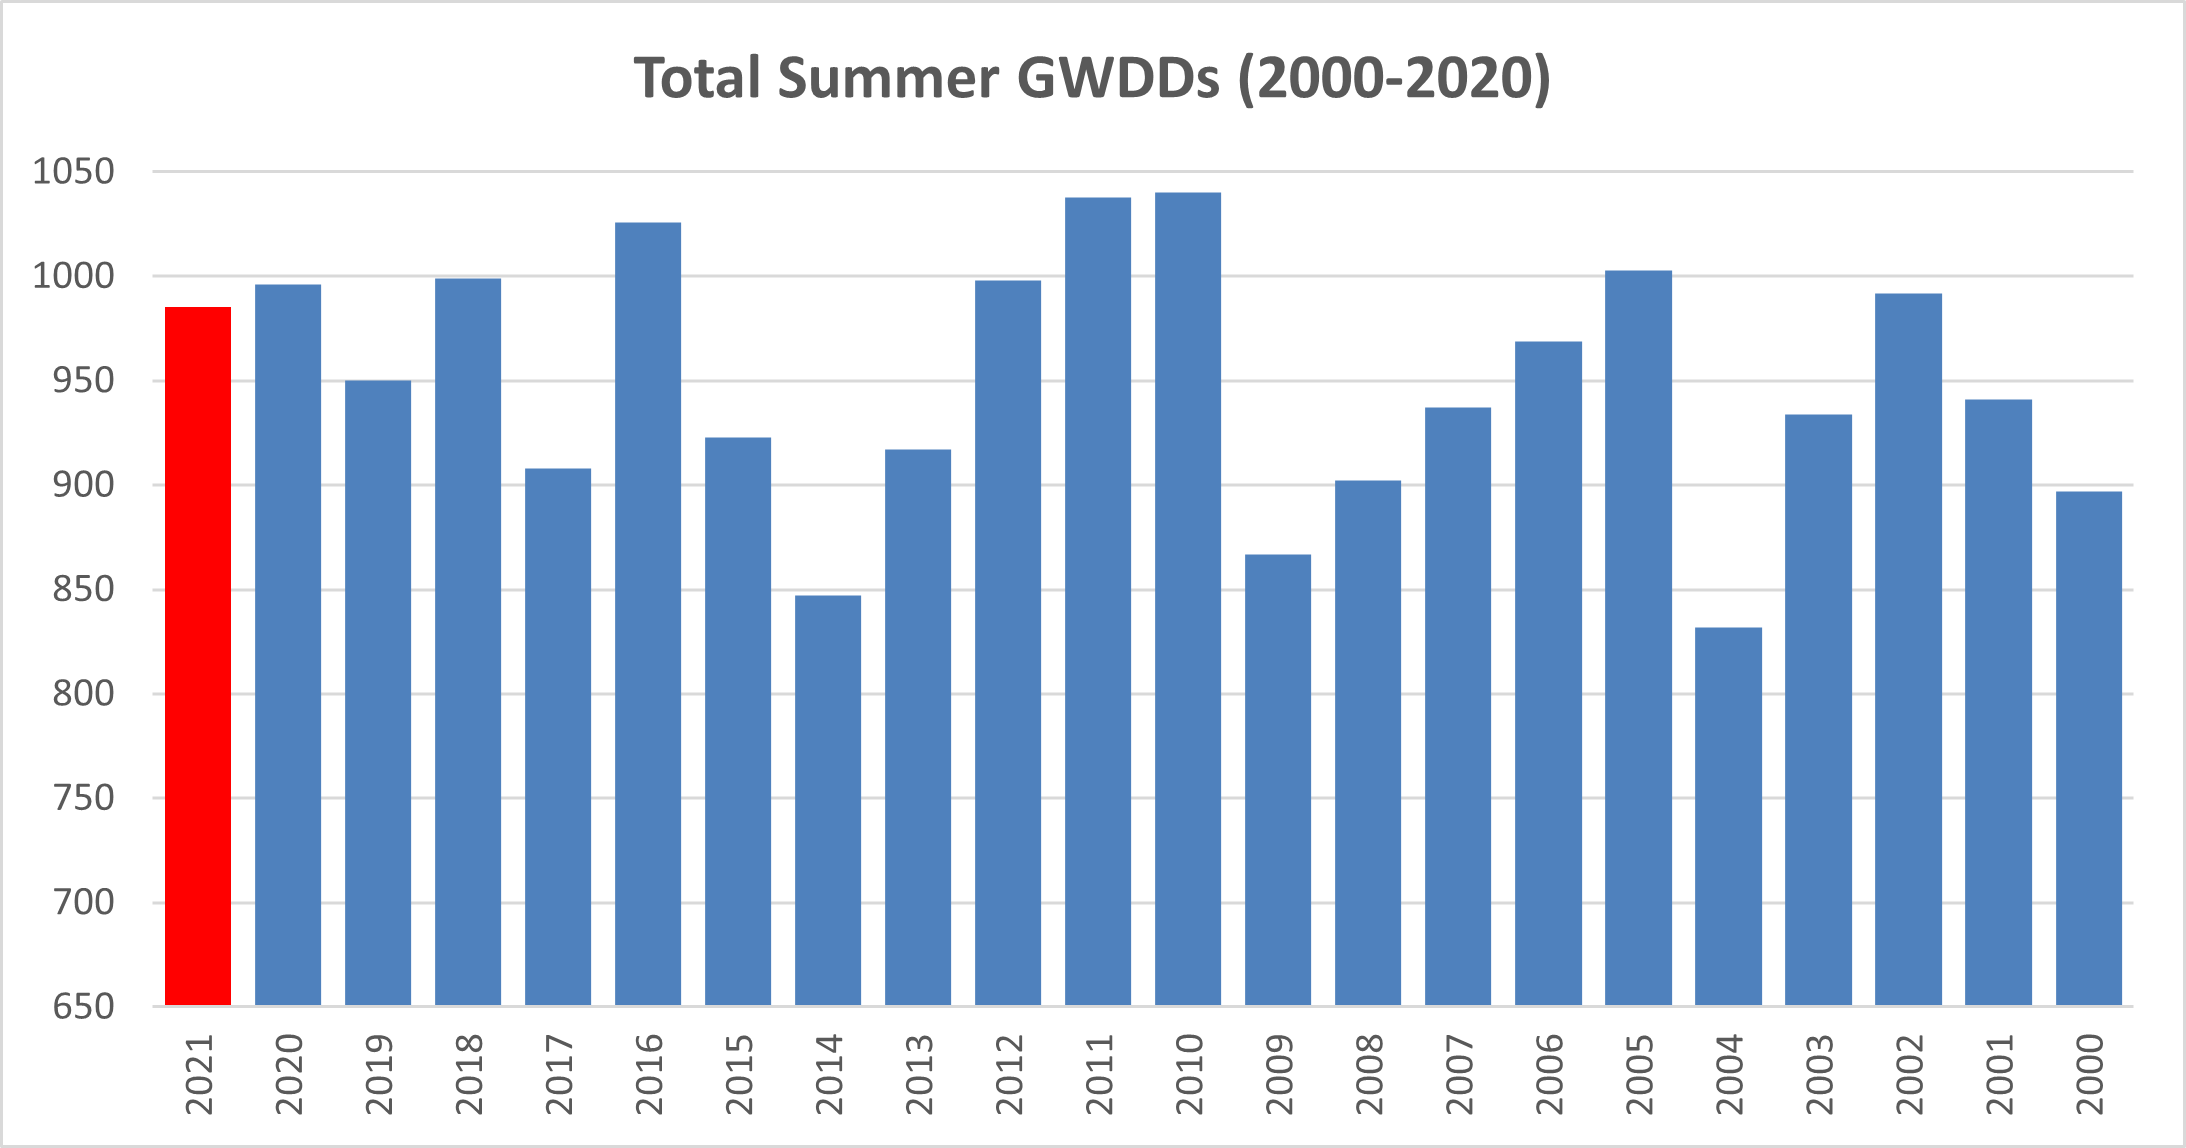
There are some important considerations, however, one being that, due to the flurry of hotter summers in recent years, a 10-year normal summer (which most folks use as a base case in the natural gas market) would already rank around 7th hottest on record, in terms of Gas-Weighted Degree Days (GWDDs), so the bar is already set quite high in that regard. That being said, our current estimate still lies a little hotter than the 10-year normal, but not quite as hot as last summer, and well short of the hottest summers on record from 2010, 2011, and 2016, with an initial estimate of 985 GWDDs from June to August.
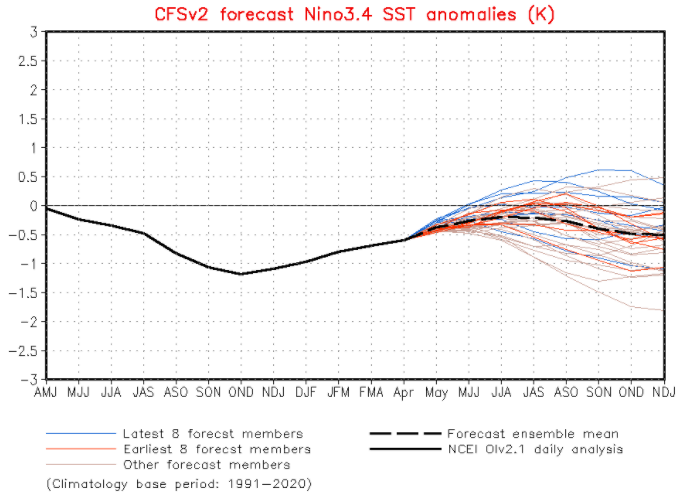
We are seeing some potential risks to the hotter view, however, as the La Niña state has been a no-show in the current pattern, and there are some hints that could linger into Summer. The CFS, for example, projects ENSO region 3.4 anomalies to be close to neutral as we move forward.
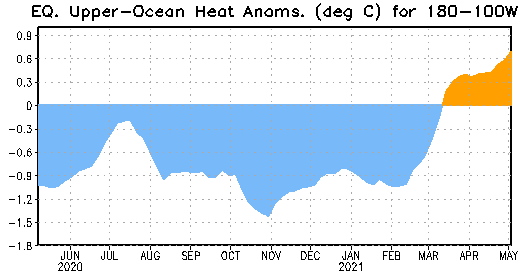
Upper oceanic heat content in the equatorial Pacific has been trending higher as well, something not consistent with a predominant La Niña base state.
Now, the failure of the La Niña state does not mean it cannot still be hot (see 2018), but it typically does at least take some of the top-end risks off the table, so this will be watched closely in the coming weeks. For now, as things can still change, we stick with a hotter view, but acknowledge the risks outlined above.
Fundamentals for the week ending May 14: This past week the EIA reported a +71 Bcf storage injection for the week ending May 7th, with implied flows of +75 Bcf due to a reclass of last week’s non-salt number. The reclassification of 4 Bcf of working gas to base gas resulted in a decrease in the non-salt storage figure. We are not sure which specific facilities this is for. This past week’s report shows natural gas balances being less tight than the last few weeks at 4-5 Bcf/d tighter YoY (wx adj).
For reference, we had only two reclasses this year and only 7 since 2018. Attached is a file with all the past reclasses provided from a contact at the EIA.
For the week ending May 6th, our early view is +53 Bcf. The 5Yr average is a +86 Bcf injection. Our projected injection would take the L48 storage level to 2082 Bcf (-409 vs LY, -105 vs. 5Yr).
Domestic production was overall flat week-on-week, with some shifts in the major regions. We saw production return in the Northeast. There were some flow restrictions as part of the Transco Leidy South expansion project (This project is set to come on by the end of the year). Transco finished up the work ahead of schedule this week resulting in production returning to normal levels in the Northeast. The offset comes from West Texas/NM where maintenance on the El Paso system is reducing gas volumes. This maintenance is expected to go on until the end of the month.
Total consumption was higher by +3.1 Bcf/d over the storage week with higher recorded L48 GWHDDs. GWHDDs rose by 3.2 degrees from the previous week, while CDDs dropped by 1.1 degrees. The total net increase in TDDs resulted in ResComm consumption increasing by +4.3 Bcf/d WoW, and power and industrial dropping off slightly.
Deliveries to LNG facilities averaged 11.0 Bcf/d, which was -0.3 Bcf/d lower than the previous week. There have been some big moves in plant feedgas levels this week. Cameron has been lower since May 9th with Sempra confirming maintenance on one train, Freeport dropped for a single day on May 12th by 0.5 Bcf/d due to a power outage from a lightning strike, Sabine was lower on May 13th for a single day by as much as 0.8 Bcf/d. Mexican exports were flat at 6.8 Bcf/d this past week.
Net the balance is tighter by 2.5 Bcf/d week-on-week.
Expiration and rolls: UNG ETF roll starts on May 12th and ends on May 17th.
June futures expire on May 26th, and May options expire on May 25th.