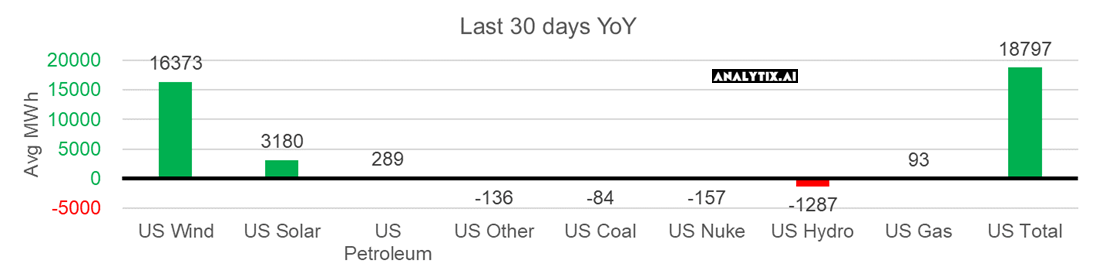
This week we start by focusing on recent power market data to better understand the level of burns this summer. We turn to the EIA 930 data to get more details on how power markets have been functioning this summer so far. Looking at the data, we quickly see that power loads have jumped by ~5% year-on-year. Typically, a gas generator is the marginal producing unit, and therefore a higher load would result in stronger burns. So far this summer this has not been the case. If we look at the generation stats for over the last 30 days relative to last year, the data shows that #wind and #solar growth meet all the excess demand.
Not only has renewable installed capacity jumped year-on-year, but we believe that overall #wind and #solar are performing well ahead of our “expected” levels. The charts below show the average MWh performance each storage week relative to our calculated expected level. We calculate the “expected” level by observing the historical capacity utilization of each asset type and making the necessary adjustments of new capacity based on the EIA-860 data.
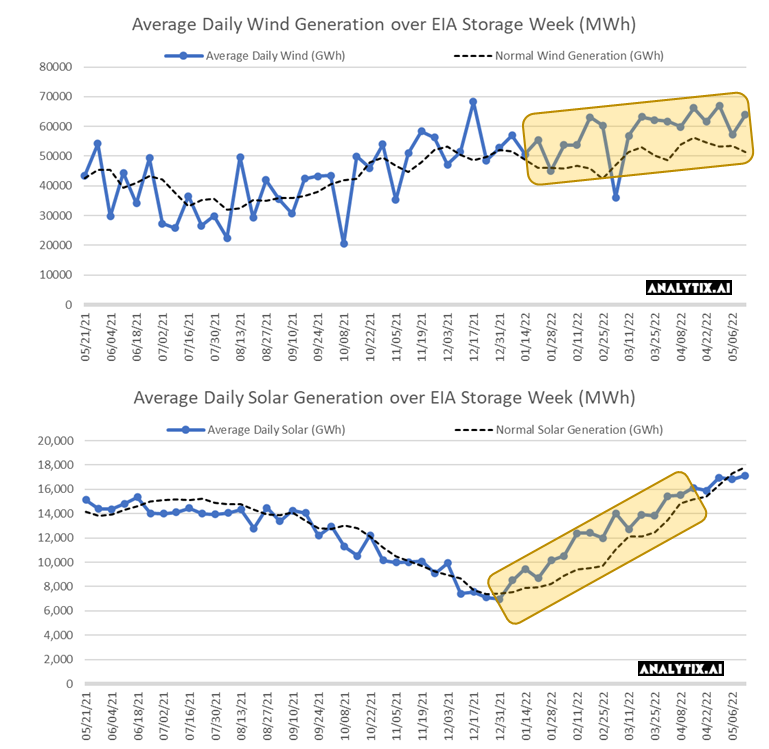
Assuming that both renewable sources displace a 7.5 HR gas plant (which would be higher for peak times), we calculate that just the overperformance of renewables has led to a reduction of 1.7 Bcf/d in gas burns since Jan 1st, and 1.6 Bcf/d since April 1st. So if that increased power load was met by gas gen, then our weekly balances would be much tighter than what we have seen this summer so far.
[Note: Wind Gen is up 27% for the first 6 weeks of summer YoY]
Lastly, we wanted to turn back to a chart we have shown many times in the past. It continues to tell a very interesting story on the coal and natural gas switching dynamics and prices climb to decade highs.
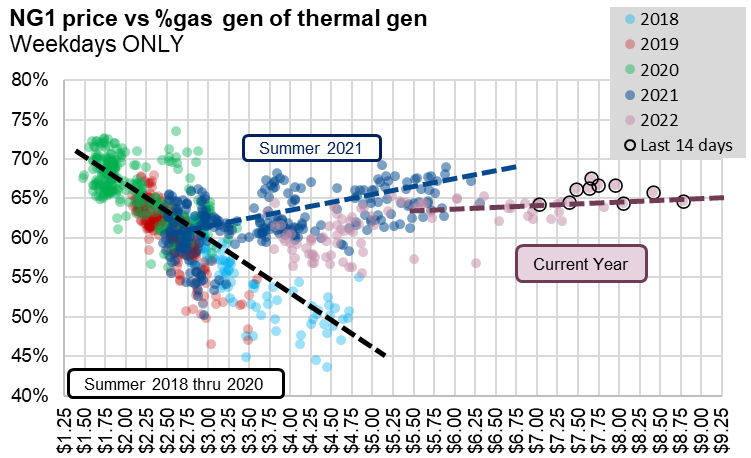
This is not an exact chart of how C2G switching works ISO by ISO, but we get a very clear view that conventionally (before 2020) natgas generation drops as natgas prices increase, i.e. coal becomes the cheaper power source. As of last summer, the dynamic has changed significantly where natgas has consistently held a 60+% market share of thermal generation regardless of how natgas high prices move. In fact, the recent price jumps to almost $9/MMBtu had no real impact on coal generation.
Looking at all this data, we are concerned that we are in for a very volatile summer if heat shows up (remember all forecasts point to heat and drought conditions this summer) and renewables do not show up (i.e. they perform at weak levels similar to last July.
Let me just summarize my thoughts: If the higher power loads are not met by the strong renewable performance or coal gen (because C2G flex has essentially disappeared despite the rapid moves in natgas price), then all the pressure falls on gas generation to meet increased load.
The question that we ask ourselves is where prices need to move if supply does not respond quickly and we need to change consumer/industrial consumption behavior or we need to disincentivize LNG flows.
NatGas Storage Fundamentals:
The EIA reported a +76 Bcf injection for the week ending May 6th, which came in slightly lower than market estimates. This storage report takes the total level to 1643 Bcf, which is 376 Bcf less than last year at this time and 312 Bcf below the five-year average of 1,955 Bcf.
All the regions looked relatively fair to us, including the SC this week which reported +28 Bcf injection (+8 Salt/+20 Non-salt). Last week we noted that major vendors might be missing Texas production, and we still believe that might the case. The Permian Highway Pipeline (PHP) started maintenance on May 3rd which is expected to last 11 days. The biggest portion of the maintenance took place between May 3-6, where approximately 0.9 Bcf/d of production was potentially shut-in. The modeled data does not show that level of production dropping across the South Central. The maintenance did continue into this week, but with a more minor impact.
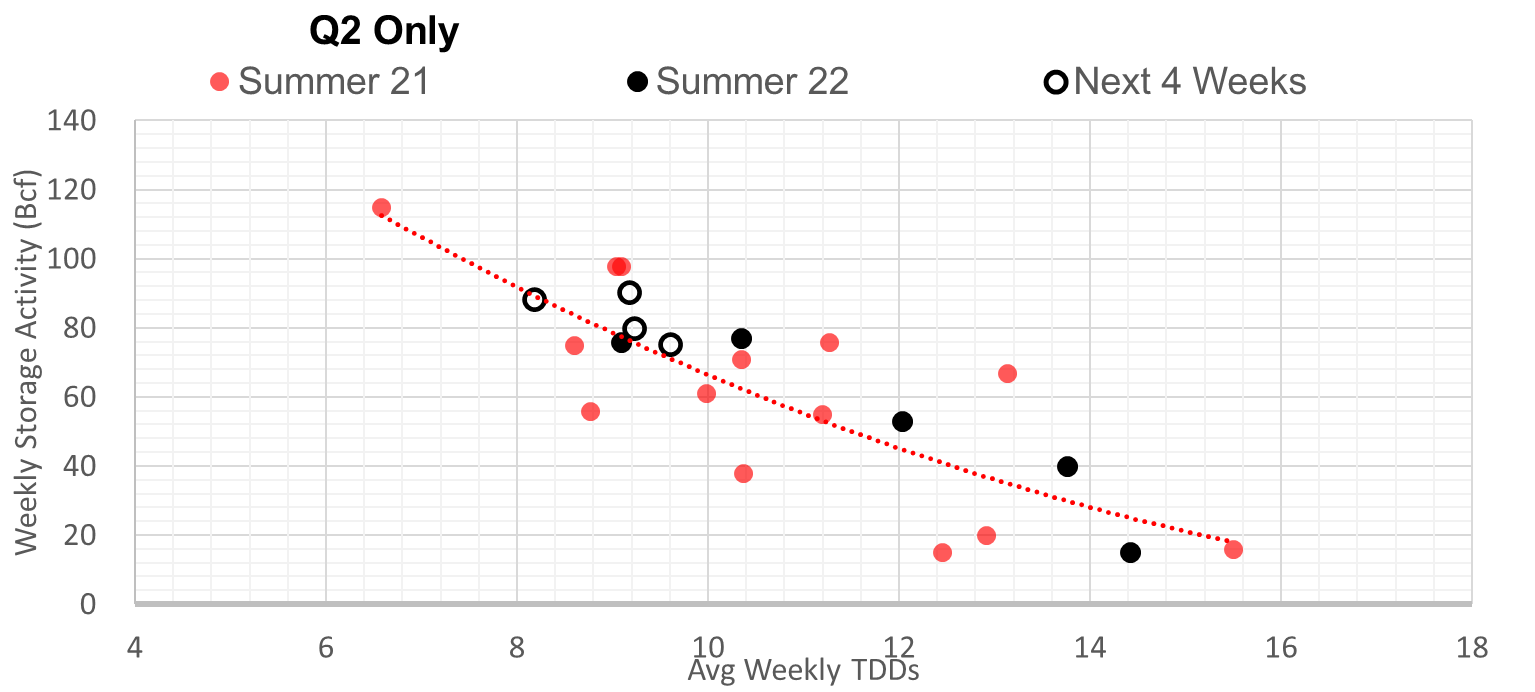
Unlike the past few weeks where balances were relatively loose, we estimate this +76 Bcf injection was flat to last summer (wx adjusted). Even when we compare this report to Q2 2021, we see it being flat as seen in the chart below.
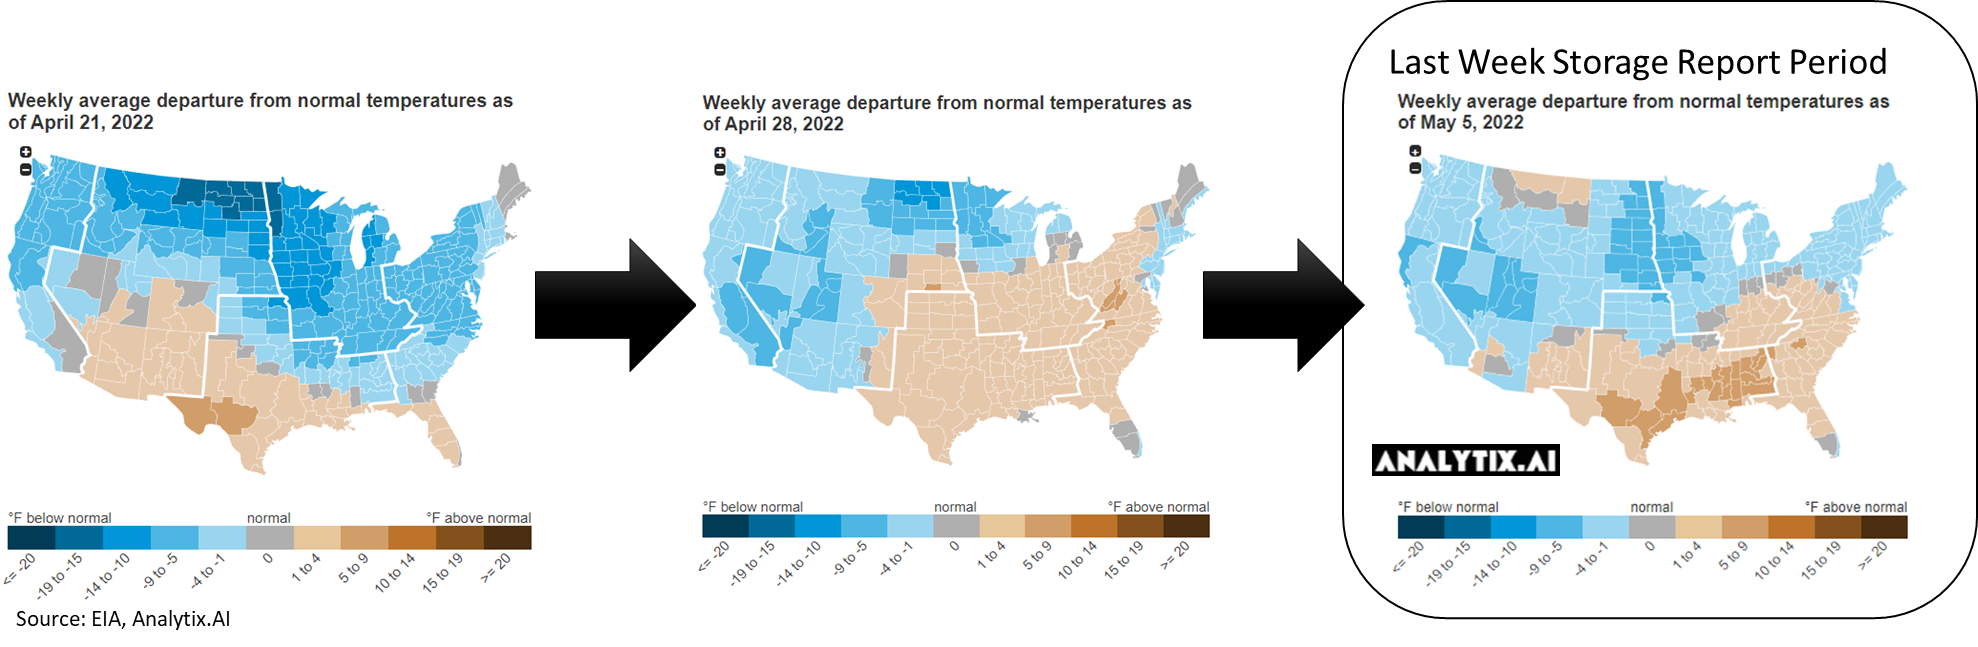
Despite the injection being in line with the previous week, the fundamentals shifted with the overall weather. At the L48 level, GWHDD decreased by 1.5F relative to the previous week, and CDD slightly picked up by 0.5F.
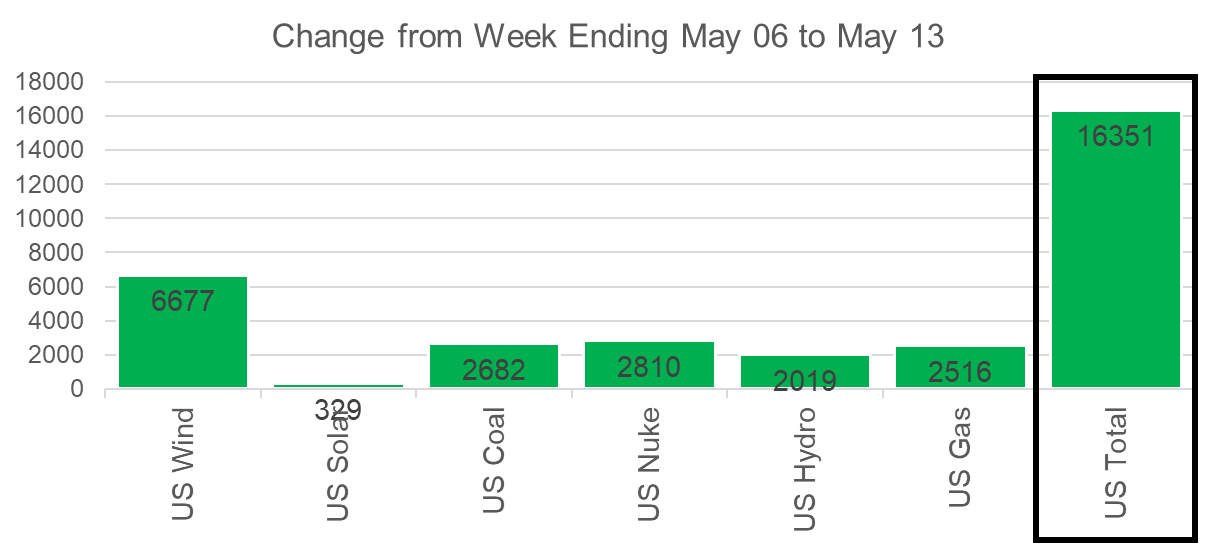
This temp change along with increasing power loads (+8.5 GWh on average) and dropping wind (-9.7 GWh on average), led to gas consumption from the RC sector dropping by 2.4 Bcf/d and power gas burns increasing by 1.5 Bcf/d.
For the week ending May 13th, our early view is +92 Bcf. This reporting period will take L48 storage level to 1,735 Bcf (-355 vs LY, -307 vs. 5Yr)
For this past week, we started to reach record levels from the South Central up into the Midwest. The net result was the L48 GWHDD decreasing by 0.7F relative to the previous week and population wt. CDDs increased by 0.8F; resulting in a 2.1 Bcf/d decrease in natural gas consumption. This helped direct more natgas to storage facilities relative to the previous reported week. We look to be approaching the triple-digit injections, but our 4-week forecast does not get to these levels as we move away from the shoulder with this early heat.
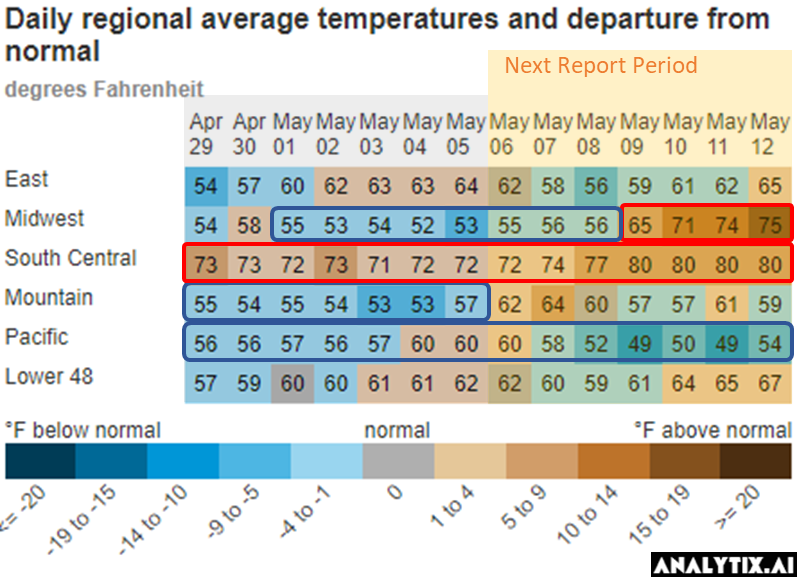
Overall, the power load was much higher week-on-week with the increased heat in the ERCOT and MISO regions. Thankfully wind resumed its overperformance schedule.
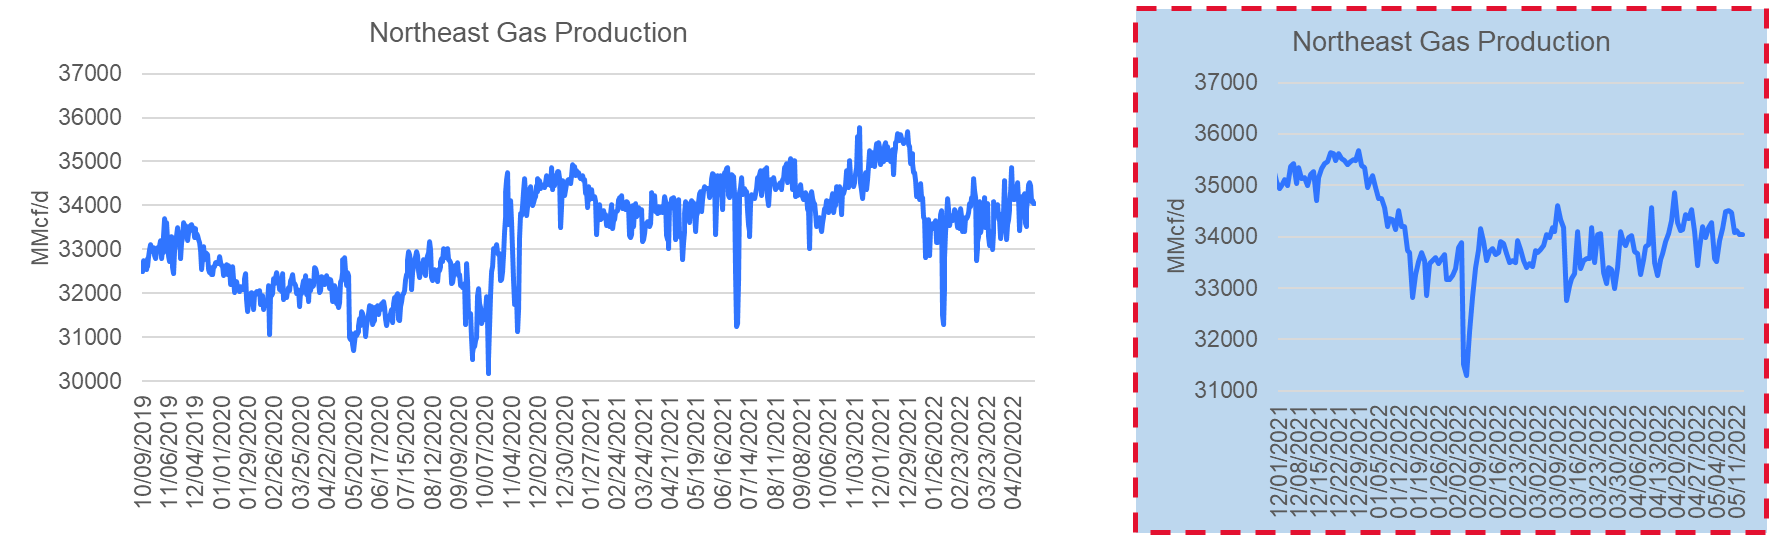
Domestic dry gas production was higher by 0.2 Bcf/d WoW. We saw Bakken production return to over 2.0 Bcf/d of production, but the region is still roughly 0.2 Bcf/d lower than typical volumes. Other regions where we saw big changes were the Midcon and Northeast. The Midcon production levels dropped by 0.4 Bcf/d, while the Northeast rose by a similar level. We attribute both changes to various pipeline maintenance schedules.
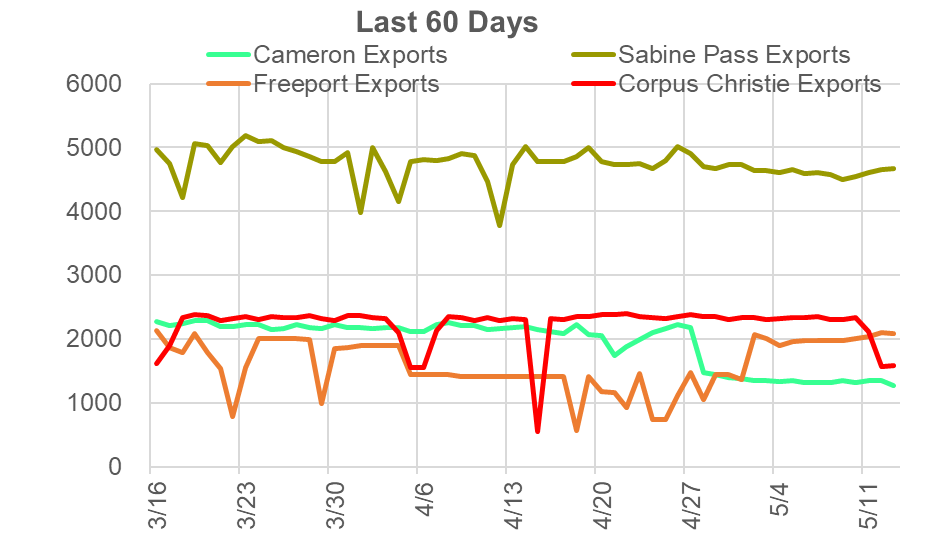
Deliveries to LNG facilities averaged 12.2 Bcf/d last week, which is flat with the previous week. Cameron continues its 3-week maintenance on Train 1, while it also appears Corpus Christie started maintenance on a train this past Thursday. There is no confirmation from the facility, but they conducted maintenance last year at the same time.
The net balance was +1.7 Bcf/d looser week-on-week.
This email, any information contained herein and any files transmitted with it (collectively, the Material) are the sole property of OTC Global Holdings LP and its affiliates (OTCGH); are confidential, may be legally privileged and are intended solely for the use of the individual or entity to whom they are addressed. Unauthorized disclosure, copying or distribution of the Material, is strictly prohibited and the recipient shall not redistribute the Material in any form to a third party. Please notify the sender immediately by email if you have received this email by mistake, delete this email from your system and destroy any hard copies. OTCGH waives no privilege or confidentiality due to any mistaken transmission of this email.