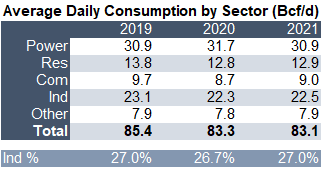
This week we start by looking at industrial natural gas consumption for the current year and see how it compares to past years. Industrial usage accounts for roughly 27% of America’s natural gas consumption.
Natural gas has a multitude of industrial uses, including providing feedstock or fuel for products such as plastic, fertilizer, anti-freeze, and fabrics.
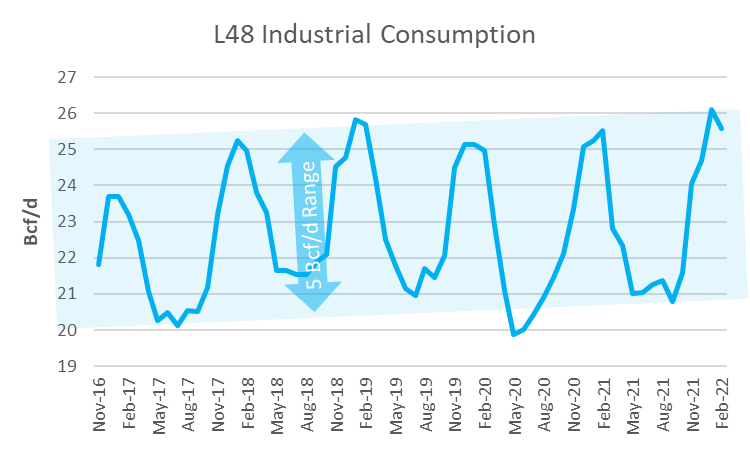
Industrial usage is typically quite steady and predictable. In any given year industrial consumption ranges from ~20 Bcf/d to 26 Bcf/d depending on ambient temperature levels.
Industrial consumption noticeably grows when a large new industrial facility comes online. With COVID shutdowns over the past few years, we have seen no growth increase from the data. The latest EIA monthly S/D data from the EIA confirms that industrial consumption has finally returned to pre-COVID levels. The chart below shows the first two months of this year lining up with 2019 data points.
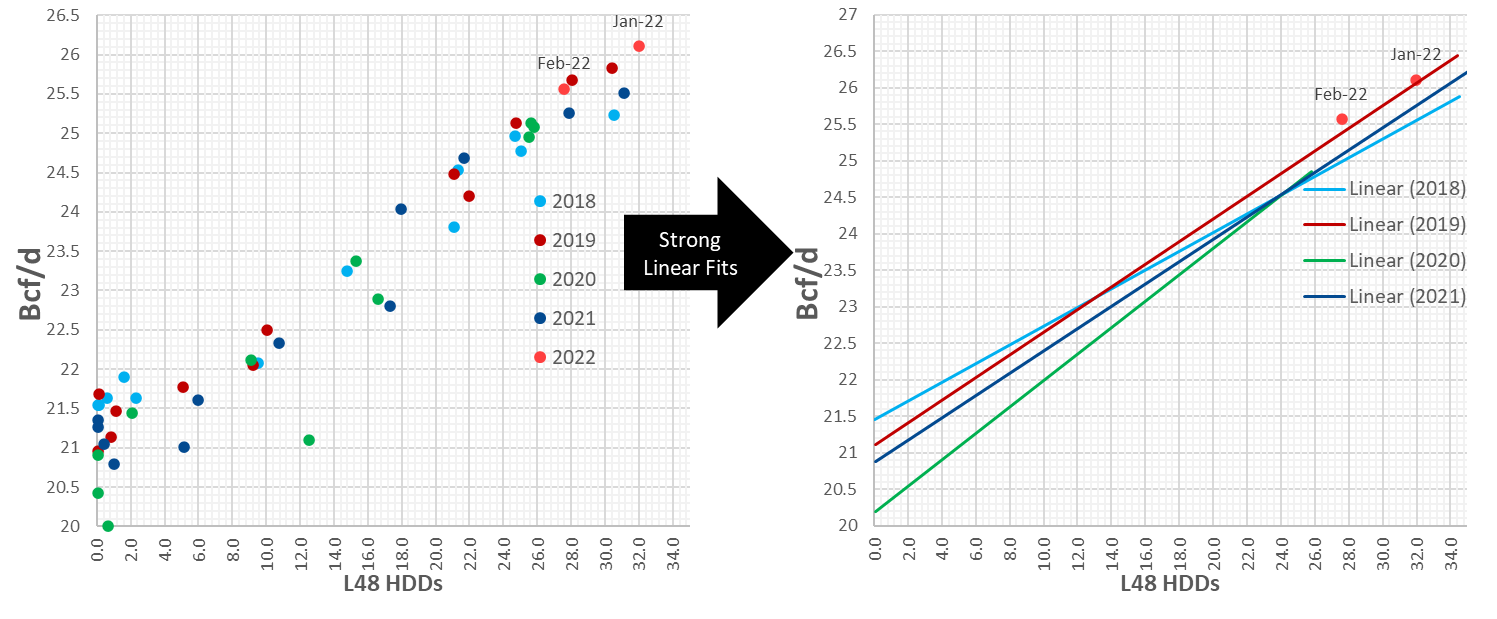
This level is roughly 0.5 Bcf/d higher YoY (wx adjusted).
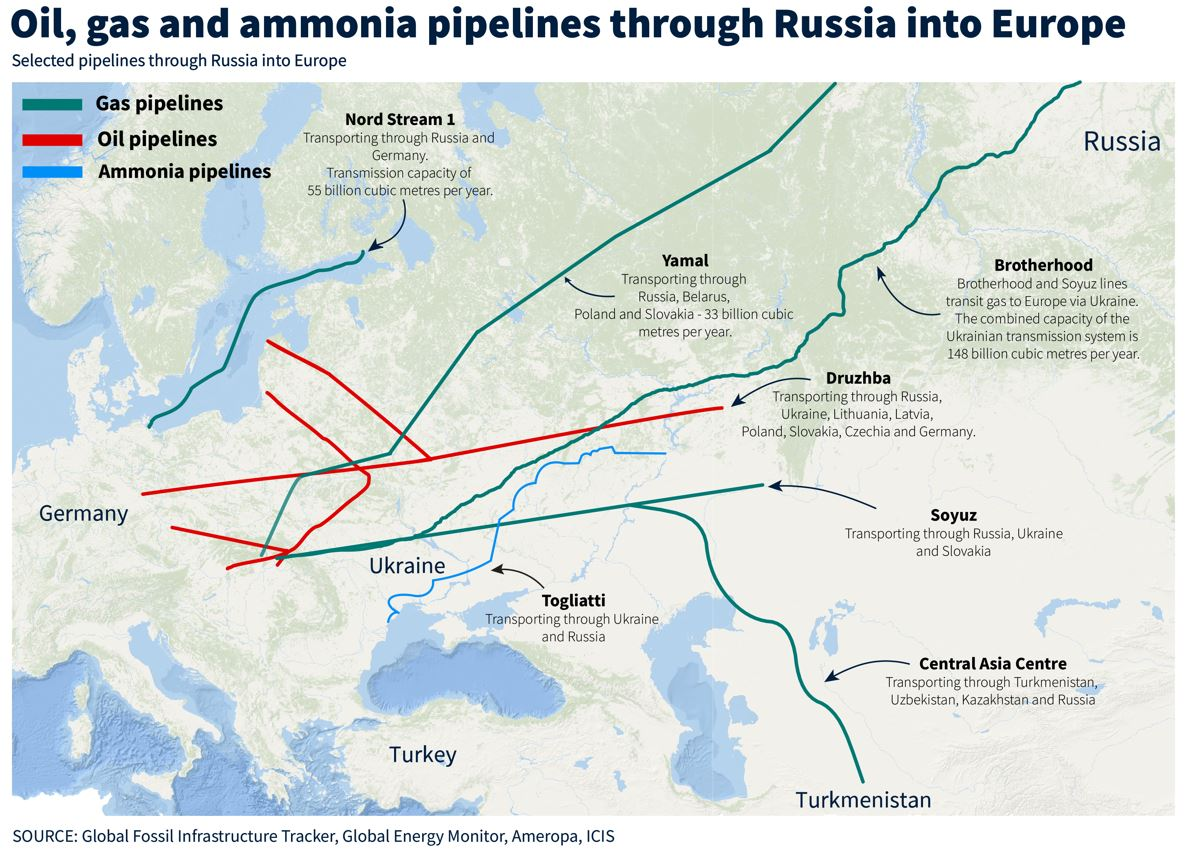
The data shown above is from before the Russia/Ukraine conflict began. Natural gas is a key feedstock for making nitrogen fertilizers such as ammonia, urea, and nitrates. US ammonia/fertilizer production place 3rd globally after China and Russia. Russia supplies 20% of the global seaborne ammonia market, but with the start of the war, their supply has been disrupted pushing fertilizer prices much higher. About 2/3 of Russia’s ammonia production gets to the global market via the Togliatti-Azot pipeline to the Black Sea port of Yuzhny.
According to ICIS, “Russian nitrogen fertilizer major Togliatti confirmed the suspension of the transit of ammonia to the Black Sea port via pipeline to ensure the safety of people living in the vicinity of the lengthy conduit.
The Samara Oblast-based giant also confirmed the shut down of four of its seven ammonia units, with the other three plants operating at reduced rates.”
The question raised is whether US ammonia/fertilizer industrial facilities could be ramped up to take advantage of the wide US natgas to global ammonia/fertilizer margins resulting from the lost Russian capacity and global shutdowns of fertilizer plants due to soaring global natural gas prices?
We do not believe so.
The EIA estimates approximately only 1.5 Bcf/d of natural gas or 6.5% of all US natural gas consumption is used to produce ammonia. So even if there was spare capacity to produce more say 10% more, this would not have a substantial impact on overall industrial gas usage.
For the rest of summer, we have modeled industrial consumption to be in line with 2019 levels using the 10Y normal weather. This gets us to an average of 21.8 Bcf/d vs 21.3 Bcf/d LY.
NatGas Storage Fundamentals:
The EIA reported a +77 Bcf injection for the week ending Apr 29th, which came in much higher than market estimates. This storage report takes the total level to 1567 Bcf, which is 382 Bcf less than last year at this time and 306 Bcf below the five-year average of 1,873 Bcf.
All the regions looked relatively fair to us, except the SC which reported injection 5-7 Bcf higher than expected. In particular, Non-Salt storage threw off our estimate. The last few weeks have all come in higher than expected, which gets us thinking about what we are missing.
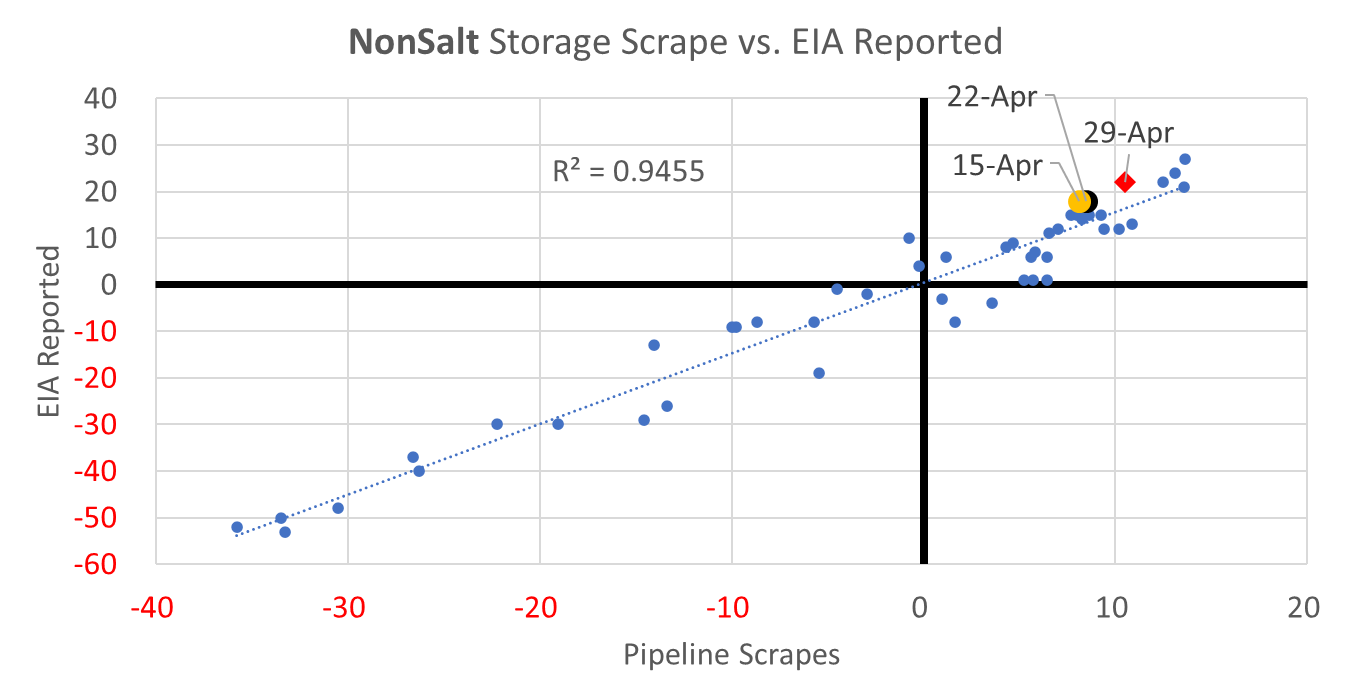
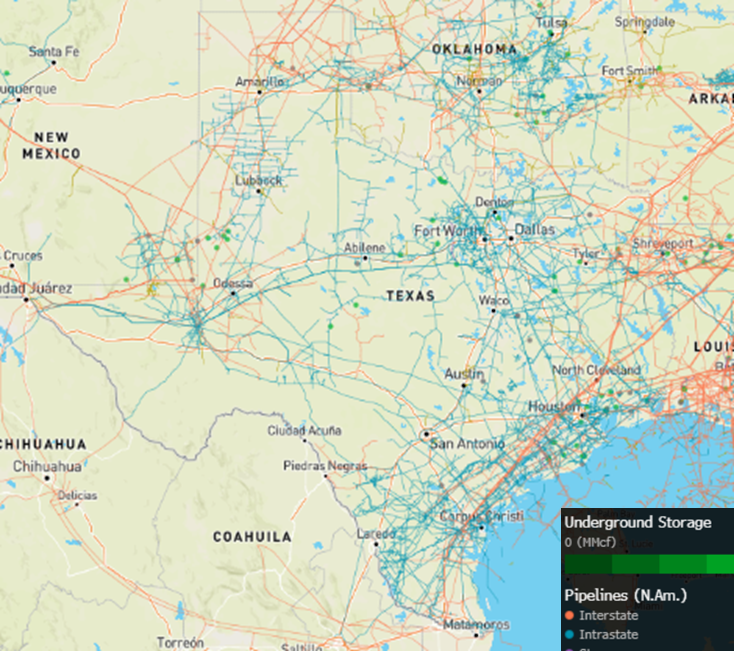
The simple and most obvious answer is Texas production. It is very likely that we are not seeing the full production picture due to the vast network of intrastate pipelines that pick up production. As most of you know, the daily pipeline receipt and delivery data we see only covers the interstate pipelines; hence for Texas, we can not necessarily see production that is received on an intrastate pipeline and delivered to a storage facility or an end consumer within the state.
Here is a map to show how immense the Texas intrastate (blue pipes) network is. The green dots represent natural gas storage facilities.
Based on current storage injection, it is likely we are not modeling up to 1 Bcf/d of dry gas production from this region.
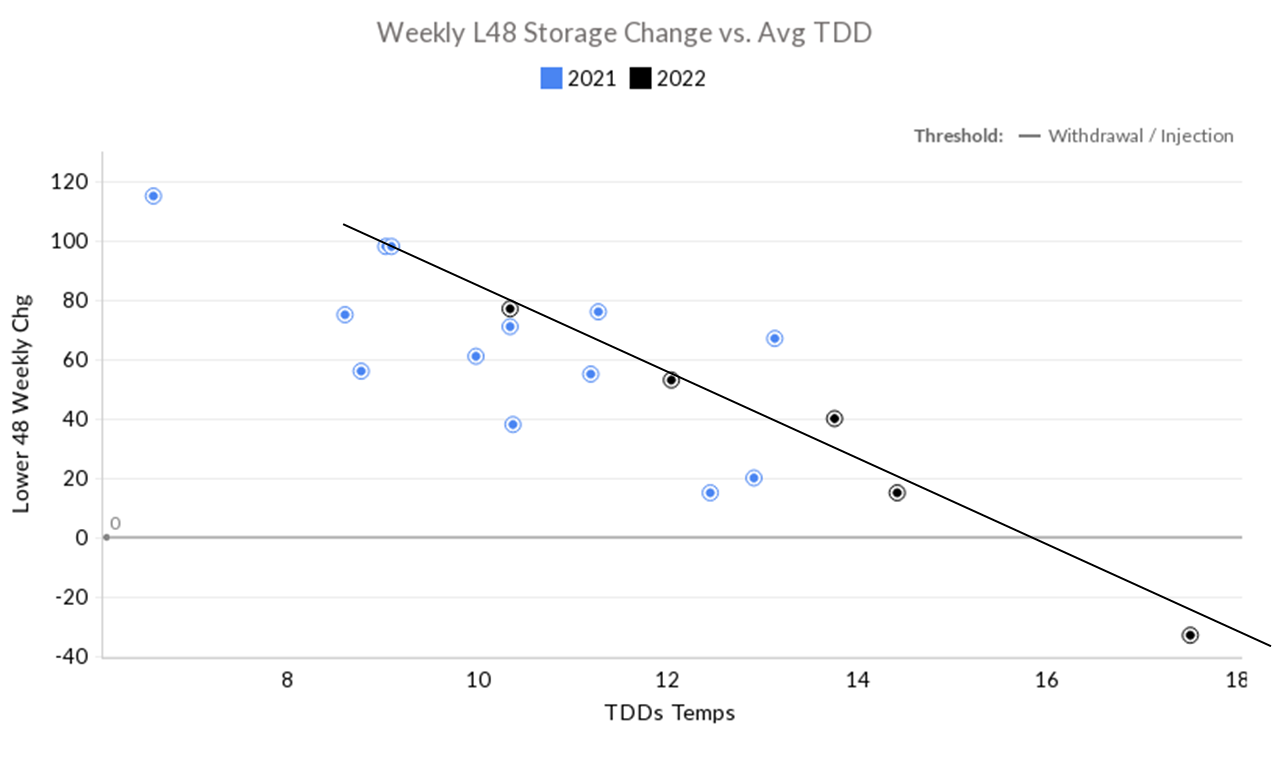
Overall, we estimate this +77 Bcf injection is ~1.6 Bcf/d loose vs last summer (wx adjusted), which is looser than the two previous week’s reports. If we were to focus solely on the injection and weather relationship in Q2 2021 then this number was about 2.1 Bcf/d looser (wx adjusted). See the chart below.
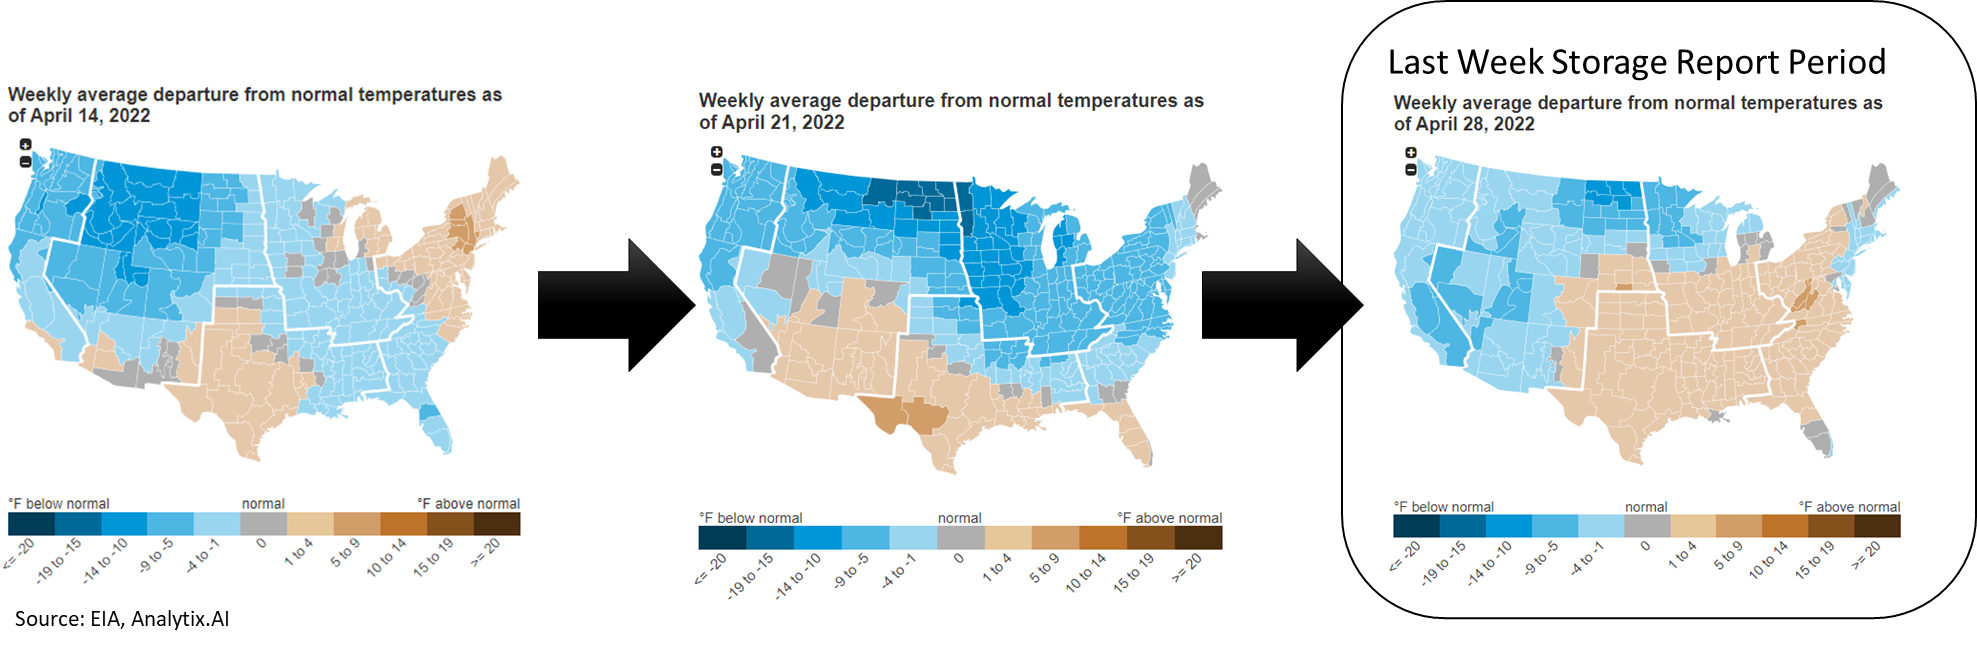
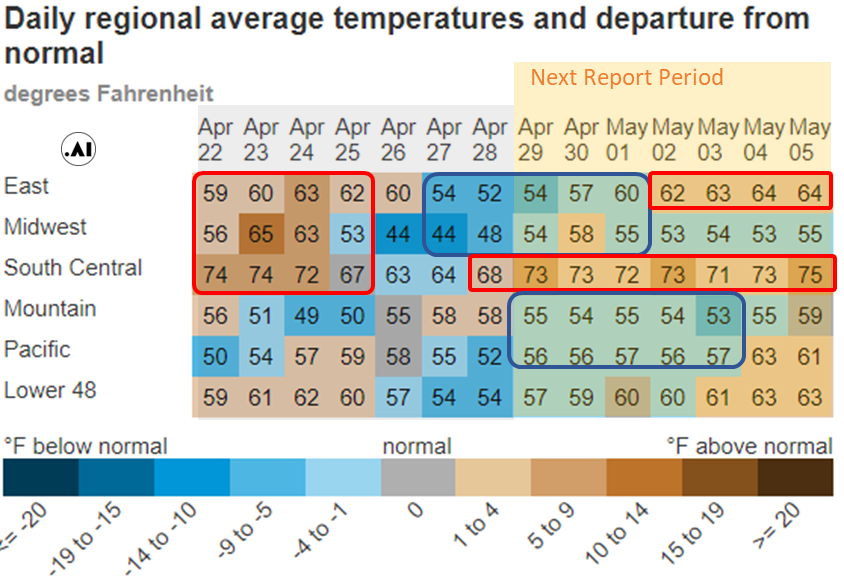
The higher injection week-on-week was primarily due to decreasing gas consumption as the warmer weather blanketed much of the country. At the L48 level, GWHDD decreased by 4.2F relative to the previous week; resulting in a 5.6 Bcf/d drop in natural gas consumption for space heating (rescomm only). The weather maps below give a good story of how the weather has progressed this April so far, and the week was predominately warm East of the Rockies.
Power loads were once again flat week-on-week. That being said, we saw wind gen once again outperform and nuke capacity start to resume. The growth in those gen types put a little downward pressure on natgas power burns by 1.6% week-on-week.
For the week ending May 6th, our early view is +82 Bcf. This reporting period will take L48 storage level to 1,649 Bcf (-370 vs LY, -309 vs. 5Yr)
For this past week, the weather continued its way back to normal. The net result was the L48 GWHDD decreasing by 1.5F relative to the previous week and population wt. CDDs increased by 0.5F; resulting in a 0.9 Bcf/d decrease in natural gas consumption. This helped direct more natgas to storage facilities relative to the previous reported week.
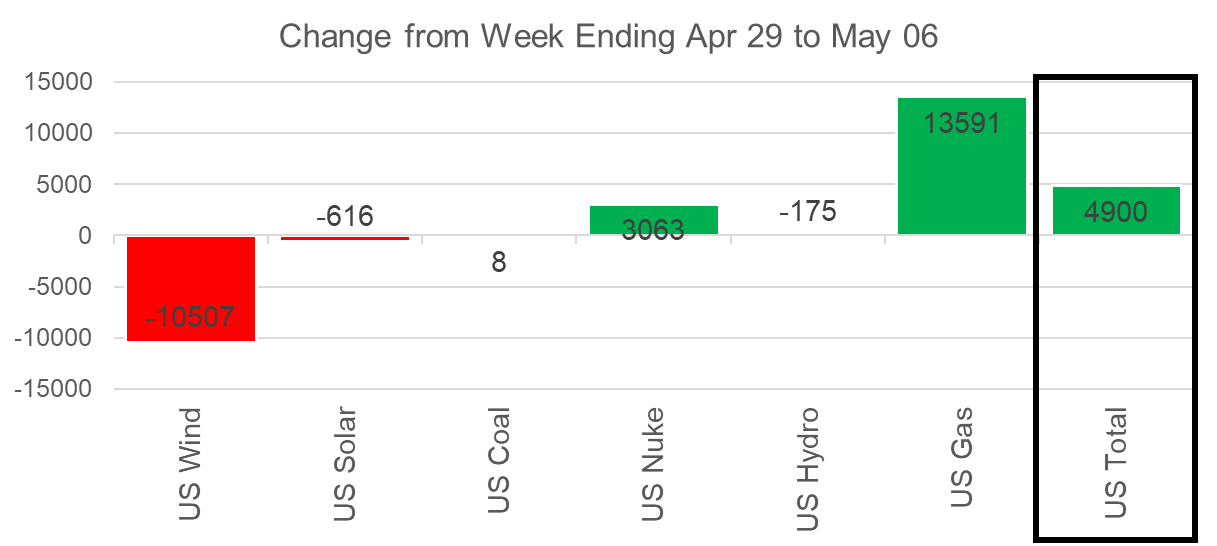
Overall, the power load was slightly higher week-on-week but there was a big change in the gen stack. This past week we saw wind gen fall significantly (still above normal) and that lead to higher gas burns.
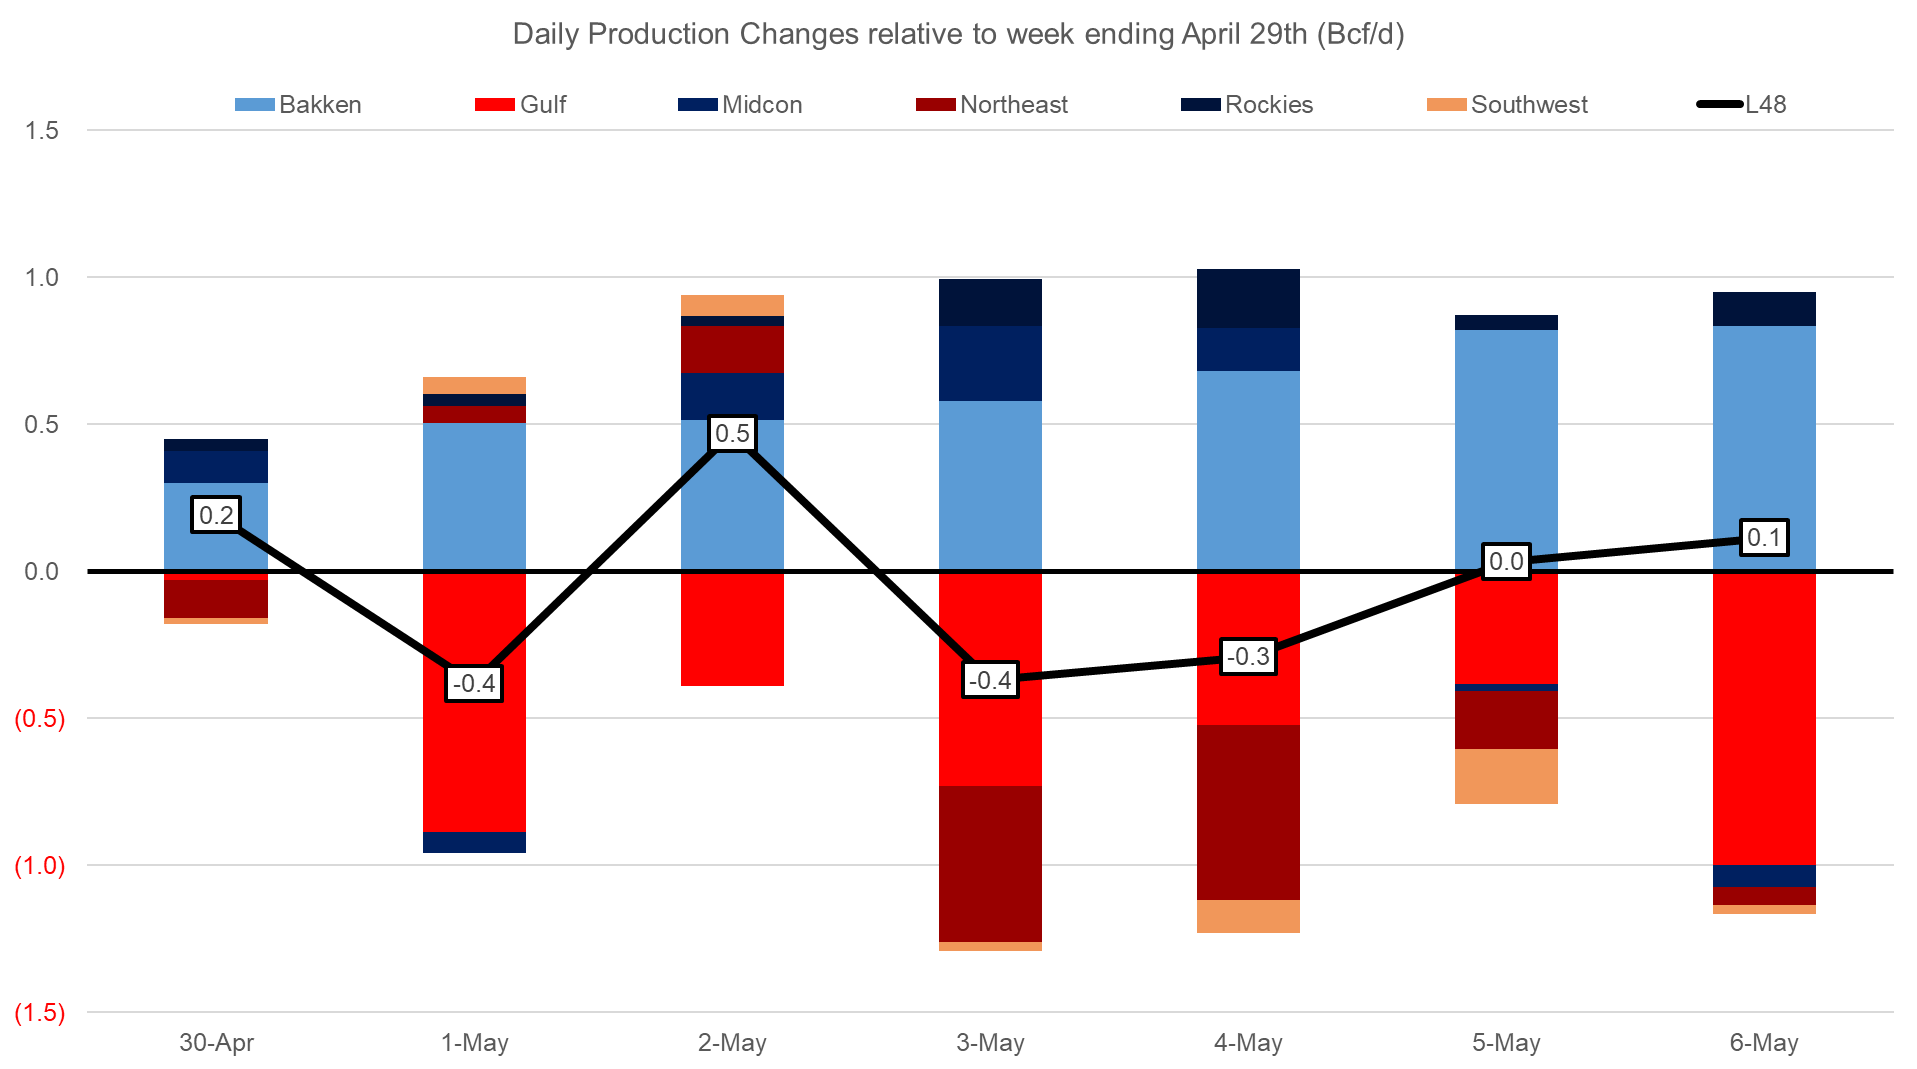
Domestic dry gas production was lower by 0.1 Bcf/d WoW. We saw Bakken production return to 2.0 Bcf/d of production, but the region is still roughly 0.3 Bcf/d lower than typical volumes. Flooding in the region has led to pipeline equipment failure; hence we do not have an exact date on when production fully resumes. The increase in the Bakken was offset by lower production from the SC and Northeast. In the SC, PHP started maintenance on May 3rd which is expected to last 11 days. The biggest portion of the maintenance took place between May 3-6, where approximately 0.9 Bcf/d of production was potentially shut-in. The Northeast production was also impacted by pipeline maintenance.
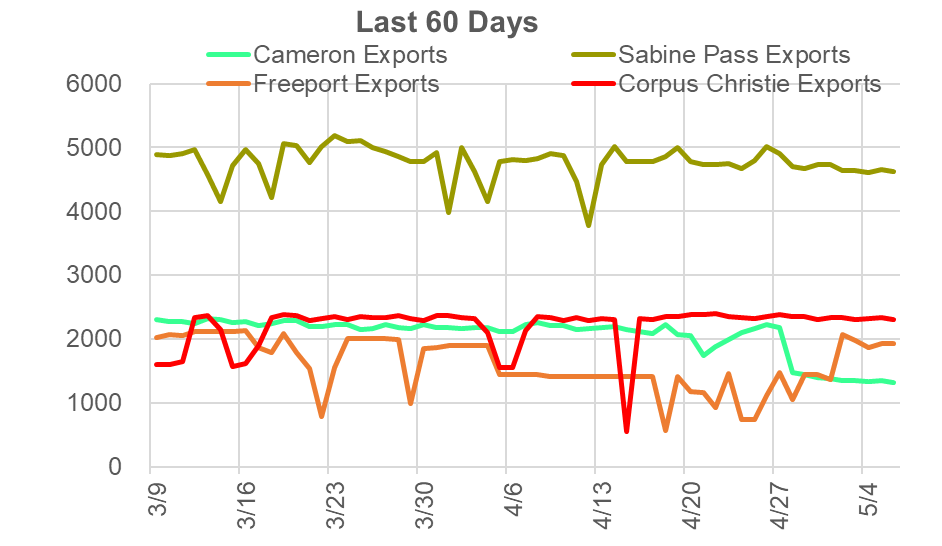
Deliveries to LNG facilities averaged 12.2 Bcf/d last week, which is flat with the previous week. This past week, Cameron started 3-week maintenance on its Train 1, while Freeport operations on Train 1 resumed after maintenance. Also notable is Calcasieu Pass rising over 1 Bcf/d in deliveries.
The net balance was +0.8 Bcf/d looser week-on-week.
This email, any information contained herein and any files transmitted with it (collectively, the Material) are the sole property of OTC Global Holdings LP and its affiliates (OTCGH); are confidential, may be legally privileged and are intended solely for the use of the individual or entity to whom they are addressed. Unauthorized disclosure, copying or distribution of the Material, is strictly prohibited and the recipient shall not redistribute the Material in any form to a third party. Please notify the sender immediately by email if you have received this email by mistake, delete this email from your system and destroy any hard copies. OTCGH waives no privilege or confidentiality due to any mistaken transmission of this email.