This week we start with some charts showing the lack of flexibility in the gas markets. Before last year we could pull a few different levers to get the gas market back in check if we were severely tight or loose. All these levers were mainly driven by market prices which would either instantaneously impact fundamentals or put the gears in motion to get there soon.
Let’s start by looking by listing out the levers:
1) Supply response: We have seen supply respond instantaneously in the past when wells in the NE are choked off as cash prices drop to an uneconomical level, but in this case, we are talking about new wells being drilled as prices climb higher. In past years we have seen this new supply lag a price signal by 3-6 months depending on the shale region.
This last year has been quite different. Despite market prices well above production oil/gas break-evens now for some time, we have not seen a strong return of rigs and new wells. The growth has come mostly from DUCs. Producers are not ready to react as they are facing other issues such as tighter capital markets, limits on infrastructure buildout, labor shortages and supply chain constraints (sand, frac crews, equipment) that are inhibiting production growth.
2) LNG exports: Technically LNG deliveries should be diverted away from the facilities if local prices are high, but at the moment global LNG arbs are extremely wide – LNG exports are out as a flex feature.
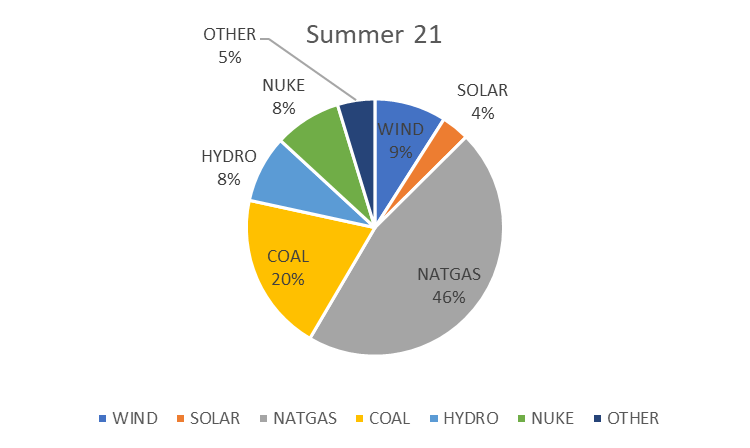
3) Power market coal to gas switching: Power markets have traditionally offered natgas markets an almost instantaneous flexibility – not the case now. Since thermal generation (natgas and coal generation) make up over 2/3 of all installed gen capacity, their position in the hourly dispatch curve (which is based on their fuel cost) is very important. The cheapest fuel usually gets called on first (as long as there are no transmission bottlenecks).
Here is a view showing the natgas generation as a percentage of taking thermal generation vs the prompt month natgas price.
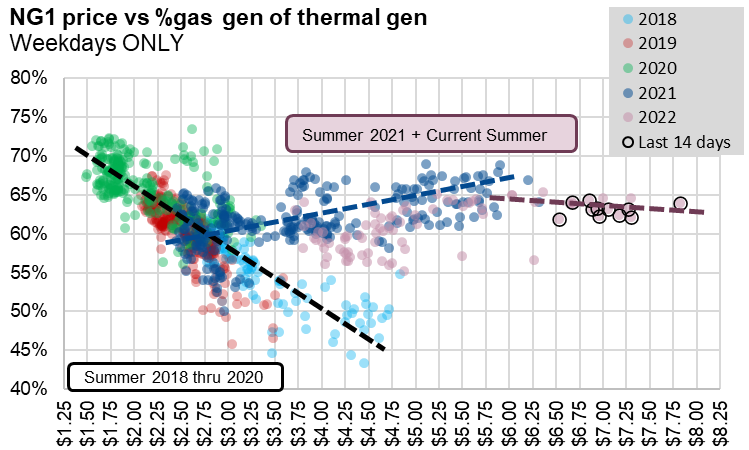
This is not an exact chart of how C2G switching works ISO by ISO, but we get a very clear view that conventionally (before 2020) natgas generation drops as natgas prices increase, i.e. coal becomes the cheaper power source. As of last summer, the dynamic has changed significantly where natgas has consistently held a 60+% market share of thermal generation regardless of how natgas high prices move.
So what’s going on? It all has to do with the state of the coal markets.
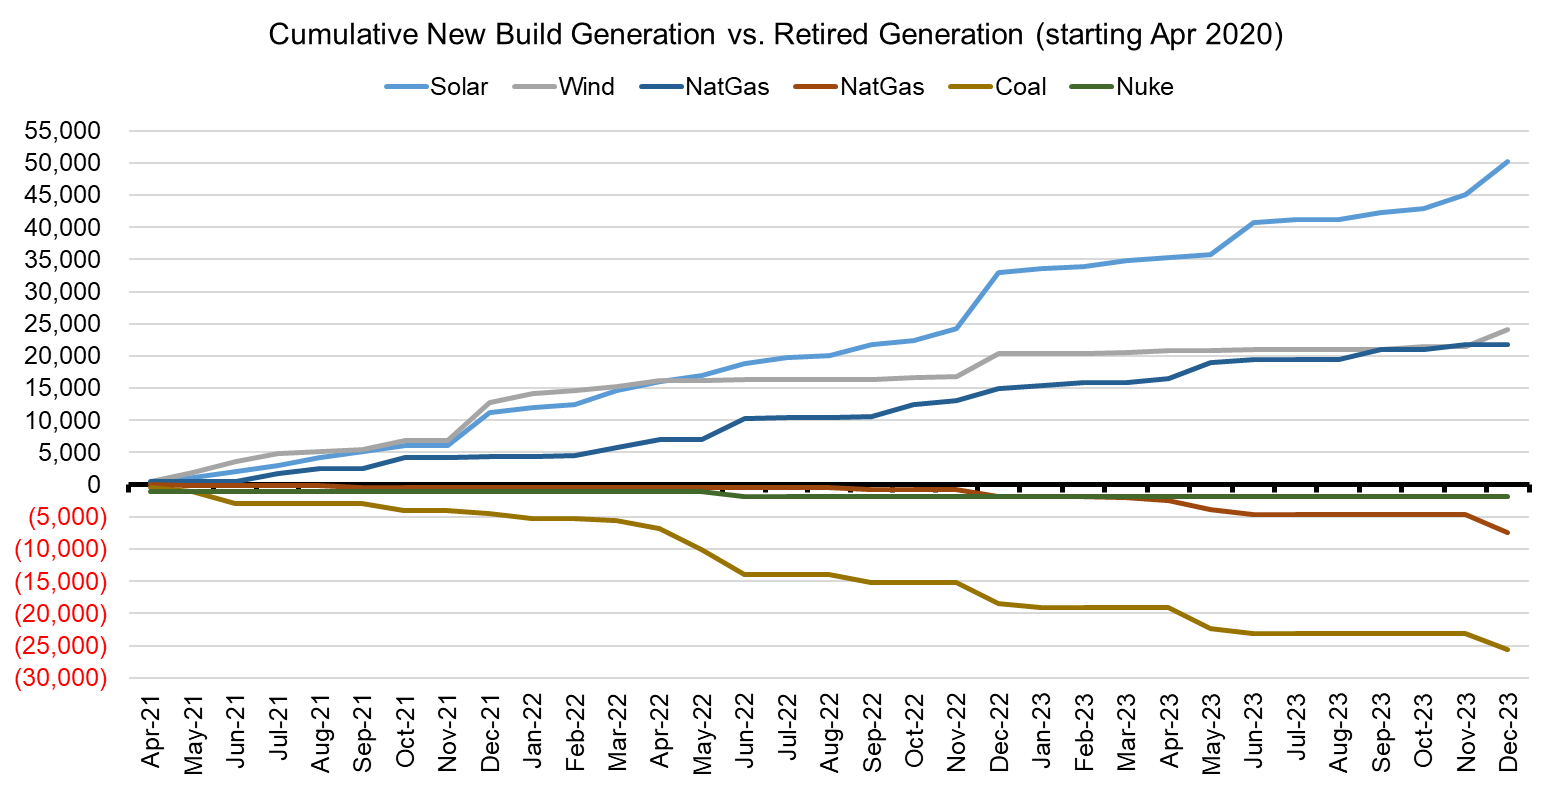
First, we have lost a considerable amount of coal generation capacity due to decisions that were made in recent years related to environmental reasons, and bad economics of operating coal plants [most likely these decisions were made when coal plant utilization was low with natgas prices below $3]. The chart below shows expected new and retired capacity by fuel type from the EIA-930 report. This is just the capacity that is officially retired and disregards units that are publicly “active” but barely utilized.
Second, the current coal markets are extremely tight with flat-lining production and higher consumption and exports. The net result is low stocks across the country leading to exploding coal prices. The series of charts below gives the full story of how the coal markets ended up in this state.
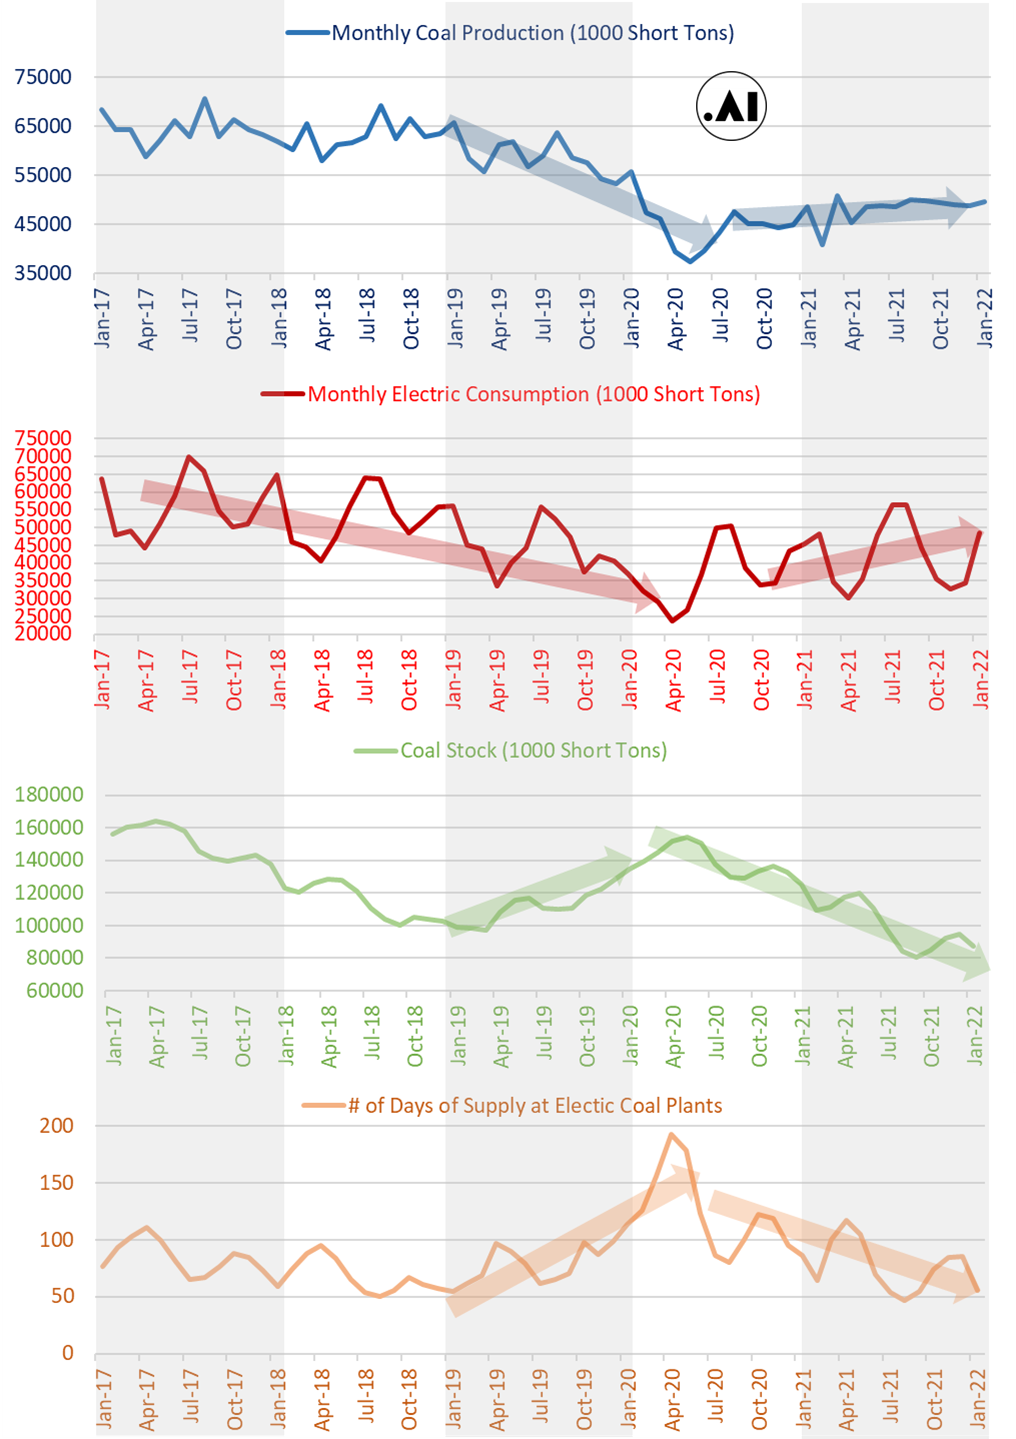
The latest January data estimates approximately 56 days of supply sitting at coal gen sites, which is a big problem with peak summer still on its way. [In Jan 2020 we had 113 days of supply, and in Jan 2021 we had 86 days of supply.]
It appears we have minimized or lost C2G switching as a flex feature this summer. This is likely going to be a huge problem if power loads stay elevated and we get the heat that is currently expected.
Storage Fundamentals:
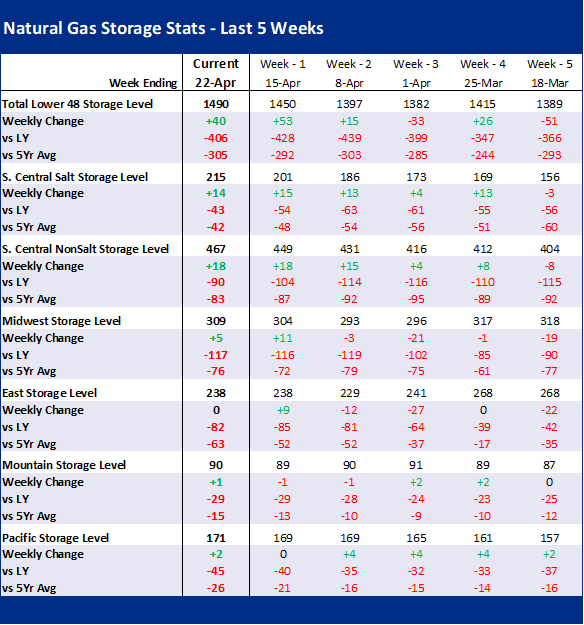
The EIA reported a +40 Bcf injection for the week ending Apr 22th, which came in line with market estimates. This storage report takes the total level to 1490 Bcf, which is 406 Bcf less than last year at this time and 305 Bcf below the five-year average of 1,667 Bcf.
All the regions looked relatively fair to us, except the East report which was flat week-on-week. This one number was hard to digest as the DTI storage alone inject 3 Bcf during the week.
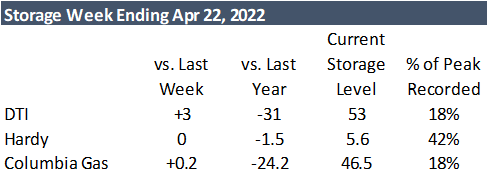
Of the 15 East region storage facilities we have visibility to, only a few reported draws (Honeoye Storage Corp & Various TGP Storage facilities). Overall, our flow model pointed to +7 Bcf in the East for the week, rather than the 0 that was reported. The East storage levels are now 82 Bcf behind LY. This is overall concerning, but could give way to regional production picking up to fill local storage. In the summer, Northeast production is constrained by takeaway pipeline capacity. With local storage demand, we could see production rise to fill the local storage demand.
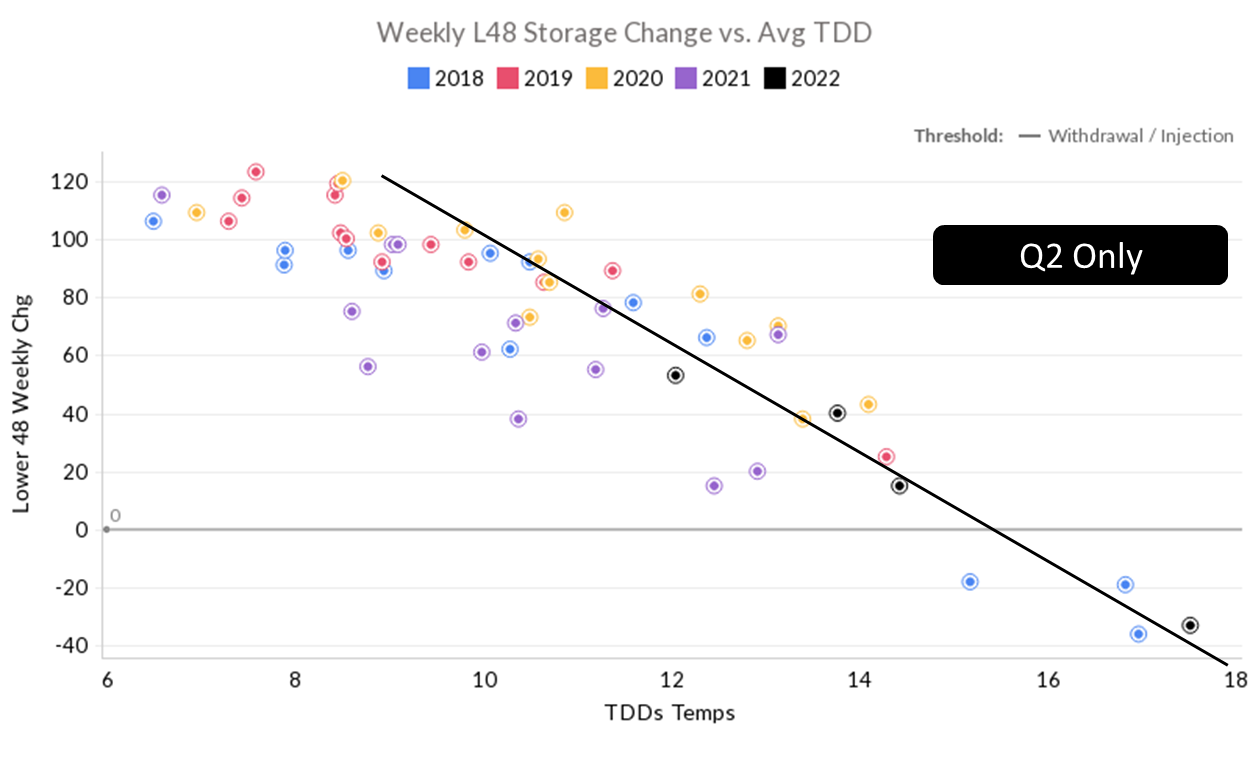
Overall, we estimate this +40 Bcf injection is ~0.4 Bcf/d loose vs last summer (wx adjusted), which is aligned with the previous week’s report. That being said, if we were to focus only on the injection and weather relationship in Q2 2021 then this number was about 1.44 Bcf/d looser (wx adjusted). See the chart below.
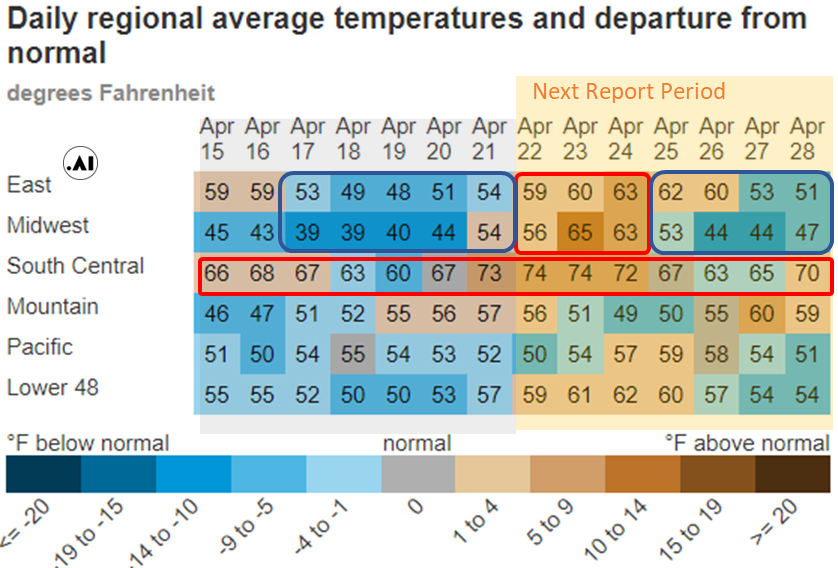
The smaller injection week-on-week was primarily due to increasing gas consumption as HDD the cooler weather intensified in the northern tier of the country. In fact, we got so cold in the Bakken region that production shut-ins were experienced in late April. At the L48 level, GWHDD increased by 1.6F relative to the previous week; resulting in a 2.6 Bcf/d increase in natural gas consumption for space heating (rescomm only). The weather maps below give a good story of how the weather has progressed this April so far.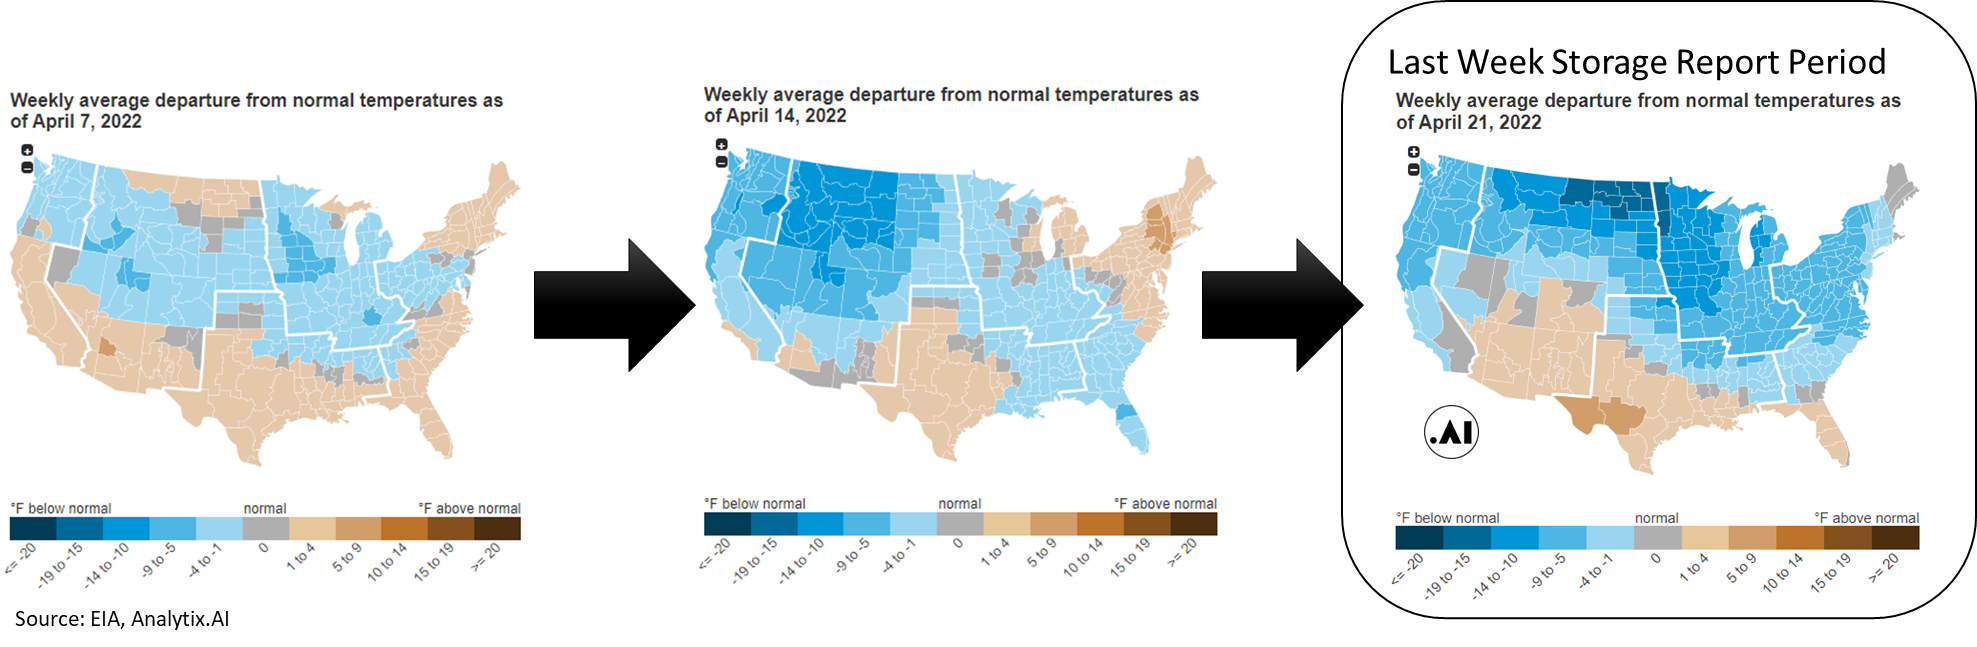
Power loads were slightly lower week-on-week. This had little influence on gas burns as the drop in wind and hydro generation essentially matched the drop in power load.
For the week ending Apr 29th, our early view is +74 Bcf. This reporting period will take L48 storage level to 1,564 Bcf (-385 vs LY, -309 vs. 5Yr)
Next week’s report will give us a full view of April, and we can now benchmark against past years with our +74 Bcf projection.
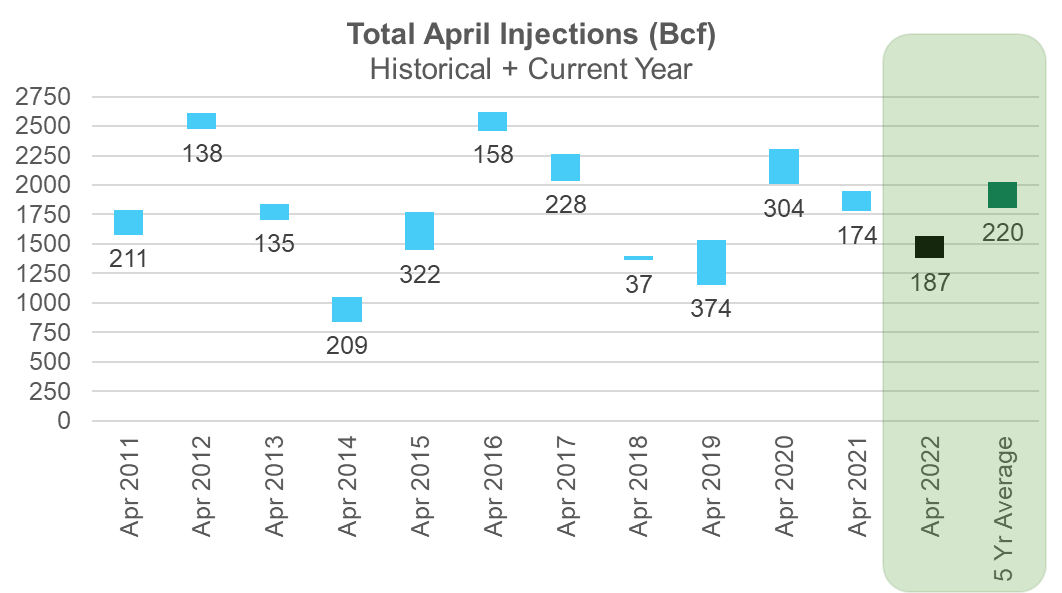
We are targeting a full month injection of 187 Bcf, which is more than last year with considerably more TDDs (full month TDD expected to be 395 vs 360 LY). This fits with the loose S/D story. The 5Yr average injection is 220 Bcf.
For this past week, the weather started making its way back to normal. The net result was the L48 GWHDD decreasing by 4.2F relative to the previous week and population wt. CDDs increased by 0.5F; resulting in a 5.8 Bcf/d decrease in natural gas consumption.
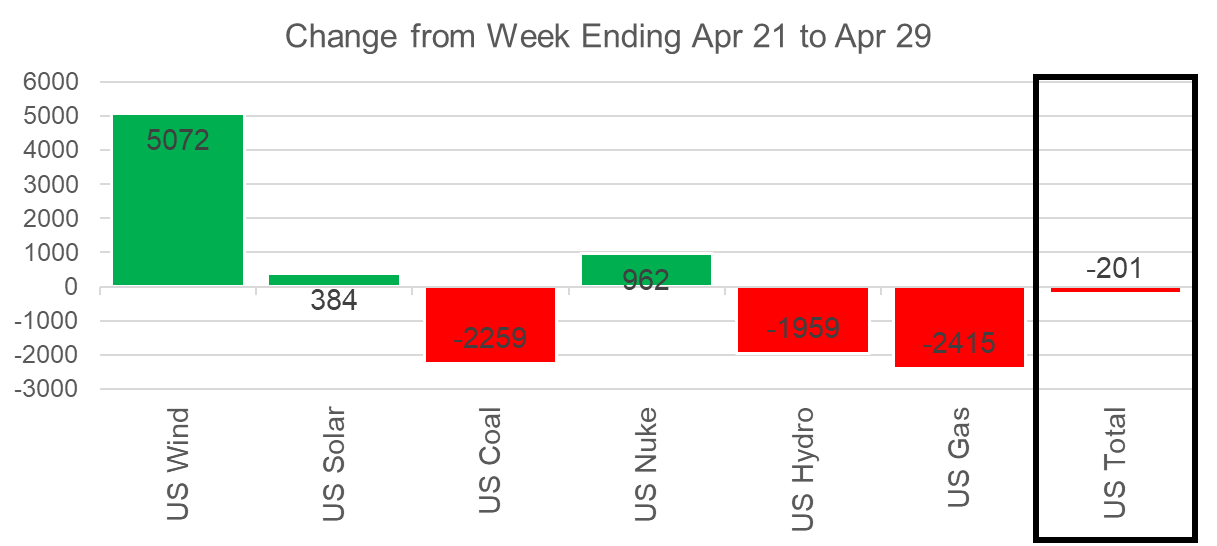
Overall, the power load was slightly lower week-on-week. As we noted last week, these small moves are just noise during the shoulder season. As the wind picked up week-on-week, both natgas and coal generation were marginally lower as seen in the chart below.
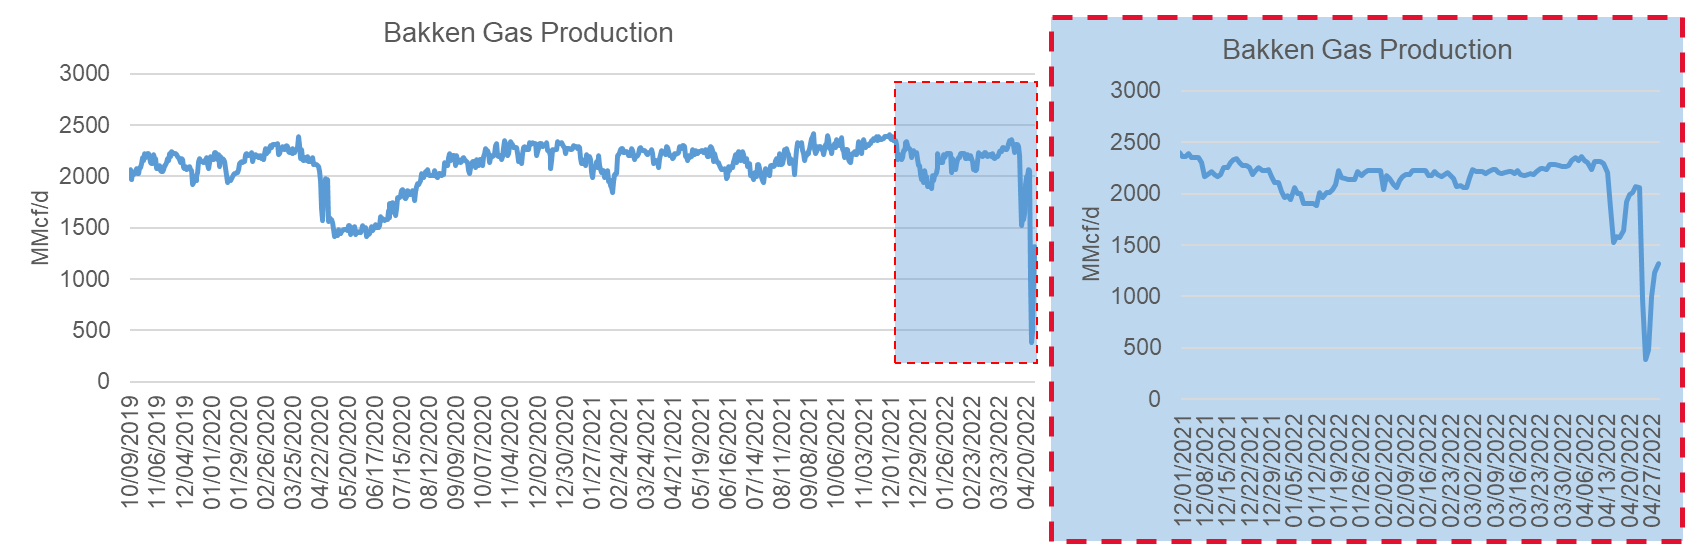
Domestic dry gas production was lower by 0.8 Bcf/d WoW, with the majority of that drop coming from the Bakken. It’s not typical to see freeze-offs (related to well constriction, power outages, or equipment failure) during late April, but the intensity of the cold and heavy snow dropped Bakken production to 25% of normal levels. The Williston Basin Interstate pipeline issued a Forced Majeure due to Extreme Weather notice on April 23rd, and then another “Inclement Weather” notice on April 28th. The 2nd notice stated:
Inclement weather is expected to continue on WBI Energy’s integrated and non-integrated transmission system. Due to these conditions, WBI Energy is requiring all scheduled quantities and physical flows on both supply and demand to match. Shippers and operators should review all scheduled quantity reports for all cycles during this time.
Receipt point operators should factor in road conditions and accessibility to plants as necessary when confirming scheduled quantities. When necessary, WBI will issue underperformance reductions to those shippers not flowing their scheduled quantities. Physical takes at all delivery points will be limited to scheduled quantities. WBI Energy is expecting all operators, shippers, and end users to continuously manage their supply and takes during this time due to the inability of WBI Energy to handle any significant fluctuations due to limited line pack and storage volumes.
The 2nd notice states a time from April 28th to May 2nd, hence we should expect variable production out of the region until then.
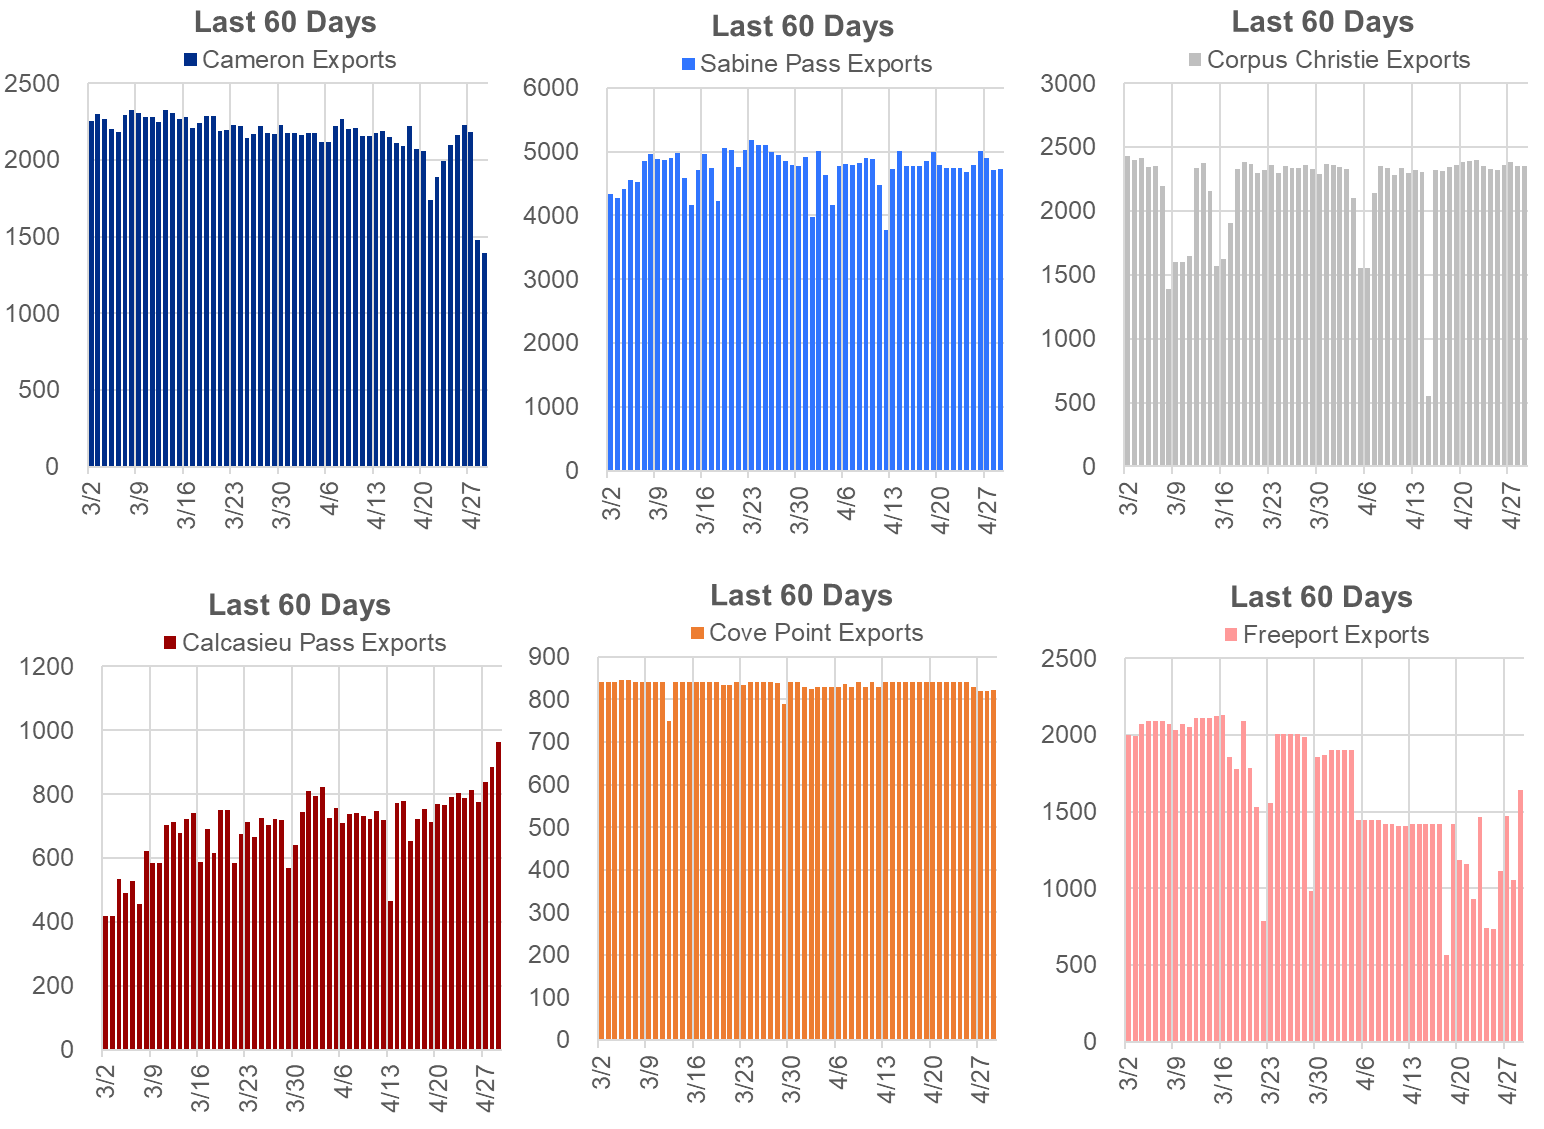
Deliveries to LNG facilities averaged 12.2 Bcf/d last week, which is +0.1 Bcf/d higher than the previous week.
– Freeport train 1 maintenance was to be completed on April 27th, but full volumes to the plant did not recover right away.
– Cameron posted lower volumes starting April 28th with no confirmation of the reason.
– Calcasieu Pass pushed its deliveries to 1 Bcf/d this past week and feed gas has begun flowing into Block 6.
The net balance was +5.0 Bcf/d looser week-on-week.
This email, any information contained herein and any files transmitted with it (collectively, the Material) are the sole property of OTC Global Holdings LP and its affiliates (OTCGH); are confidential, may be legally privileged and are intended solely for the use of the individual or entity to whom they are addressed. Unauthorized disclosure, copying or distribution of the Material, is strictly prohibited and the recipient shall not redistribute the Material in any form to a third party. Please notify the sender immediately by email if you have received this email by mistake, delete this email from your system and destroy any hard copies. OTCGH waives no privilege or confidentiality due to any mistaken transmission of this email.