The week we focus on the issues around the Suez Canal and the impact on European gas markets.
Dredgers, excavators, and tug boats are working hard to free the ship, but the operation may take weeks, according to the AP. About 10% of the world’s maritime trade passes through the canal, which allows ships to shorten the trip between Europe or the American east coast and Asia by thousands of kilometers, saving a week or more of travel time.
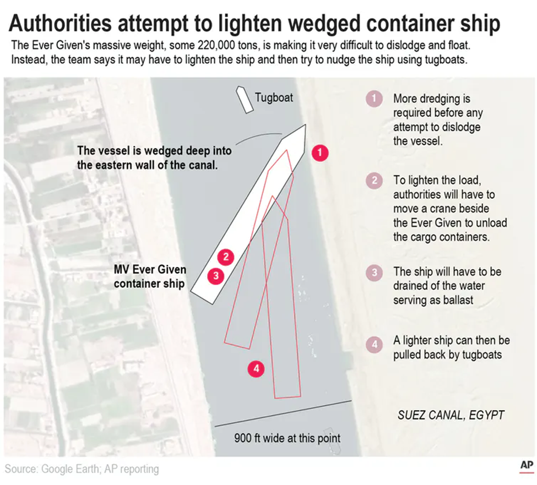
Here is a great image from the Associated Press show the process of dislodging the ship.
The blockage is leading to bullish spot price moves on European prices, but more particularly on UK’s NBP price point. According to ICIS, the UK was the likely destination of at least five Qatari cargoes in the next two weeks, which would have passed through the Suez Canal. These are now delayed, with no definite time on when the channel with be open again. Around 50 ships usually pass the channel each day; hence each day the channel is blocked a bigger queue of ships forms.
From the LNG perspective, the prolonged blockage would impact particularly Qatari exports to Europe and Russian Yamal LNG exports to Asia.
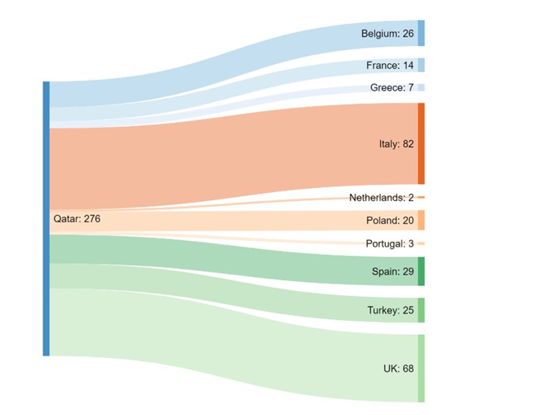
To give a better perspective of Europe’s reliance on Qatari LNG, the following image from ICIS’ LNGEdge platform shows where the 276 Qatari LNG vessels docked throughout 2020. The UK and Italy are clearly the most popular destinations. Italy has long-term contract with Qatar for the delivery of around three vessels every week. This could leave Italy short volumes to refill storage early in the season.
There have already been some diversions of Qatari vessels over the past few days. Here are some maps dropped on enelyst on Friday from ICIS.
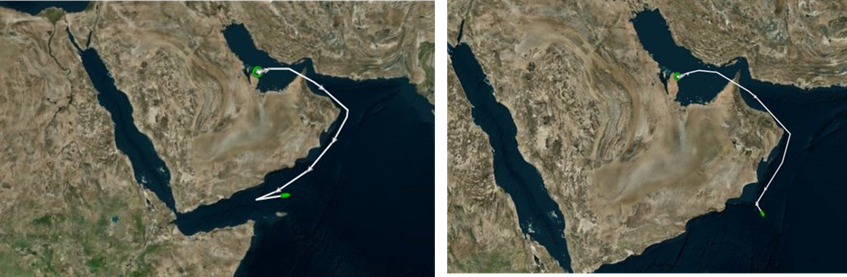
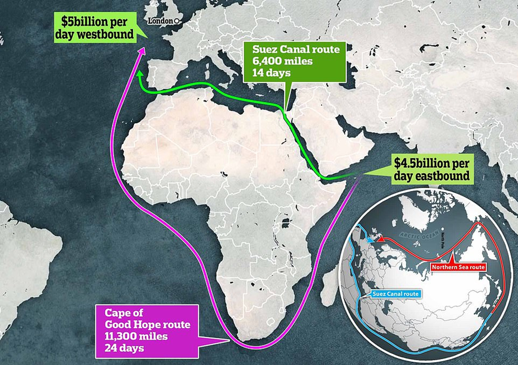
The two diversions shown above are the Q-Max tankers Al Samriya and the Al Mafyar – both likely headed to the UK. The diversion is expected to take an additional 10 days. Below is a great map showing the alternative routes with the Suez Canal not available.
Here is the half-decent good news for the situation (just from the LNG side). Thankfully this unfortunate event is happening when temperatures are mild globally, and we are switching from withdrawals to injections across the northern hemisphere. European storage levels are low, but still high enough to cover any short-term shortages.
The recent ramp up to US LNG facilities has been somewhat coincidental, but it does show how the flexibility of US LNG and how it can be a good back stop to any longer-term LNG issues in Europe.
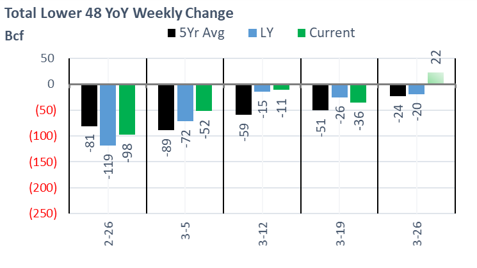
Fundamentals for the week ending Mar 26: This past week the EIA reported a -36 Bcf storage draw for week ending March 19th. This came in higher than our estimate of -27 Bcf, and the median analyst expectation of -22. The stronger number looks to confirm the increase in industrial natural gas consumption to more “normal” levels after many facilities and refineries did not immediately open after the February cold episode. As I showed on Friday, this is confirmed by the pipeline sample of industrial gas consumption.
For the week ending Mar 26th, our early view is +22 Bcf. This will be the first injection of the season, which is coming in much earlier than past years. The 5Yr average is a 24 Bcf withdrawal. This injection would take the L48 storage level to 1768 Bcf (-221 vs LY, -32 vs. 5Yr)
We see production flat week-on-week. The return of Rockies production (heavy snow that hit the region knocking out power on the CIG system) was offset by midweek drops in Northeast & South Central production due to pipeline maintenance on REX and Gulf South. Both maintenance was to be completed this weekend; hence we should see production higher next week.
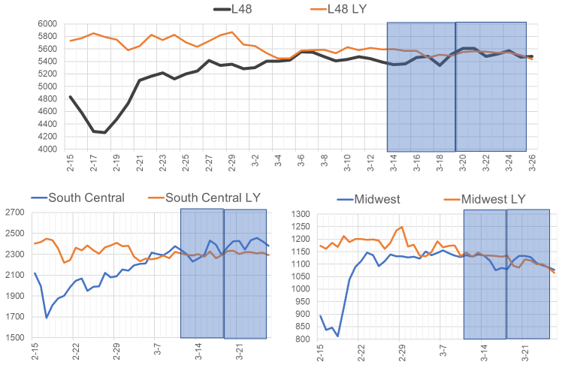
We recorded L48 GWHDD dropping this past week by an average of 4.3 degrees to 13.2 GWHDDs. This led to an average drop in ResComm consumption of -5.5 Bcf/d.
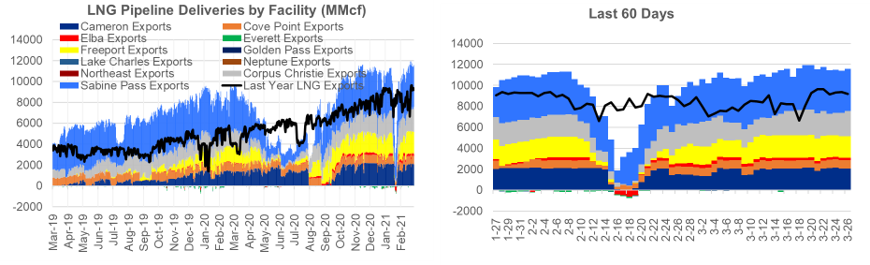
Deliveries to LNG facilities averaged 11.6 Bcf/d, which was +0.4 Bcf/d higher than the previous week. The increase came from Corpus Christie and Sabine ramping higher. We should note that many facilities this past week ramped up to levels well above their design capacity. This is quite typical of the US LNG facilities; hence we can easily exceed 13 Bcf/d of feedgas levels if all facilities coincidentally operated above their designed levels.
Net the balance is looser by 6.8 Bcf/d week-on-week.
Expiration and rolls: UNG ETF roll starts on Apr 14th and ends on Apr 19th.
May futures expire on Apr 14th, and May options expire on Apr 17th.
This email, any information contained herein and any files transmitted with it (collectively, the Material) are the sole property of OTC Global Holdings LP and its affiliates (OTCGH); are confidential, may be legally privileged and are intended solely for the use of the individual or entity to whom they are addressed. Unauthorized disclosure, copying or distribution of the Material, is strictly prohibited and the recipient shall not redistribute the Material in any form to a third party. Please notify the sender immediately by email if you have received this email by mistake, delete this email from your system and destroy any hard copies. OTCGH waives no privilege or confidentiality due to any mistaken transmission of this email.