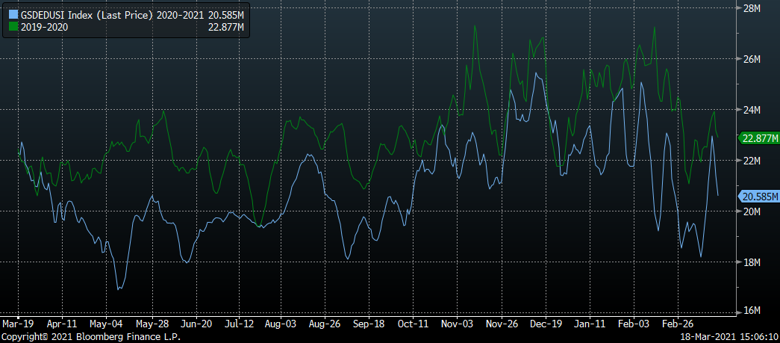
This past week the EIA reported a -11 Bcf storage draw for the week ending March 12th. This was largely in line with the output of our S/D model, and market expectations. The one thing that this number did was confirms that industrial natural gas consumption was still impacted post the February cold episode. Below is the modeled industrial consumption from BNEF. Industrial consumption is typically quite stable throughout the year with minor fluctuations related to ambient temperature.
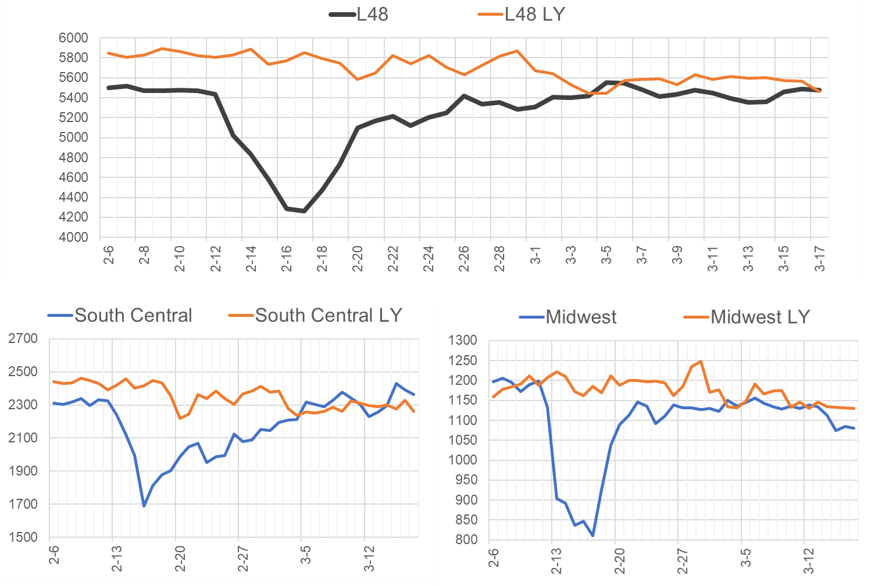
Looking at the raw pipeline data for industrial use (which is usually used to model the above) gives us more insight. The raw pipeline data gives us visibility into roughly 25% of the industrial gas consumption across the L48. The below view gives a better indication of the severity of the drop in industrial consumption during and after the cold weeks of February. The data does show industrial gas consumption climbing in the South Central. We should note that the view is slightly skewed versus last year’s level, as this was the week the country initiated COVID lockdowns and we tend to have refinery maintenance.
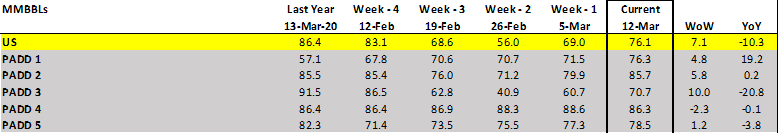
The industrial consumption includes refineries in TX and Louisiana. The oil inventory report continues to show lower refinery utilization rates. Here are the US and PADD specific refinery utilization rates. PADD 3 refinery utilization was just 70.7% for the week ending March 12th. This is 15.8% lower than the utilization before the February cold.
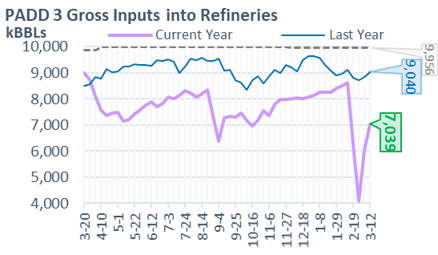
A closer look at Padd3 refinery inputs.
Other factors related to the lower industrial usage are the warming temps and remaining COVID impacts. This from the EIA:
“U.S. industrial consumption of natural gas decreased 2% in 2020. COVID-19-related closures and less demand reduced industrial consumption for much of the year. Industrial natural gas consumption has increased in 8 out of the past 10 years because of growth in dry natural gas production and relatively low natural gas prices.”
The modeled-up data from BNEF shows L48 natural gas consumption growing by 3.0 Bcf/d week-on-week for this upcoming report, despite temps flat. Looks like more facilities have been able to get back on.
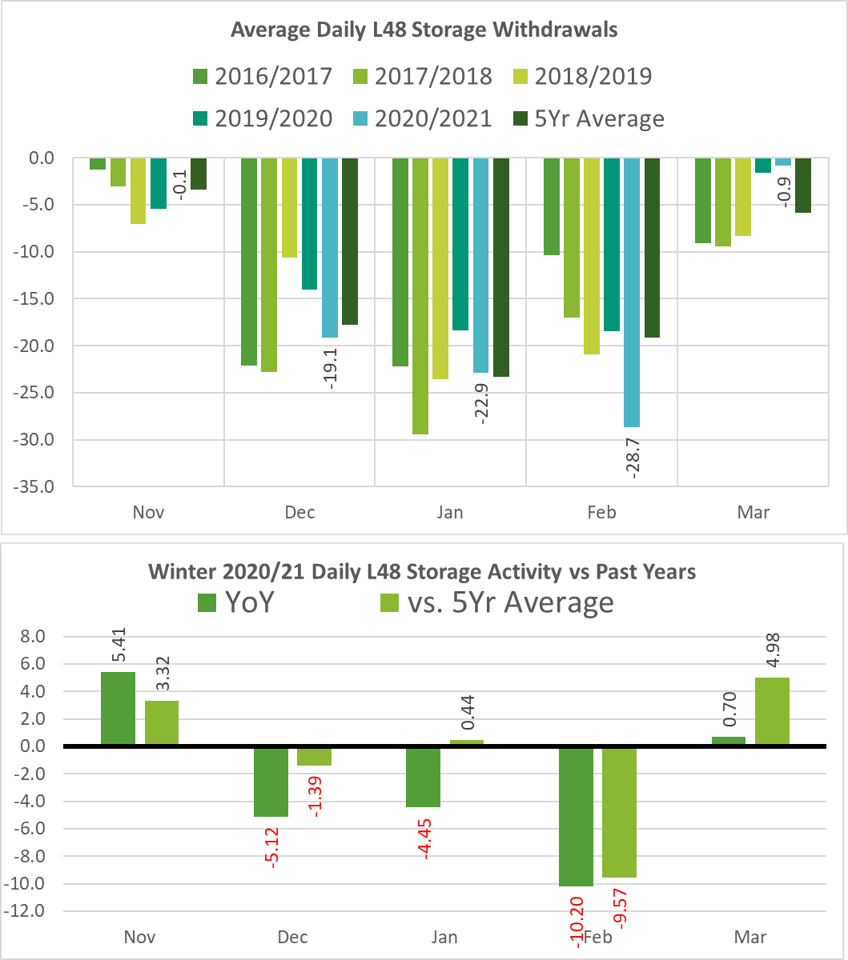
Finally, I wanted to share a couple of charts on how this winter season finished in terms of storage activity, and what I am projecting for the summer.
For the winter, the chart shows that storage draws in Dec and Jan were close to the 5Yr average. Feb was the major outlier with draws coming in considerably higher due to the extreme cold. This Mar is shaping up to remarkably interesting and looking to be one of the lowest Mar draws on record. As stated above, this is a result of the lower industrial natgas consumption and warmer than normal temps.
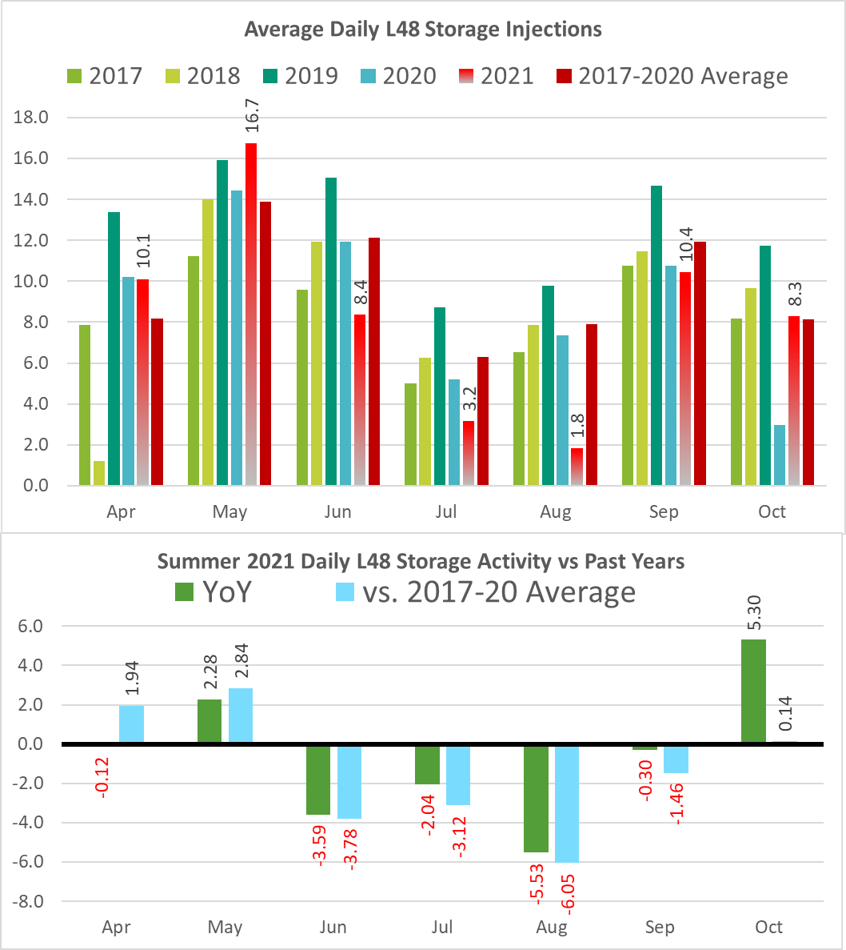
Here is the same chart for summer, including our summer storage activity forecast. At this point, it appears that June/Jul/Aug will be substantially tighter than in past years. For our modeled scenario our end of Oct storage level is 3572 Bcf.
In our summer balances, we have production ranging between 90-90.5 Bcf/d in this scenario, LNG/Mex export both growing, and model a lower gas consumption (power) mainly due to higher prices YoY and the renewable increase this past year.
Fundamentals for the week ending Mar 19: This past week’s storage report came within the expected range and more in line with the output of our S/D model.
For the week ending Mar 19th, our early view is -27 Bcf. Based on temperature forecasts for the next couple of weeks, this looks to be the last draw of the winter season. This draw would take the L48 storage level to 1755 Bcf (-254 vs LY, -69 vs. 5Yr)
We see production flat week-on-week despite an average daily loss 0.5 Bcf/d out of the Rockies due to the heavy snow that hit the region knocking out power on the CIG system last weekend. Small production gains from Texas and the Northeast offset the Rockies’ losses. The Rockies volumes still have not fully resumed as of this weekend. L48 production averaged 92.4 Bcf/d for the storage week.
We recorded L48 GWHDD increasing this past week by an average of 0.5 degrees to 17.5. This was not enough to substantially change ResComm consumption, but we did observe total regional gas consumption higher. This can all be attributed to the industrial natural gas usage starting to return. For the past week, industrial gas usage was higher by 3.0 Bcf/d, with a third of the gains coming from the Gulf region.
Deliveries to LNG facilities averaged 11.2 Bcf/d, which was +0.6 Bcf/d higher than the previous week. The increase came from Cameron, Freeport, and Corpus Christie all ramping up to near their peak levels.
Net the balance is tighter by 3.0 Bcf/d week-on-week.
Expiration and rolls: UNG ETF roll starts on Apr 14th and ends on Apr 19th.
Apr futures expire on Mar 29th, and Apr options expire on Mar 26th.
This email, any information contained herein and any files transmitted with it (collectively, the Material) are the sole property of OTC Global Holdings LP and its affiliates (OTCGH); are confidential, may be legally privileged and are intended solely for the use of the individual or entity to whom they are addressed. Unauthorized disclosure, copying or distribution of the Material, is strictly prohibited and the recipient shall not redistribute the Material in any form to a third party. Please notify the sender immediately by email if you have received this email by mistake, delete this email from your system and destroy any hard copies. OTCGH waives no privilege or confidentiality due to any mistaken transmission of this email.