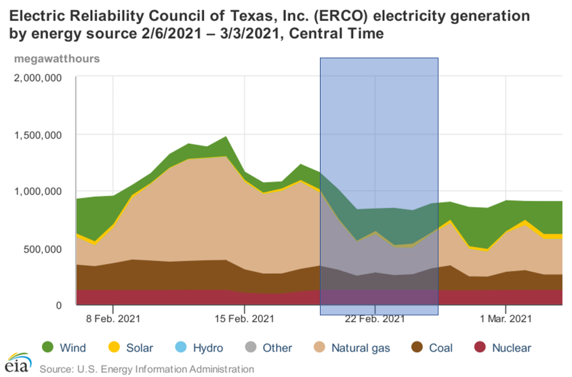
The EIA delivered a report on Thursday that was out of left field. The pull of 98 Bcf, roughly 40 Bcf lighter than the market, was nowhere near reality. This was the 2nd wild report from the EIA this week. This crude report on Wednesday’s stated a massive 21+ MB build, while the market was looking for a small crude draw, around 2-3 MB.
So what do we make of this report? Hard to understand the South Central storage numbers which showed net-zero storage activity (Salt +9, Non-salt -9). We were estimating a total draw of 142 Bcf, which puts our number off by an average of 6.3 Bcf/d.
On Thursday Platts wrote that “The extent of the disconnect between the EIA and the market is possibly the largest it’s ever been in the shale era, likely because of the compounding uncertainties related to the recovery of both production and demand in the wake of the mid-February cold front that brought massive volatility to the US gas market….”
Seems like they have no idea either, but the EIA says they produce a concrete number each week.
I received a note from a contact at the EIA on Thursday evening.
“We survey 100% of all volume in the Pac and 97% of everything else. Every week. We are having no issues with respondents. Everyone else sees at best about 60% of what we see … We are counting and others are estimating and sometimes guessing”
My partner at enelyst.com, John Sodergreen, com also got a note from the EIA on Thursday and got the following response from Rob Merriam. [FYI -WPSR is Weekly Petroleum Status Report and WNGSR is Weekly NatGas Storage Report]
“Response rate was again quite good, even higher than the WPSR yet again this week. (You do the math!) While we don’t collect or report all the same supply/disposition elements to support our WNGSR storage data to have the same quantitative puzzle elements we have for WPSR, we do carefully assess both the reported data along with the key factors that could drive our weekly gas working storage estimate. And like crude oil, those key elements all supported a much smaller withdrawal than the prior week, compared to what we reported with the two-week-ago freezing weather in Texas and the Mid-West. This past week, temperatures and population-weighted HDD moderated across the Lower 48. Our intel sources showed declines in use across every sector: residential, commercial, industrial, and electric utility; and as noted above, our intel showed an uptick in drilling activity, all of which support a much smaller draw on inventories. As with our crude oil review, we would have noticed errant reporting by a few respondents large enough to have driven us to grossly misstate the U.S. totals this week, which implies that we likely saw many respondents showing the same trends in their data, and which therefore gives us much higher confidence in the accuracy of our estimate.
Last, as you know, if there were to be any revisions to this week’s natural gas data, we’d apply them per our revision policy that you can review from our WNGSR website.”
So no clear reason why we all missed. But we got to take the EIA at their word. I’ve questioned them in the past and they have consistently communicated that they receive a near-complete dataset each week. They are confident in their assessment and so we got to believe it.
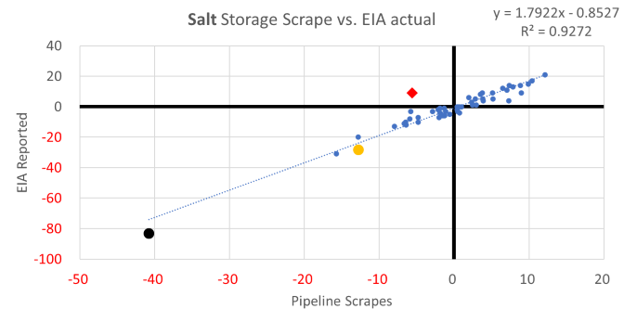
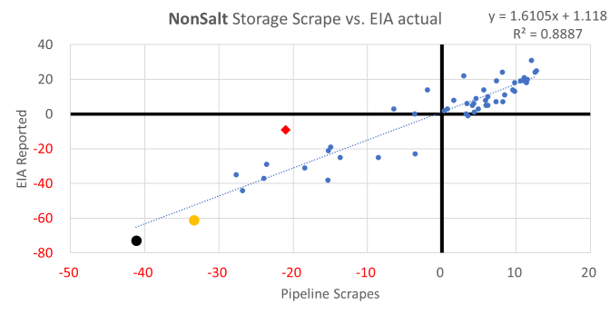
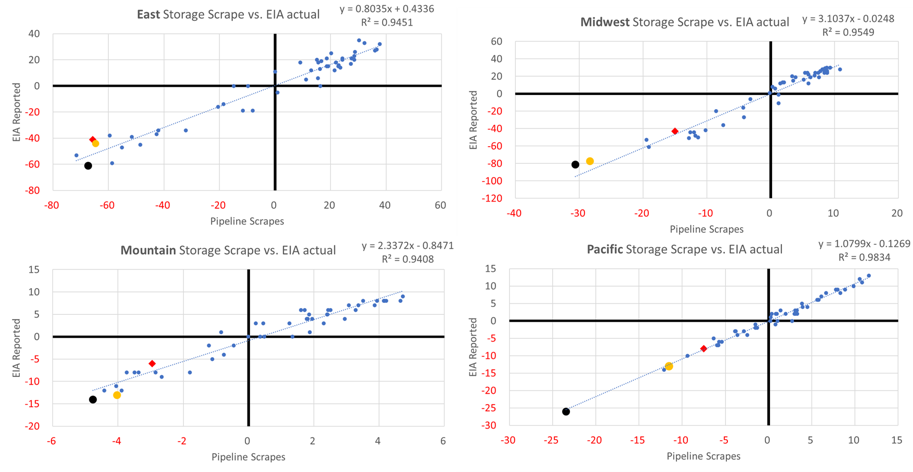
I dived into the South Central storage data (of what we can see) to show how wrong this number feels. The following charts show the Salt and NonSalt storage scrapes vs. EIA reported numbers. We do not have a very clear view of pipeline receipt and delivery activity in Texas (which is part of this big mess), but in general the pipeline flow model has a good fit.
x-axis = pipeline scrape data (what we can see daily/weekly from the pipeline data)
y-axis = EIA reported data
RED Diamond = Week Ending Feb 26th (Last week)
BLACK Dot = Week Ending Feb 19th (F’ing cold week)
Yellow Dot = Week Ending Feb 12th (Week before the tundra met Texas – normal week)
[Note: the same graphics for all the other regions are a couple of pages down]
It’s pretty clear that RED Diamonds do not fit.
There is clearly something wrong in the South Central numbers this week. I have not read anything insightful on this number yet, other than the EIA is wrong. Here are my theories. I believe it would have to be a combination of some of these events to get to a 6.3 Bcf/d miss:
1) storage operators report incorrectly the week prior and had some make numbers in the report. The black dots above show that both the salt and nonsalt were over-reporting a draw.
2) production was stronger than anticipated due to ethane rejection. The hefty premium in cash/balmo premium could have pushed producers to push ethane into the gas stream.
3) a burst of production after a major freeze-off event as the gathering lines and other infra open up. The longer the freeze-off the more pressure builds up underground; hence last week was like uncorking event. Note that we saw a massive crude build this past week as well: +21 mmbbls
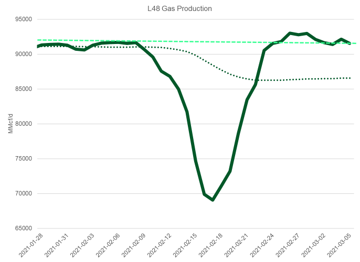
Here is the production data from BNEF. As seen, production was higher (mainly from TX/NM and the Midcon) after the cold event.
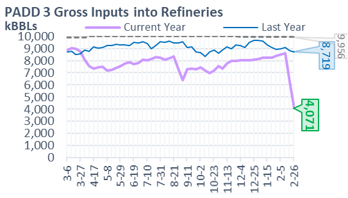
4) Nat gas usage was lower than expected. Padd3 Refinery utilization was off by a further 22% week-on-week to only 41%.
5) wind roared back, while natgas backed off.
Here are the rest of the regions:
Fundamentals for the week ending Mar 05: After the 2nd highest pull in a storage week, this week we get an ultra loose storage report. Hard to make sense of it, and it likely to add some volatility to this coming weeks report. If the 98 Bcf was accurate, then most analyst will have to lower their estimates for next week (substantially). On the flip side, if this past week was inaccurate then we could see some of the correction (or maybe even an official revision) show up in the report for week ending March 5.
We assume the EIA was correct, but we look at the error of the past 4 weeks to adjust our raw estimate. Our early view for the upcoming storage report is a -51 Bcf withdrawal for the lower 48. This would take storage levels to 1794 Bcf (-256 YoY, -140 vs 5Yr). The industry estimates for this report range between -110 to -38 according to The Desk.
For week ending Feb 26, supply came back strong after the major cold freeze-off event. Luckily no long lasting impacts. L48 production rose from 85.0 Bcf/d to 92.3 Bcf/d by the end of the week. On average L48 production rose by 7.3 Bcf/d from the previous week. As noted above, production came back higher than pre-cold levels. This burst of production was driven by TX/NM and the Midcon region.
We recorded L48 GWHDD decreasing by an average of -3.7 to 20.2. With the warmer termps, total gas consumption decreased accordingly by an average of 5.9 Bcf/d to 92.2 Bcf/d. For this past week, power was higher by 0.9 Bcf/d. (I heard some folks in Texas have their AC on during the day, and heat on a night.) RC and Industrial were both the lower. RC was lower by 6.7 Bcf/d WoW, while Industrial was lower by 0.4 Bcf/d.
Deliveries to LNG facilities averaged 10.1 Bcf/d, which was +2.2 Bcf/d higher than the previous week. LNG operators were facing issues with dense fog at the beginning of the week, but all systems look go as of Friday.
Net the balance was looser by 9.1 Bcf/d week-on-week.
Expiration and rolls: UNG ETF roll starts on Mar 15th and ends on Mar 18th.
Apr futures expire on Mar 29th, and Mar options expire on Mar 26th.
This email, any information contained herein and any files transmitted with it (collectively, the Material) are the sole property of OTC Global Holdings LP and its affiliates (OTCGH); are confidential, may be legally privileged and are intended solely for the use of the individual or entity to whom they are addressed. Unauthorized disclosure, copying or distribution of the Material, is strictly prohibited and the recipient shall not redistribute the Material in any form to a third party. Please notify the sender immediately by email if you have received this email by mistake, delete this email from your system and destroy any hard copies. OTCGH waives no privilege or confidentiality due to any mistaken transmission of this email.