This past week we start with some bold statements made by both the IEA and EU about minimizing Europe’s reliance on Russian natural gas and oil. The EU imports 90% of its gas consumption, with Russia providing around 45% of those imports, in varying levels across the Member States. Russia also accounts for around 25% of oil imports and 45% of coal imports.
Let’s start with the EU Commissions’ plan. They presented a to reduce reliance on Russian natural gas by two-thirds by the end of this year, and completely independent of all Russian fossil fuels by 2030. As seen in the map below, Russian natural gas pipelines make their way deep into Europe.
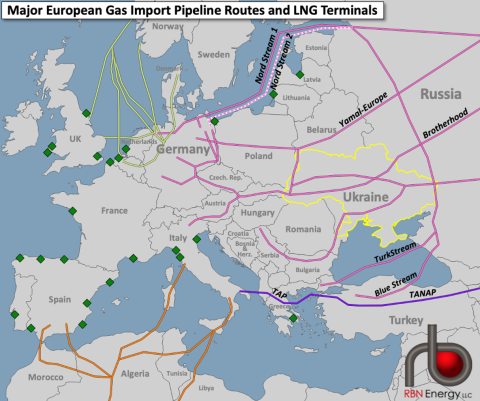
Source: RBN Energy
Breaking the reliance can be done, but it seems like it will come with a hefty price. Here are the 3 major steps laid out:
Source: https://ec.europa.eu/commission/presscorner/detail/en/IP_22_1511
1) Increasing non-Russian gas supplies: In the short term, the EU will lean more heavily on the US, Australia, Qatar, and Africa (pipeline) while some EU countries may need to use more coal in the months ahead (yes, that means carbon emissions may rise in the short-term).
2) Storage level requirements: The Commission intends to present by April a legislative proposal requiring underground gas storage across the EU to be filled up to at least 90% of its capacity by October 1st each year (this is up from 30% now).
3) Reducing demand for gas: Start with turning down the thermostat for buildings.
With the measures outlined in this plan, the equivalent of around 63.5bcm of Russian gas could be replaced by the end of the year with more non-Russian LNG and pipeline imports and by boosting biomethane production. This could then increase to 103-128bcm by the end of the decade.
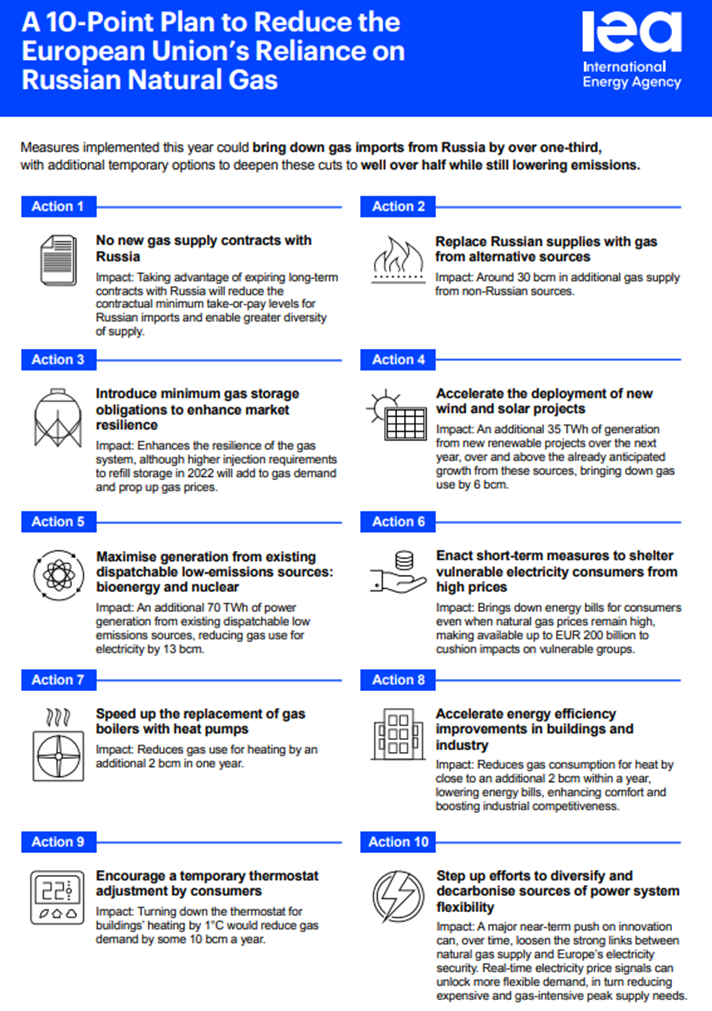
IEA proposed a combination of actions spanning gas supplies, the electricity system, and end-use sectors, which could support the bloc’s energy security and affordability, which it says are consistent with the European Green Deal.
IEA.org – A 10-Point Plan to Reduce the European Union’s Reliance on Russian Natural Gas
Source: https://www.iea.org/reports/a-10-point-plan-to-reduce-the-european-unions-reliance-on-russian-natural-gas
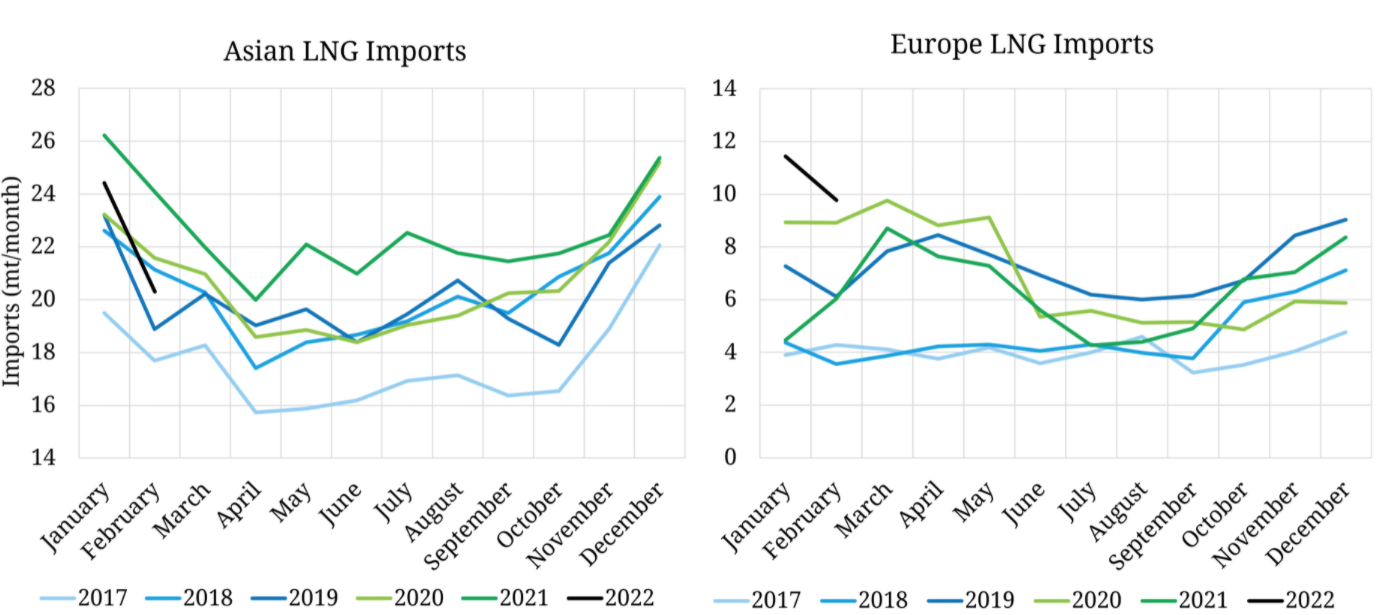
Finally, here is a good piece from Timera Energy on the battle between Europe and Asia for LNG:
“LNG imports into Europe remained at multiyear highs in February (~10 mt) at the expense of imports into Asia, which declined by 16% from 2021 levels. A combination of a mild winter, high prices stunting demand, a drawdown LNG storage, and a focus on coal imports has seen LNG imports into Japan, South Korea & India dropping to near 5-year lows in February. Chinese imports (the key driver of stronger Asian imports last year) have also declined from 2021 levels.
The traditional flexibilities in the European gas market have been exhausted (coal-gas switching, storage levels). The stage is set for Europe to move from being a global sink for LNG to a much more dynamic competitor, with JKM-TTF spreads the indicator to watch.”
Fundamentals for the week ending Mar 11:
The EIA reported a -124 Bcf withdrawal for the week ending Mar 4th, which came higher than market estimates.
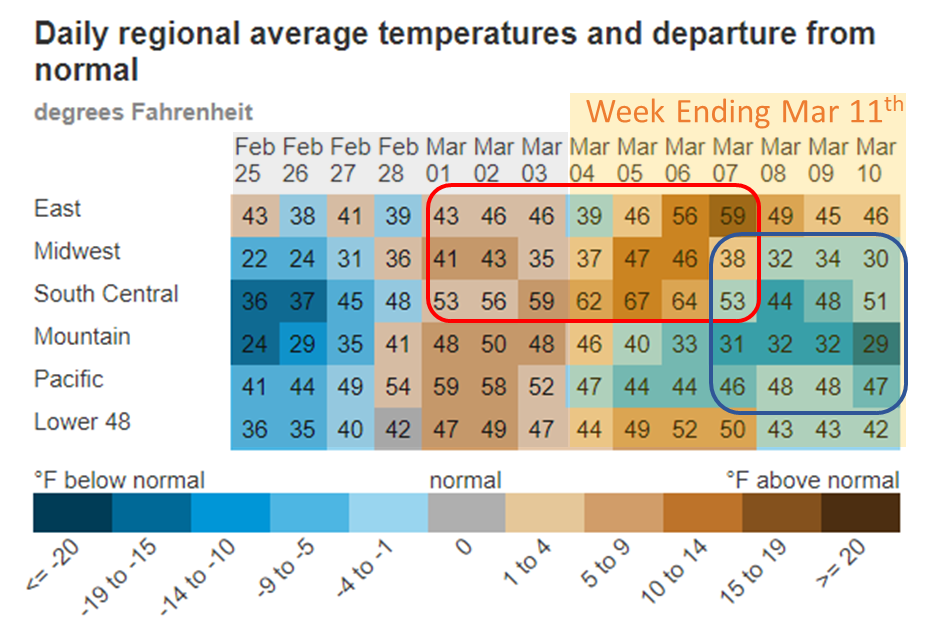
For the reported week, the weather shifted warmer across much of the country except large portions of the Mountain and South Central. This led to looser daily balances as overall consumption fell (-5.0 Bcf/d WoW).

One of the largest factors leading to the drop in consumption was a big hit on industrial consumption. We are unsure if this was strictly related to the change in weather, or if higher energy prices have lowered industrial activity. The reason this is concerning is that Industrial load (from the modeled pipeline data) dropped more week-on-week than ResComm load. This is one line item to continue to monitor (that being said, it is not that clear cut with low daily visibility through pipeline nomination data).
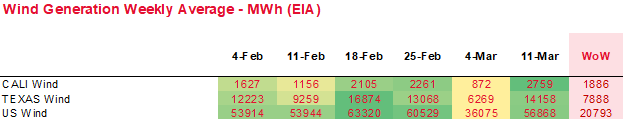
We should also quickly note the big changes in wind generation for the storage week. After a few consecutive weeks where wind generation was well above normal, we saw a steep decline in wind levels for this reporting period. Wind generation levels were 29% below normal.
This past week’s report continues to point to the tight market conditions. We estimate this report was ~7 Bcf/d tight vs LY (wx adjusted). [Note: this embeds the low wind experienced last week.]
For the week ending Mar 11th, our early view is -66 Bcf. This reporting period will take L48 storage level to 1,453 Bcf (-331 vs LY, -291 vs. 5Yr).
This week we see total consumption continue to drop with warming weather and rising wind. Temps across the country started the week well above normal levels, but ended the week on a cooler note. The net result was L48 GWHDD dropping by -3.0F relative to the previous week; resulting in a 5.0 Bcf/d drop in natural gas consumption for space heating (rescomm only). Industrial consumption also continued to drop this week by 1.7 Bcf/d.
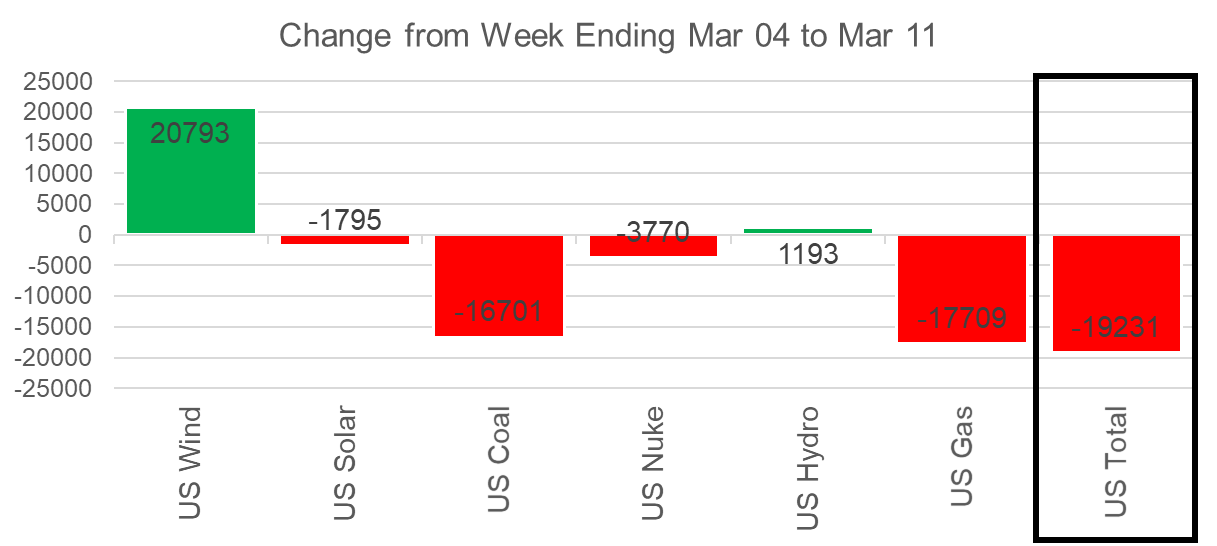
Power burns also dropped last week as a result of warming temps and rising wind generation. The wind generation likely played a larger role with a week-on-week increase of 21 GWh on average. If a 7.5 HR natural gas generator was perfectly offset by the increased wind, then we would see a drop of 3.5-4.0 Bcf/d of gas consumed.
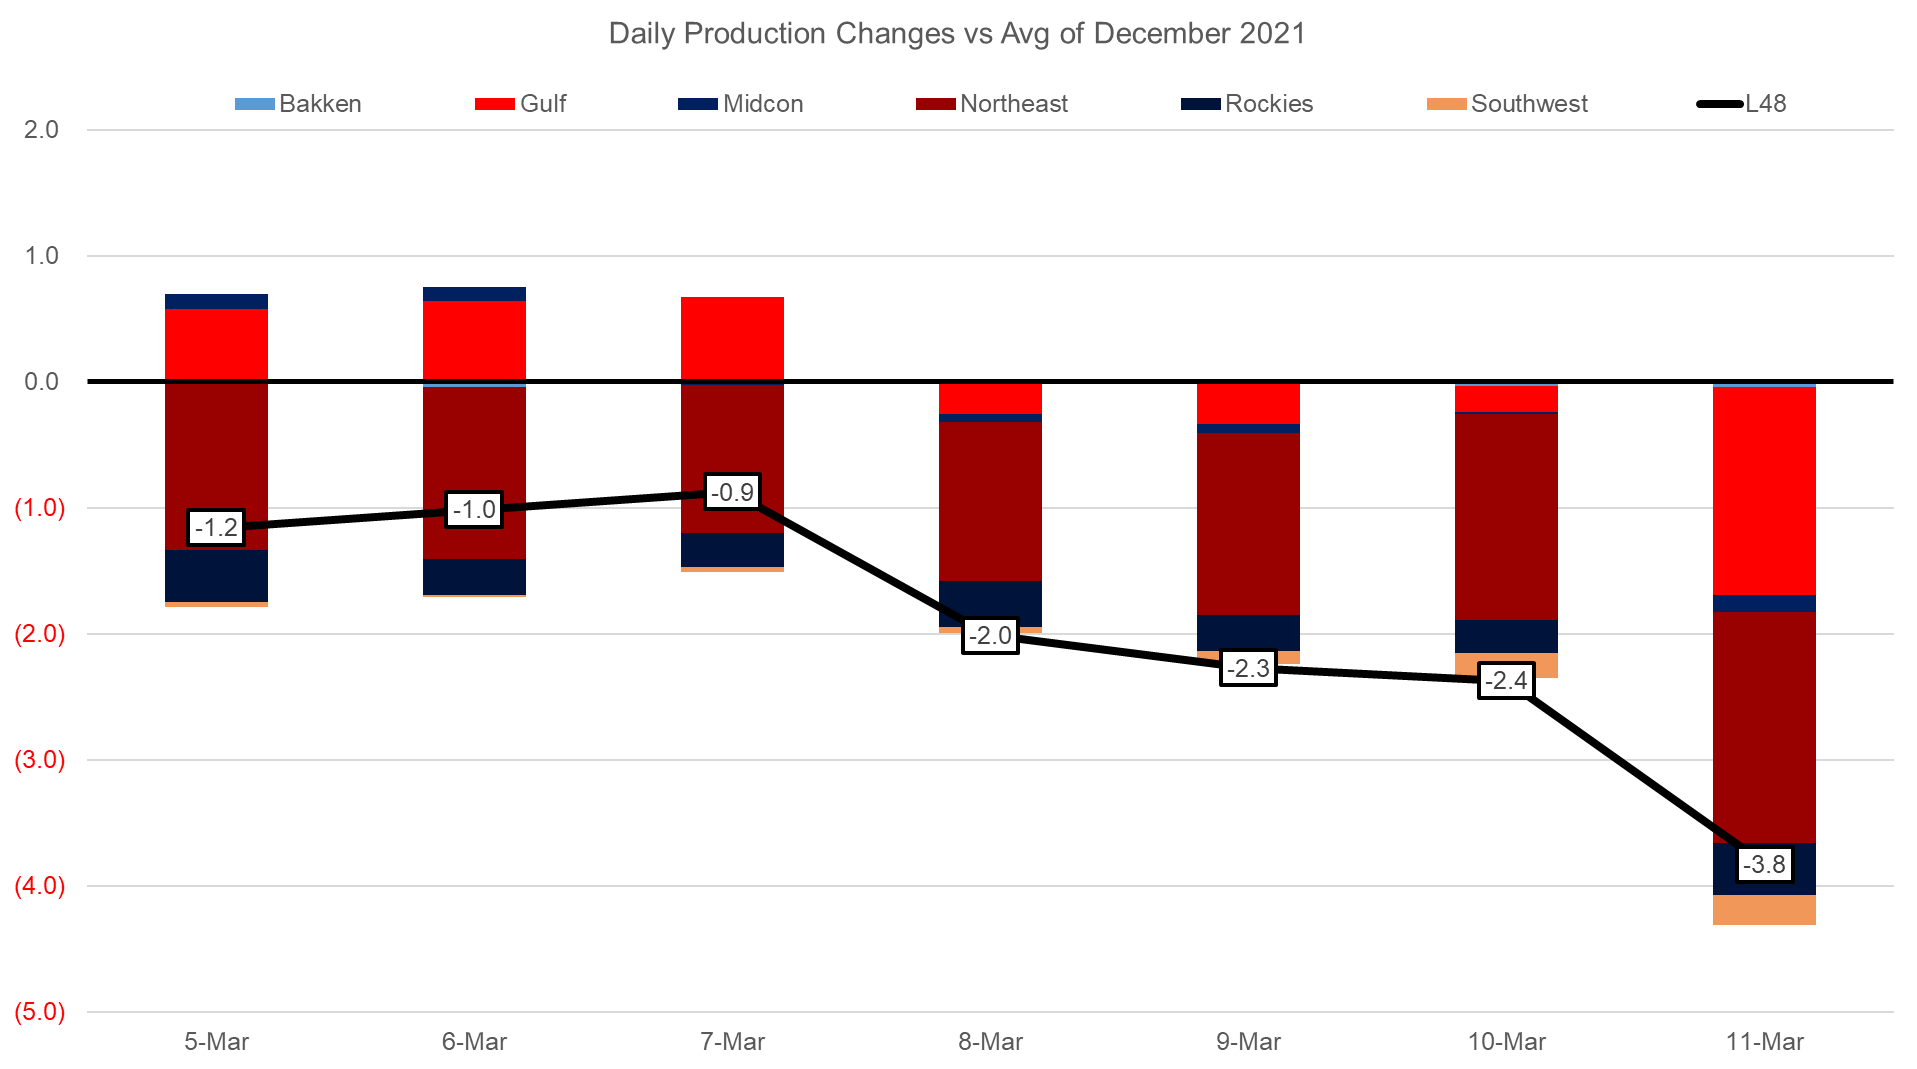
Domestic dry gas production was marginally higher (+0.6 Bcf/d) last week with production returning in the Northeast and Midcon early in the week with warmer than normal temps. As we move into Spring we expect to see freeze-off production in the Rockies and Northeast start to unfold. We typically see season-wide production shut-ins in the Rockies, but this year we saw the same phenomenon from the Appalachian basin.
That being said, cooler overnight temps over the South Central region on Friday sent production lower in West Texas.
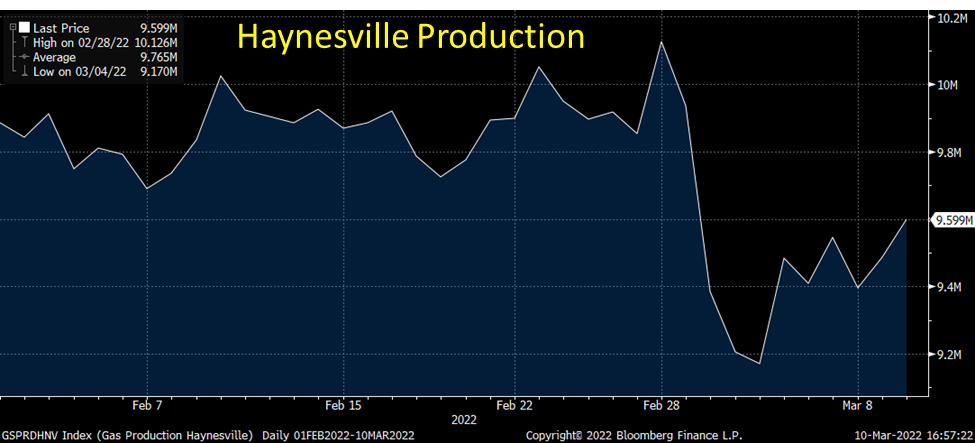
Lastly, we should note a ~ 0.5-1.0 Bcf/d drop in production out of the Haynesville basin. There is an unconfirmed rumor of a fire at a processing plant resulting in the region. There are non-critical notices posted by several regional pipes, but none refer to a processing plant issue. We will drop some notes in the daily emails if there are any updates on this.
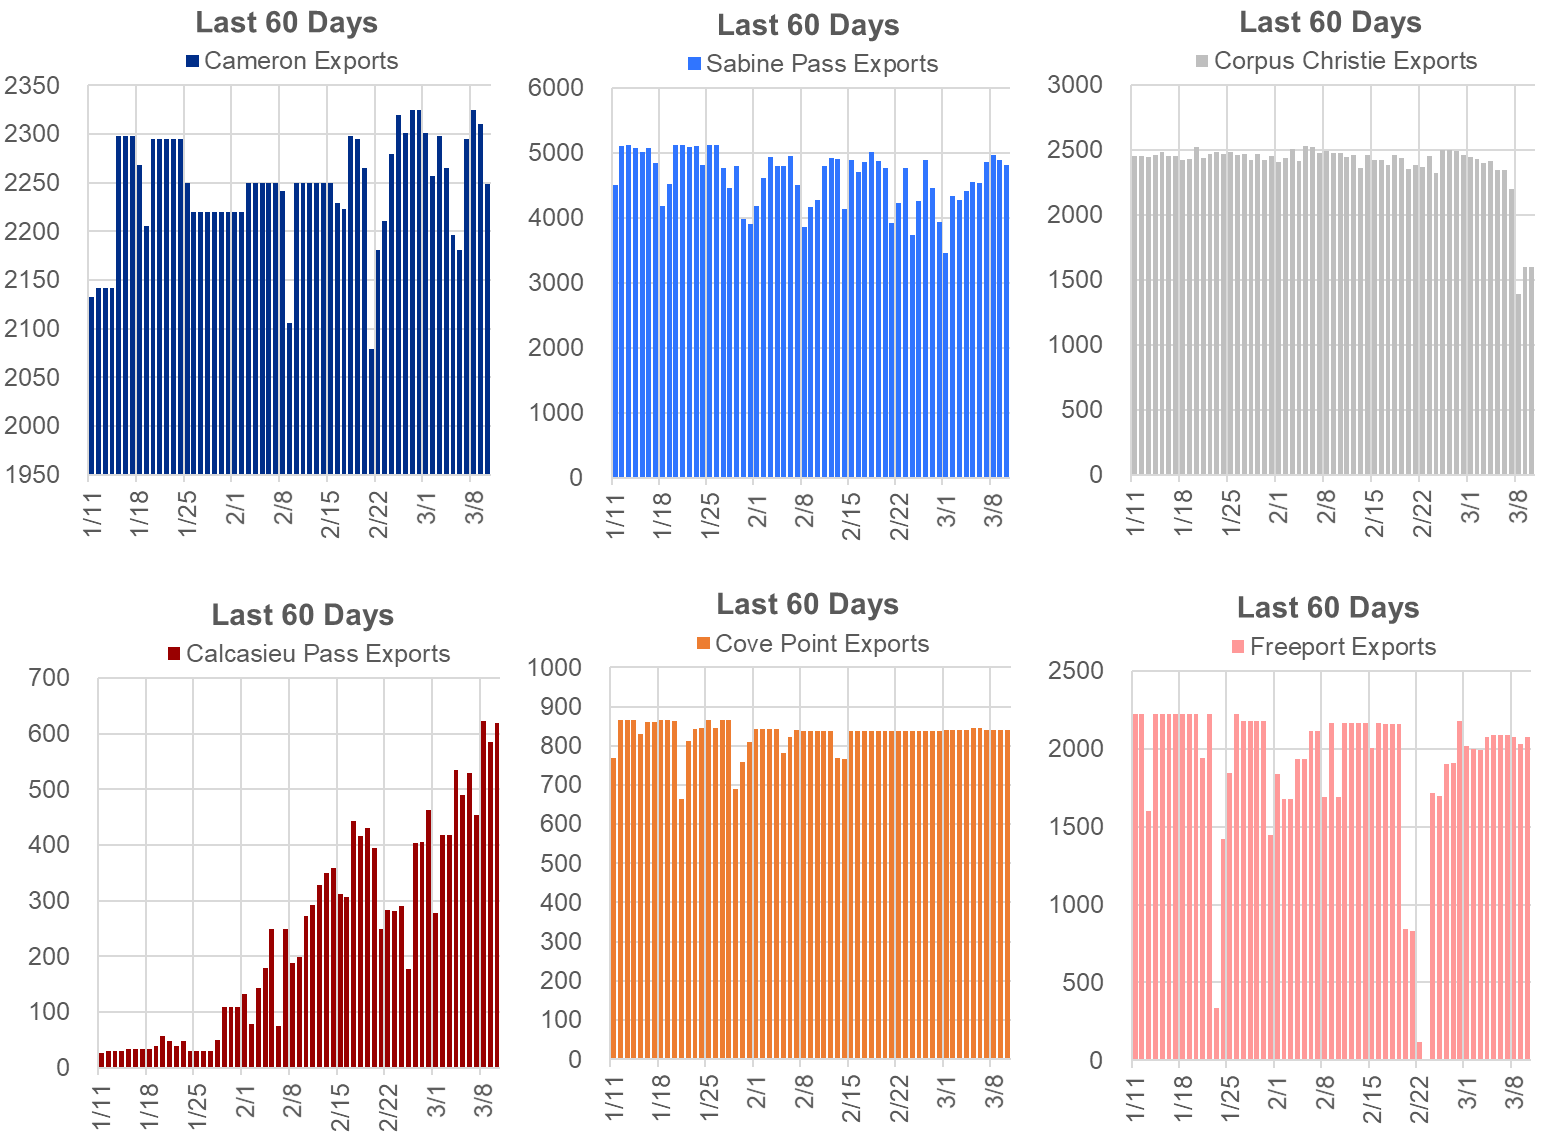
Deliveries to LNG facilities averaged 12.8 Bcf/d, which was 0.3 Bcf/d higher than the previous week. Although LNG deliveries were higher, Corpus Christi LNG was off. The total deliveries to the plant remained lower starting Mar 8th. There was ESD testing at the facility for a day, but that should have been completed. So it is unclear why the facility is still seeing subdued flows this morning. There was a similar drop in March 2021 which lasted approximately ten days.
Meanwhile, Calcasieu Pass LNG has been flowing over 0.6 Bcf/d at the end of the week.
The net balance was 7.8 Bcf looser week-on-week.
This email, any information contained herein and any files transmitted with it (collectively, the Material) are the sole property of OTC Global Holdings LP and its affiliates (OTCGH); are confidential, may be legally privileged and are intended solely for the use of the individual or entity to whom they are addressed. Unauthorized disclosure, copying or distribution of the Material, is strictly prohibited and the recipient shall not redistribute the Material in any form to a third party. Please notify the sender immediately by email if you have received this email by mistake, delete this email from your system and destroy any hard copies. OTCGH waives no privilege or confidentiality due to any mistaken transmission of this email.