This week we look at all the major spreads followed by nat gas traders, with our interpretation of what they all track.
We’ll cover the OCTJAN, OCTNOV, MARAPR, and APROCT with various charts to see how they look currently vs past years.
We’ll paste on the charts again at the end with different views.
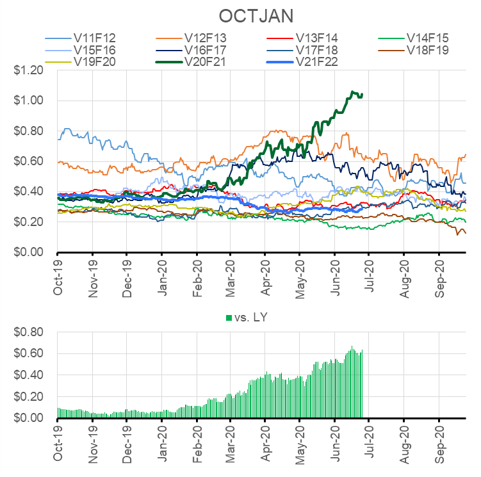
Let’s start by looking at the OCTJAN (VF). This spreads typically tracks the end of summer storage health, particularly measuring the level of natural gas in storage by Oct 31 for the upcoming winter.
The spread moves daily as we progress towards the expiration of the Oct contract (end of Sept). The Oct and Jan contract prices typically move in the same direction as traders track summer fundamentals and injection rates. The Oct contract is usually more volatile as we near expiration, while Jan prices are less volatile due to the lack of a concrete winter weather view.
When end of summer storage expectations are well below normal (the 5Yr average), the spread is narrow as Oct prices remain strong. On the flip side, if storage is projected to end summer above normal, then Oct prices usually weaken. The Oct prices can fall dramatically if storage levels are projected to break storage capacity levels, or exceed storage injection ratchets late in the injection season.
Prices help keep the market in check. A change in the price level change production economics , alter the power generation mix to increase power burns, and to adjust global LNG shipping economics.
Currently the OctJan is trading at $1.09, indicating that we are expected to hit severely higher storage levels.
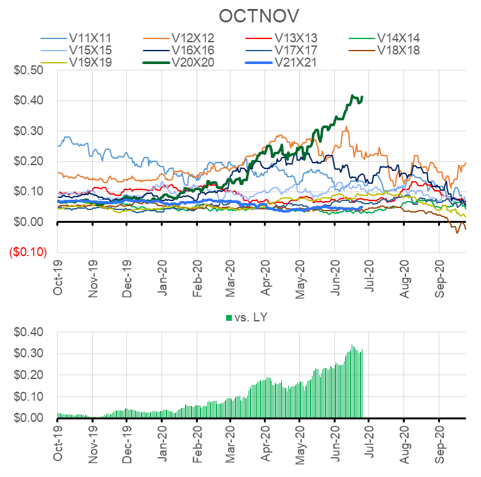
OCTNOV is similar, but can be a more variable as natural gas injections are normal for the first half of November.
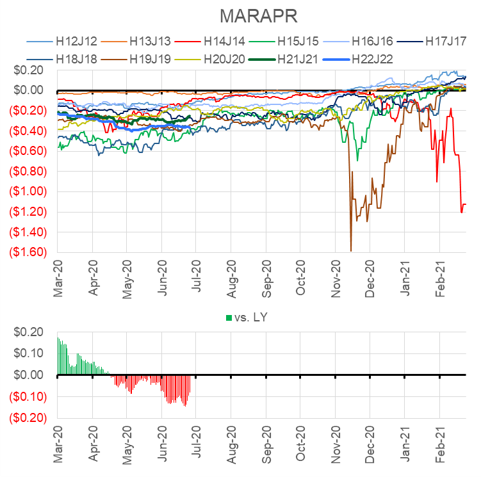
Next we look at the MARAPR spread. This spread typically tracks the end of winter storage levels, particularly measuring the level of natural gas expected to be in US storage by Mar 31. This spread is also referred to as the ‘Widow maker’ as this spread can blow out if fear sets in that the US will be short gas late in winter. To be more precise, the fear revolves around the lack of daily gas deliverability from storage to meet peak winter demand. As storage facilities empty out throughout winter, the storage facilities are not as pressurized leading to physical constraints that reduce the max daily volume that can be delivered.
Currently the MarApr is trading at -$0.24. Current spreads are wider than last year, indicating a tighter market despite projections of going into winter with high storage levels. The current view looks to assume production remains low, and return to a normal winter and LNG exports returning from the low summer levels. The spread usually flattens as we traverse winter and fear dissipates.
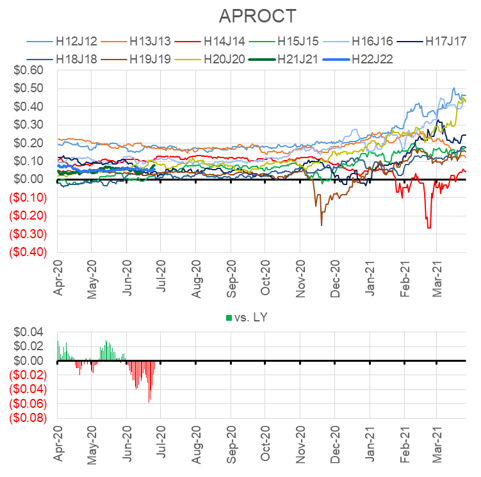
Finally, we cover APROCT. This spread typically tracks the summer injection season, particularly the amount of gas required to fill during the summer to get back to normal levels by Oct 31.
The spread is driven by the outlook on how we exit winter. The spread typically has a high correlation to how much we need to fill during the summer months to get to the 5Yr normal storage levels.
With a low end of winter storage projection, the spread is narrow as Apr prices remain strong to incent production and push coal back in the power stack. On the flip side, if storage is projected to be higher than normal at the end of winter, then Apr prices weaken opening up the spread.
Currently the AprOct is trading at $0.081, indicating that we will be exiting winter a low levels requiring a strong injection season during Summer 2021.
Fundamentals for week ending June 26: Our early view for the upcoming storage report is a +75 Bcf injection for the lower 48. This would take storage levels to 3087 Bcf
US natural gas dry production is slightly higher week-on-week with domestic production averaging 84.4 Bcf/d for the week. Average weekly production is 0.1 Bcf/d higher than 4 weeks ago.
Natural gas demand jumped this past wee as weather turned hotter across major demand regions. Residential and commercial sector consumption decreased by 0.6 Bcf/d, while power consumption increased by 6.6 Bcf/d.
Canadian imports were lower last week averaging 4.2 Bcf/d.
Mexican exports rose to an average of 5.9 Bcf/d.
Deliveries to LNG facilities increased week-on-week to 4.0 Bcf/d.
Expiration and rolls: UNG ETF roll starts on July 12th and ends on July 17th.
August futures expire on July 29th, and July options expire on July 28th
This email, any information contained herein and any files transmitted with it (collectively, the Material) are the sole property of OTC Global Holdings LP and its affiliates (OTCGH); are confidential, may be legally privileged and are intended solely for the use of the individual or entity to whom they are addressed. Unauthorized disclosure, copying or distribution of the Material, is strictly prohibited and the recipient shall not redistribute the Material in any form to a third party. Please notify the sender immediately by email if you have received this email by mistake, delete this email from your system and destroy any hard copies. OTCGH waives no privilege or confidentiality due to any mistaken transmission of this email.