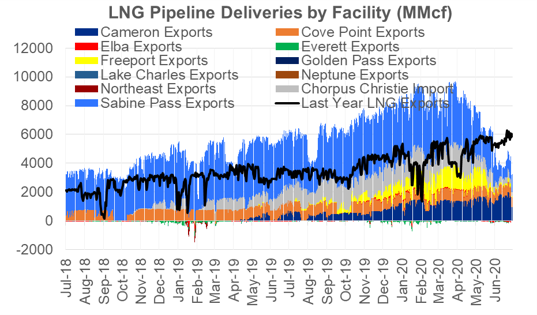
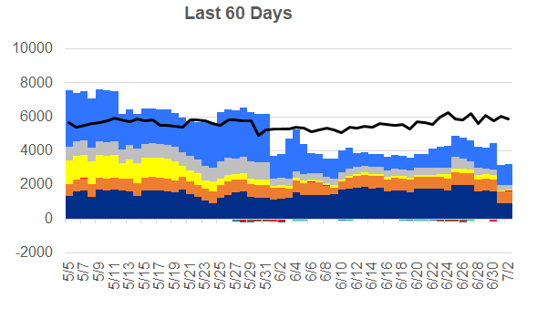
With the start of July we see a big drop in natural gas deliveries to LNG facilities. The average deliveries on July 1st dropped to 3.2 Bcf/d, or approximately 1/3 of total US export capacity. The LNG story has continuously evolved this year starting with a warmer than normal winter in Europe that left natural gas inventory levels above normal, and then COVID shook up global demand.
With June now behind us we see that the average volume delivered was 4.03 Bcf/d – 2.7 Bcf/d lower than May 2020, and 1.5 Bcf/d lower than last June.
Our estimate on total cargo cancelled for June is 38. Here is how we get there:
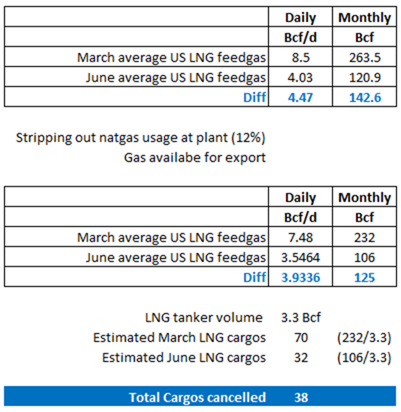
Using the same logic, we estimate 45 cargos to be cancelled in July using 3.2 Bcf/d as the average delivered LNG feedgas throughout the month.
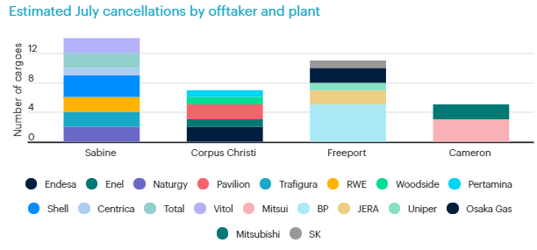
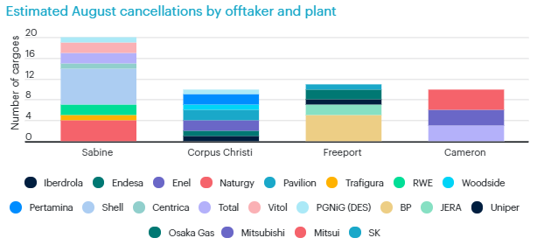
ICIS released some data this week to show similar numbers, and give a longer term perspective. They have done a great job of aggregating and visualization the information they received. Below is a quick summary of cancellations by offtaker and plant.
July
“Between 40 and 50 cargoes could be cancelled, and the figure could go higher as some market sources see this as the peak for 2020 curtailments. As many as 21 cargoes from Sabine Pass and Corpus Christi and more than 10 cargoes from Freeport were among the cancellations heard.”
August and Beyond
“As many as 50 cargoes in August could be cancelled.”
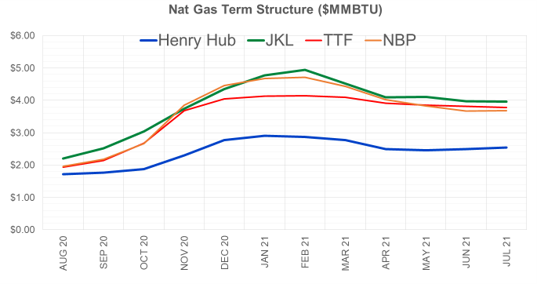
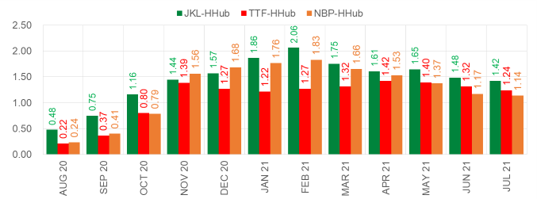
Finally we end off with global natural gas prices, and the spreads to Henry Hub. With current spreads, it is likely we see cargo cancellation in September and October as well. We do not have a concrete number on cancellation for that timeframe as physical market decisions have yet to be made for the loadings in those months.
Fundamentals for week ending July 3: Our early view for the upcoming storage report is a +60 Bcf injection for the lower 48. This would take storage levels to 3137 Bcf
US natural gas dry production remained flat week on week with domestic production averaging 84.4 Bcf/d for the week. Average weekly production is 0.1 Bcf/d higher than 4 weeks ago.
Natural gas demand jumped this past week as weather continues on the hot. Residential and commercial sector consumption seems to have hit a bottom with no change week-on-week, while power consumption increased by 1.4 Bcf/d.
Canadian imports were lower last week averaging 4.1 Bcf/d.
Mexican exports averaged of 5.8 Bcf/d.
Deliveries to LNG facilities averaged 4.0 Bcf/d.
Expiration and rolls: UNG ETF roll starts on July 12th and ends on July 17th.
August futures expire on July 29th, and July options expire on July 28th
This email, any information contained herein and any files transmitted with it (collectively, the Material) are the sole property of OTC Global Holdings LP and its affiliates (OTCGH); are confidential, may be legally privileged and are intended solely for the use of the individual or entity to whom they are addressed. Unauthorized disclosure, copying or distribution of the Material, is strictly prohibited and the recipient shall not redistribute the Material in any form to a third party. Please notify the sender immediately by email if you have received this email by mistake, delete this email from your system and destroy any hard copies. OTCGH waives no privilege or confidentiality due to any mistaken transmission of this email.