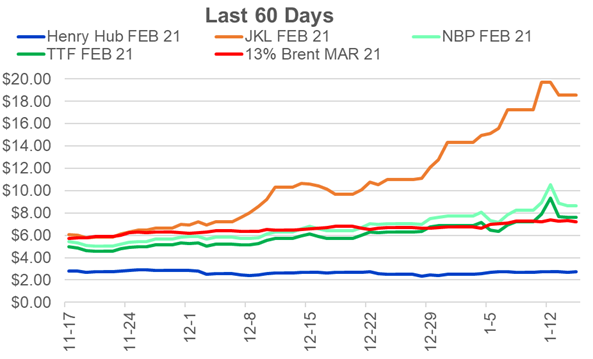
This week, we touch on the volatility in European gas markets, with prices exploding earlier this week. The Asian LNG markets along with cooler weather are weighing on TTF and NBP prices.
Lots of factors adding to the price surge, but the main issue is the cold weather across Asia and Europe driving natural gas demand. This was an image we posted earlier in the week showing temps for the first third of the year.
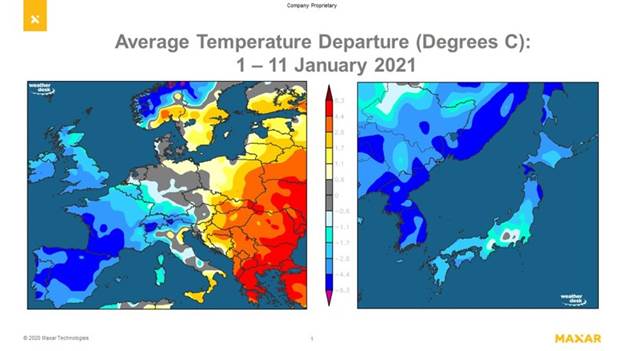
Source: Maxar
The sustained cold weather has lifted gas demand with growing concern over very cold temperatures later in January and February.
Going into the winter, European storage was maxed out. Additionally, there were large storage supplies available in Ukraine. The cold wither and LNG competition with Asia has left storage levels being drained quickly. We are currently sitting just about the 5 Yr Average, and at a large deficit to last year.
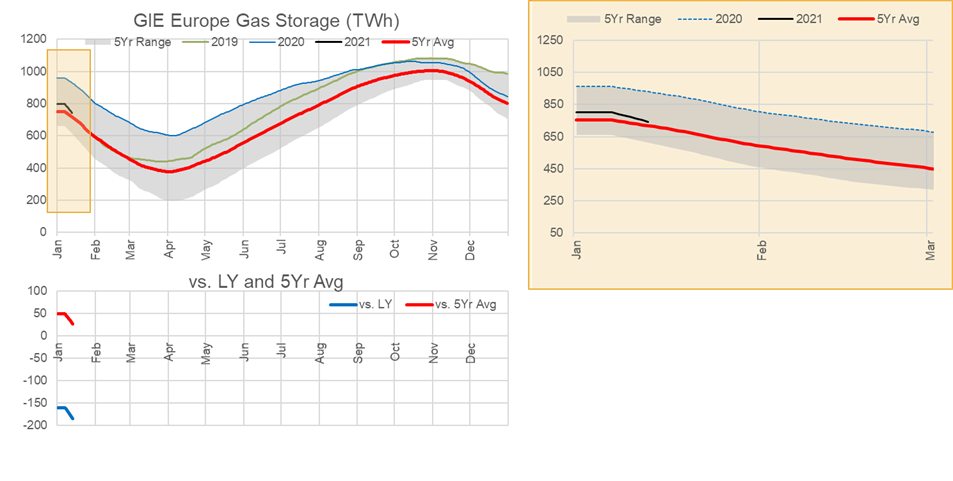
Source: Analytix.ai
Europe may require more LNG to cover higher demand – in which case it must compete with Asian markets that are trading at even higher levels. At the moment the strong Asian prices are pulling LNG cargos away. As can be seen in the chart below, European LNG imports levels in January have been close to the 5Yr average. This is nowhere close to the levels seen in 2019 and 2020.
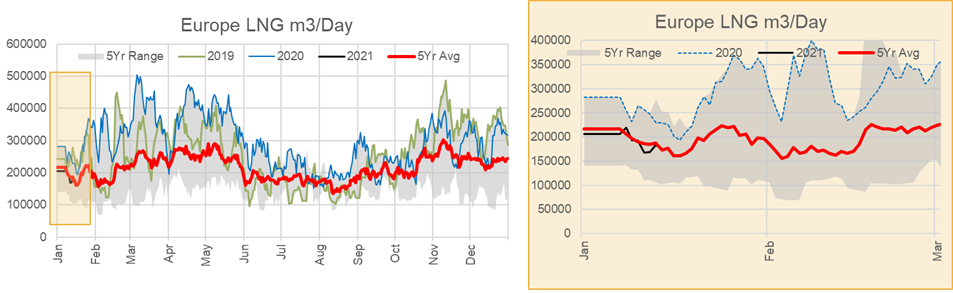
Source: Analytix.ai
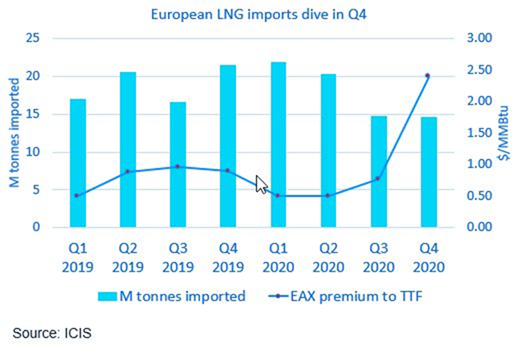
This was also the case in Q4 2020. The chart from ICIS below shows ICIS spot East Asia (EAX) LNG Index premium to the TTF. The EAX premium to TTF has drawn LNG away from Europe in Q4 ’20 and this is exactly what the story is for Q1 so far.
Fundamentals for the week ending Jan 15: Our early view for the upcoming storage report is a -180 Bcf withdrawal for the lower 48. This would take storage levels to 3016 Bcf (+43 YoY, +205 vs 5Yr). The industry estimates for this report range between -192 to -164 according to The Desk.
For this past week, supply was lower week on week, with lower production out of Texas leading the way. The drop could be related to freeze-offs as parts of Texas got very cool with snow showing up. The other big change in the balances was the jump in both Power and ResComm usage as cooler hit many regions. Power was up 2.2 Bcf/d WoW, and RC was up 3.8 Bcf/d WoW. Deliveries to LNG facilities averaged 10.6 Bcf/d, down 0.3 Bcf/d WoW. Net the balance were tighter by 6.7 Bcf/d week-on-week.
Expiration and rolls: UNG ETF roll starts on Jan 15th and ends on Jan 19th.
Feb futures expire on Jan 27th, and Jan options expire on Jan 26th.
This email, any information contained herein and any files transmitted with it (collectively, the Material) are the sole property of OTC Global Holdings LP and its affiliates (OTCGH); are confidential, may be legally privileged and are intended solely for the use of the individual or entity to whom they are addressed. Unauthorized disclosure, copying or distribution of the Material, is strictly prohibited and the recipient shall not redistribute the Material in any form to a third party. Please notify the sender immediately by email if you have received this email by mistake, delete this email from your system and destroy any hard copies. OTCGH waives no privilege or confidentiality due to any mistaken transmission of this email.