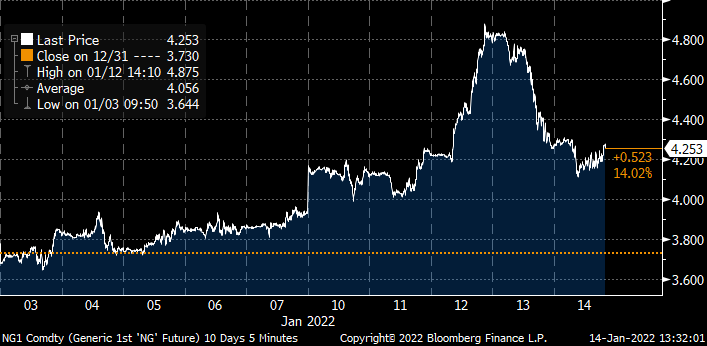
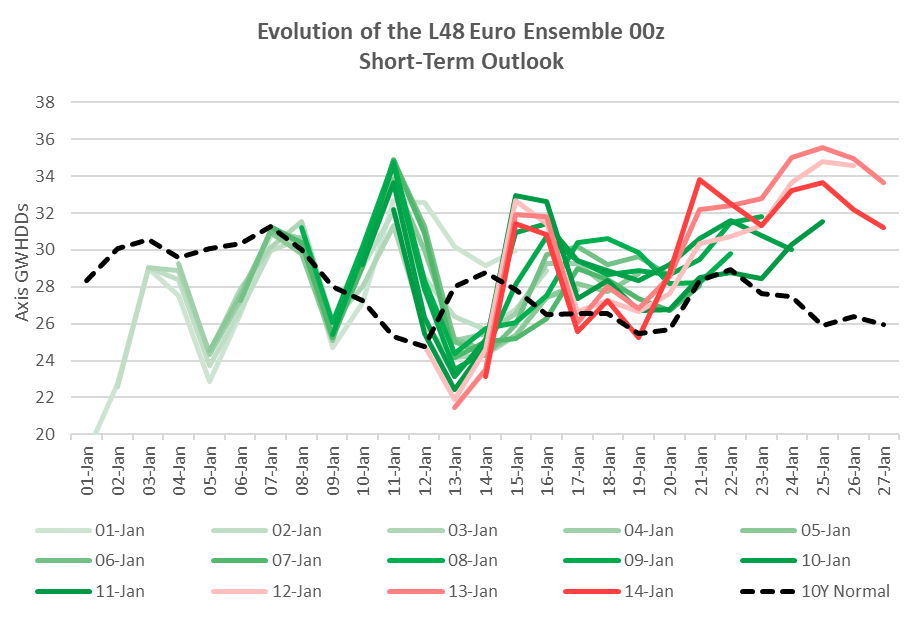
Weather is in full control at the moment. The daily changes in the 15-day forecast are continuously moving prices. Here is the evolution of the 00z Euro Ensemble since Jan 1st. As can be seen this past week we shot up a lot cooler on the back end of the forecast which looked to put fear into how Feb will turn out.
Source: Analytix.ai
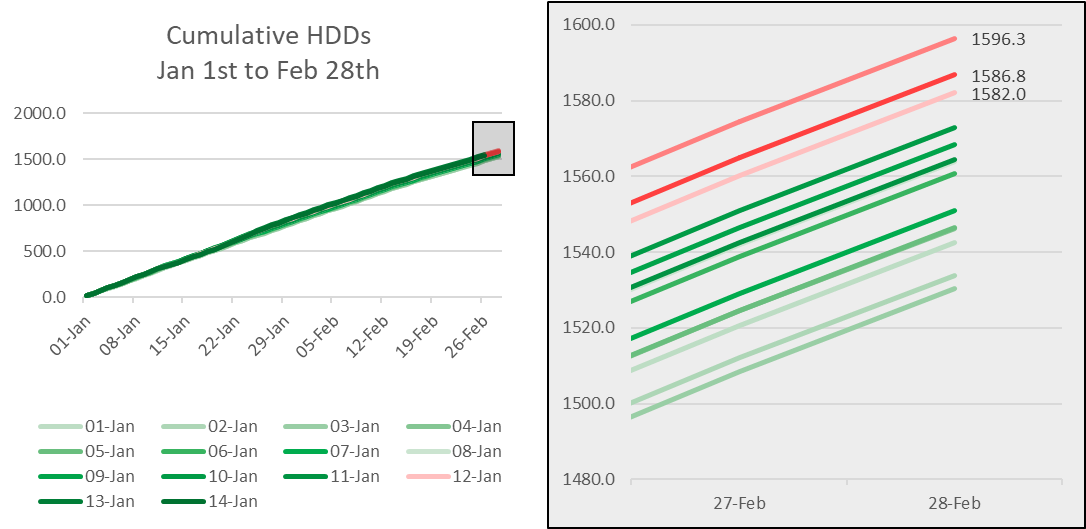
As we have done in the past, we matched up the actuals, 15-day forecast, and 10Y normal to come up with the cumulative GWHDD over a period of time. This time we have chosen the period of Jan 1st to Feb 28th. As can be seen, the range of cumulative GWHDDs during the time frame ranges from 1530 GWHDDs on Jan 3rd to 1596 GWHDDs on Jan 13th.
Source: Analytix.ai
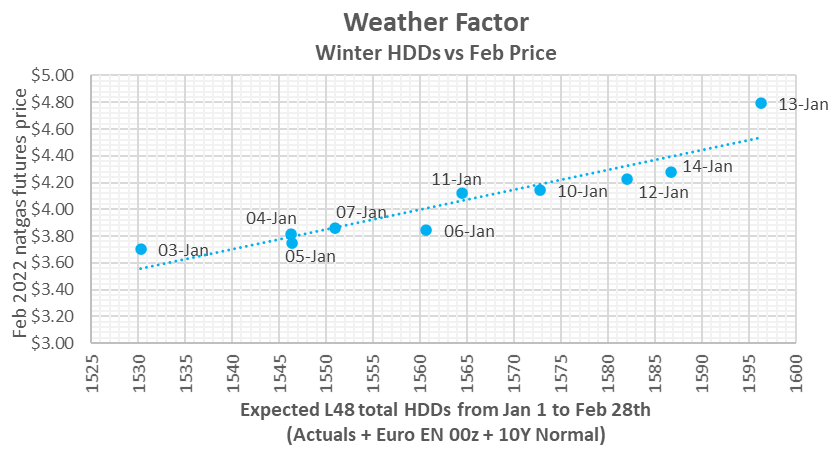
With each weather move, we saw price respond accordingly. This chart show the cumulative GWHDDs (Jan 1 to Feb 28) vs. daily closing Feb contract price.
Source: Analytix.ai
We end this section with some commentary and Feb outlook from Maxar Weather (posted on enelyst.com):
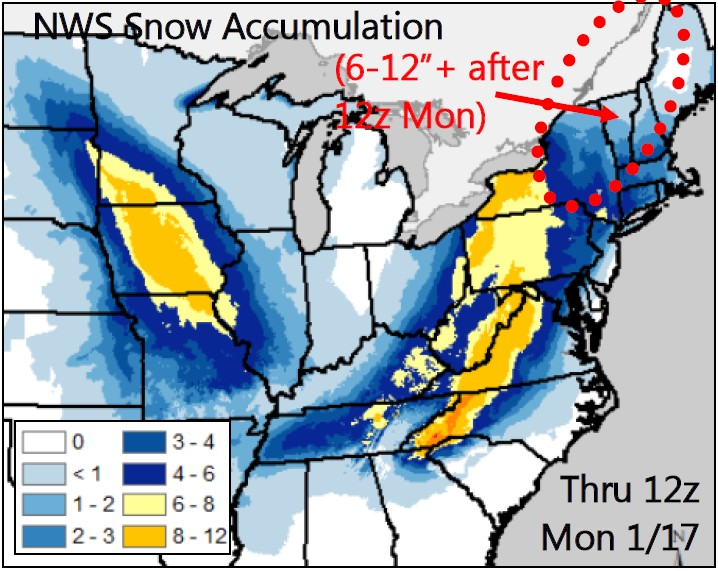
A wave of low pressure currently over the Central Plains will bring a swath of moderate to heavy snow to areas of the western Midwest today, with 6-12″ possible centered over Iowa. The storm will strengthen as it dives into the Southeast tomorrow before tracking up the East Coast on Sunday into Monday, bringing significant snow and ice hazards to areas of the South and Mid-Atlantic.
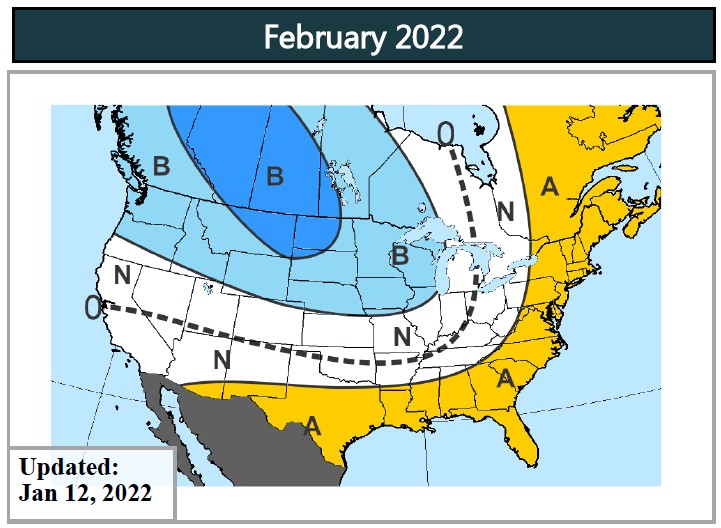
We ultimately expect the pattern to take on –PNA characteristics, given the oceanic support from La Niña and the broader North Pacific –PDO. The 11-15 Day changes in the Pacific may be hinting that the onset of this transition. The –PNA correlates warm from the South to Mid-Atlantic and cold from the Northwest to North-Central, and this is echoed in our February outlook in which no changes were made this week.
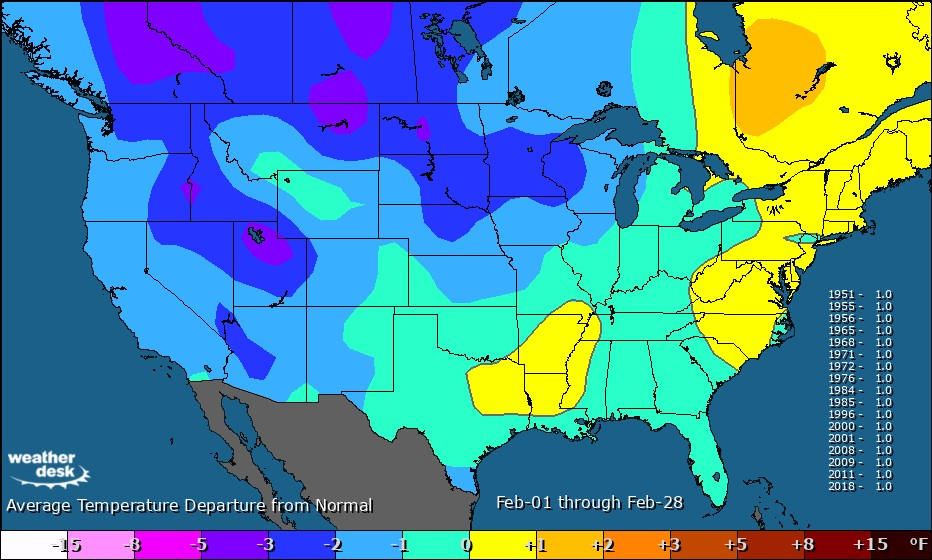
Regarding colder than normal Januarys and what followed in February. Of the 17 La Niñas back to 1950, five turned warmer than normal in February and the other 12 colder:
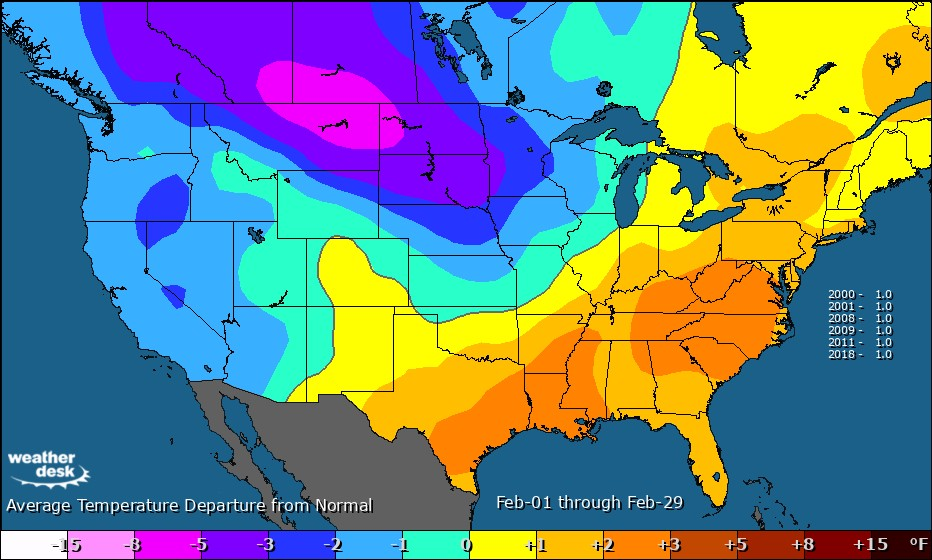
When narrowing this list of analogs to 2000+, there’s more of a split with three colder and three warmer than normal Februarys:
Fundamentals for the week ending Jan 14:
The EIA reported a -179 Bcf withdrawal for the week ending Jan 7th, which was mostly in line with analyst estimates.
The biggest moving piece in the reported week was a drop in production (-3.2 Bcf/d WoW) natural gas consumption (+18.6 WoW). That makes sense based on the sudden cold weather at the start of the year. The deep freeze cut production from the Bakken down to the Permian basin. The majority of the increase in natural gas consumption came from increased residential heating usage and industrial restarting after the holiday week. We see those two categories jump by 15 Bcf/d week-on-week.
The deep freeze cut production from the Bakken down to the Permian basin. The majority of the increase in natural gas consumption came from increased residential heating usage and industrial restarting after the holiday week. We see those two categories jump by 15 Bcf/d week-on-week.
Power burns were also much higher with the cooler weather and the start of business again. Overall power generation was 10% higher, with nat generation meeting almost half that increase.
Source: Analytix.ai
For the week ending Jan 14th, our early view is -197 Bcf. This reporting period will take L48 storage level to 2,819 Bcf (-54 vs LY, +38 vs. 5Yr).
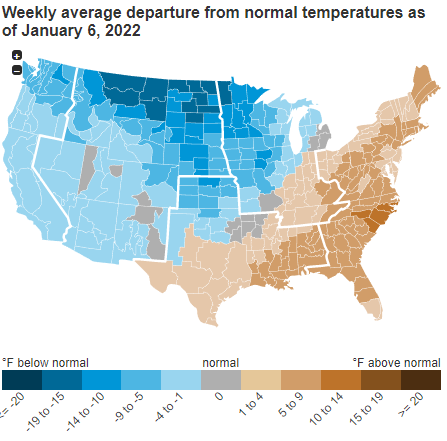
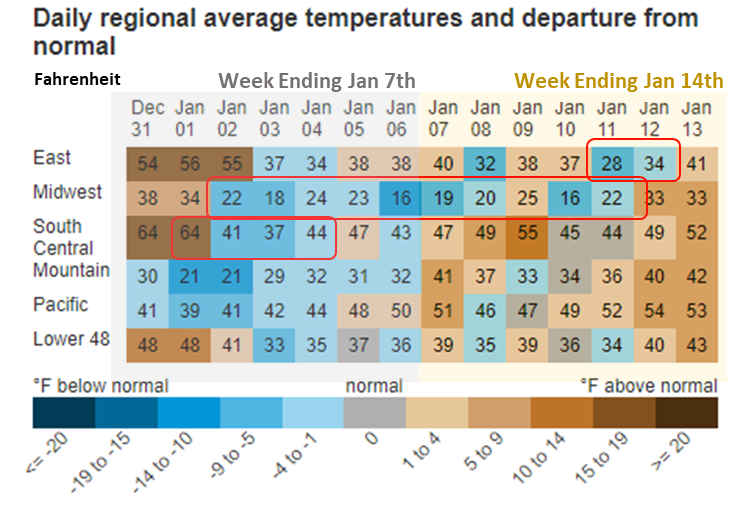
This past week we see total consumption once again rise with much cooler temps moved eastwards to more highly populated areas. Total GWHDDs increased by 2.6F WoW leading to both rescomm demand jumping by 2.9 Bcf/d WoW. Here is a good view from the EIA showing the outright temps over the past two weeks. As see the South Central had a severe drop in temps from Jan 1st to Jan 2nd that lasted a few days only. The East and Midwest have been consistently cool adding to the increase in gas demand.
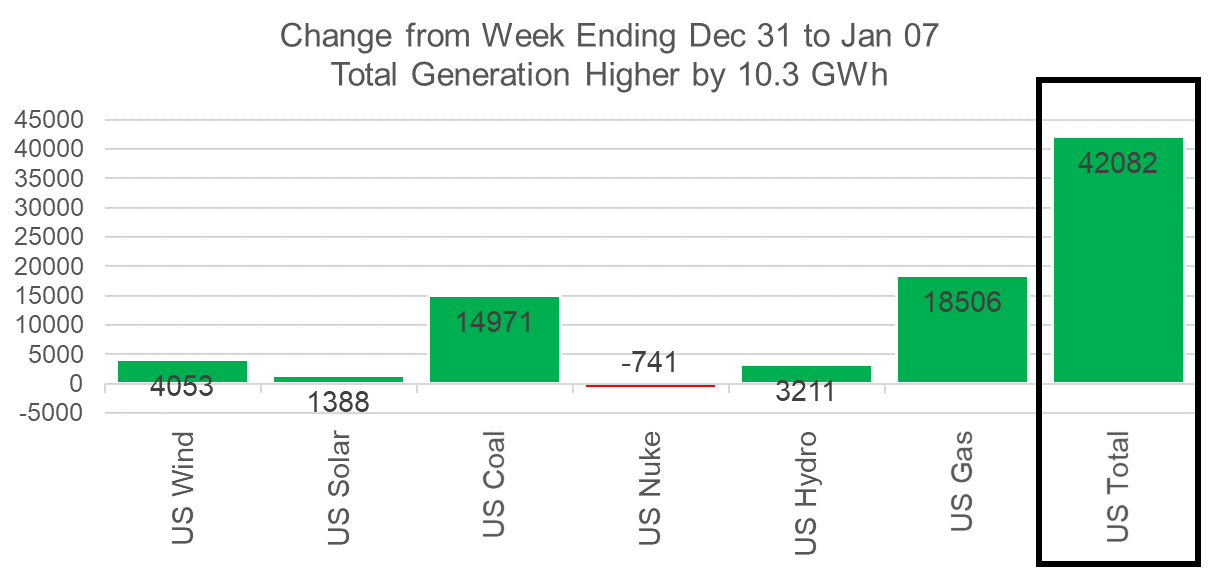
Total natgas gen also rose last week with temps cooling and folks returning to work. Total power load rose by 7% with coal generation helping fill the gap the most amongst all other gen types. Here is the L48 weekly generation change.
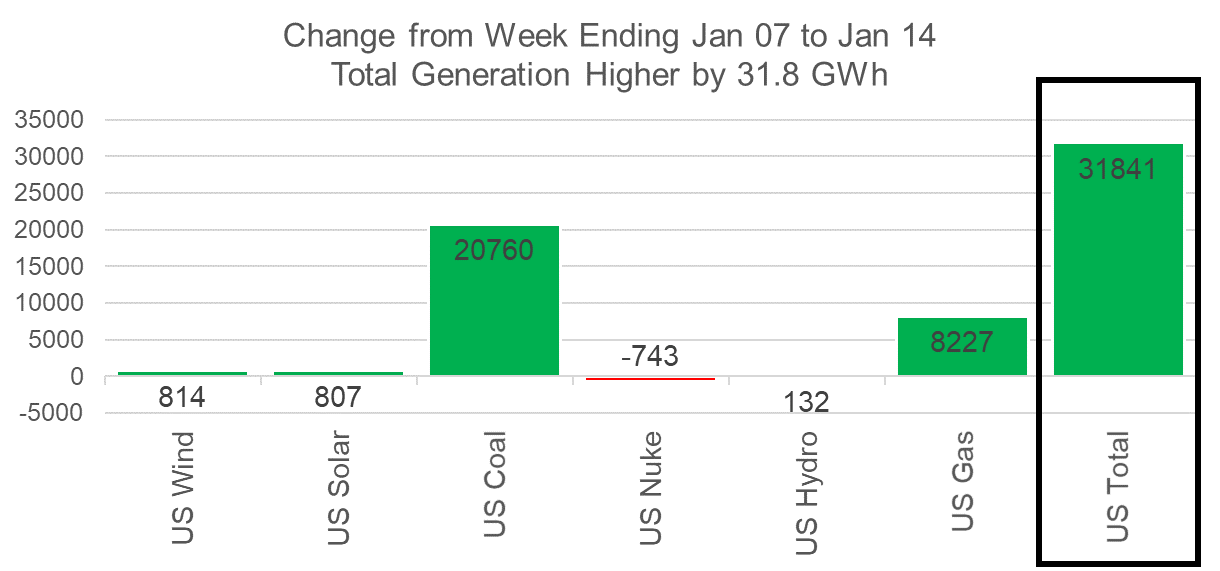
Source: Analytix.ai
Coal-fired gen has made a move higher in the last few weeks as colder weather drove up the total power demand. The rebound comes despite earlier indications that gas-to-coal switching in the US may have been approaching the limits of available capacity. The chart below shows natgas gen’s share of total thermal gen during the winter months since November 2017. After the low coal production levels and low coal stockpiles in 2021, we saw natgas gen outperform despite the large deviations in natgas prices in 2021. Gas has consistently maintained a 65% share of total thermal gen this winter up until the past 2 weeks.
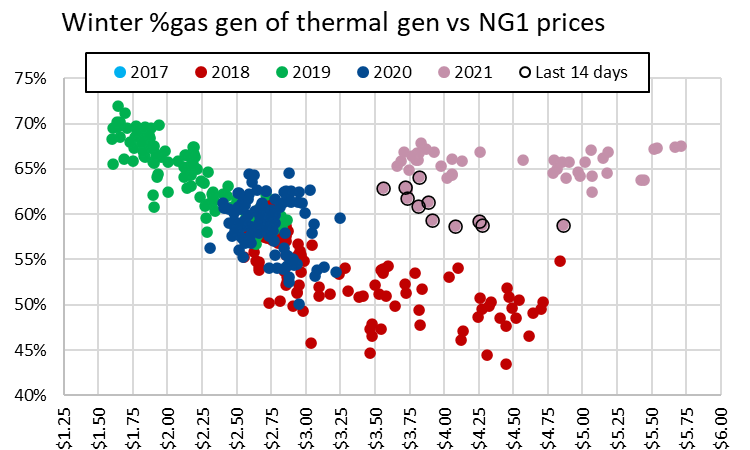
Note: 2021 = Winter 2021/22
Source: Analytix.ai
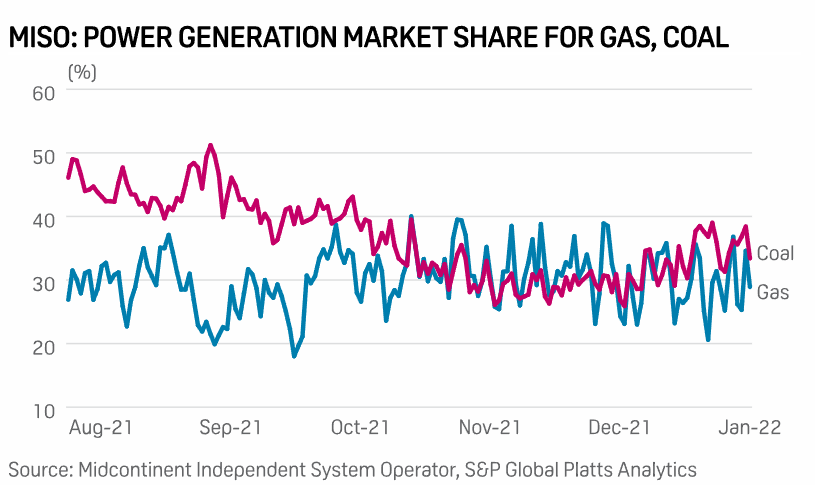
The comeback of coal in recent weeks is being primarily being led by the MISO region. The plunging temps has resulted in growing power load and higher cash prices which is pushing the regional LDCs back to coal.
This from Platts – “Since the start of January, coal has made notable gains in MISO’s generating stack, consistently outperforming gas for the first time since mid-October. Month to date, market share for coal has edged up to over 35% of total power generation in MISO, eclipsing gas at an estimated 29% this month, data from the ISO and S&P Global Platts Analytics shows.”
Domestic dry gas production continues to trend lower than levels we saw before the holidays (~96.5 Bcf/d). Last week we had a deep freeze leading to an average loss of 1.1 Bcf/d of production from the Permian, Midcontinent, Rockies, and Bakken. This week we have similar levels of freeze-offs, but this time its comes primarily from the Northeast. 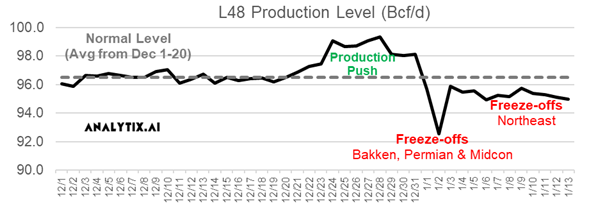
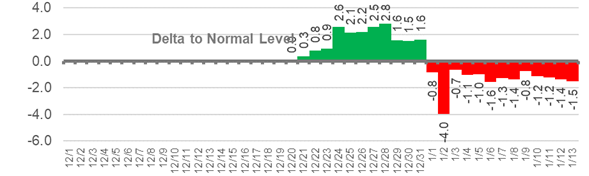
Source: Analytix.ai
As the L48 loses supply, we see a net Canadian import increase to the 6.5-7.30 Bcf/d range.
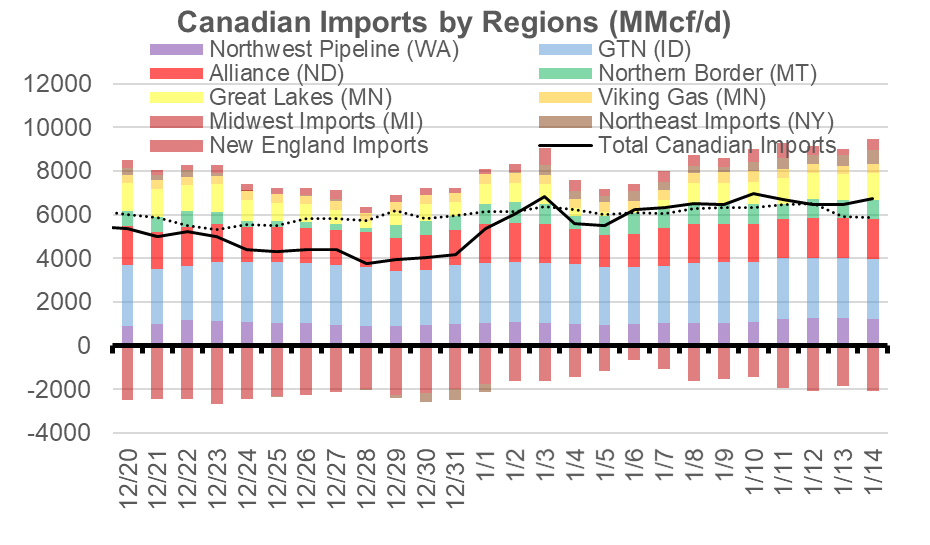
Source: Analytix.ai
Deliveries to LNG facilities averaged 12.3 Bcf/d, which was +0.4 Bcf/d higher than last week. Sabine was the driving factor to the week-on-week increase, with train 6 restarting. The facility started taking 5+ Bcf/d of deliveries starting Jan 12th. Here is the terminal-by-terminal view to see how each has operated over the past 60 days.
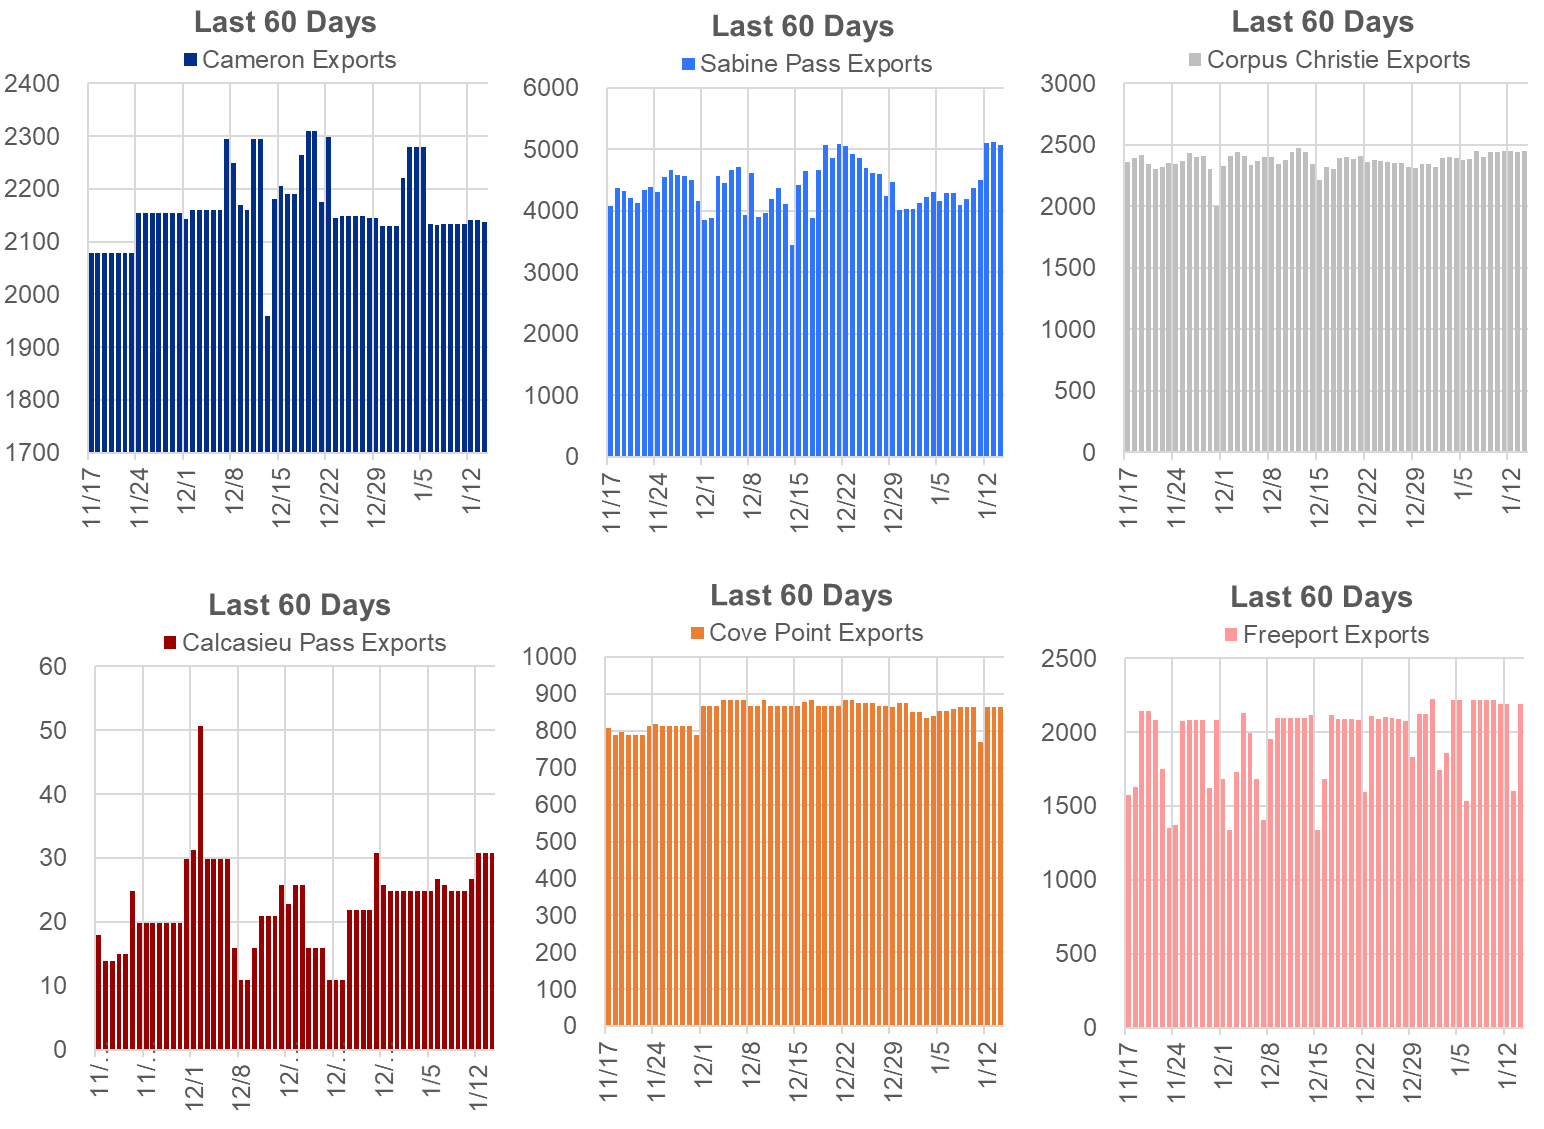
Source: Analytix.ai, Bloomberg
The net balance was 2.9 Bcf tighter week-on-week.
Expiration and rolls: UNG ETF roll starts on Jan 12th and ends on Jan 17th.
Feb futures expire on Jan 28th, and Feb options expire on Jan 26th.
This email, any information contained herein and any files transmitted with it (collectively, the Material) are the sole property of OTC Global Holdings LP and its affiliates (OTCGH); are confidential, may be legally privileged and are intended solely for the use of the individual or entity to whom they are addressed. Unauthorized disclosure, copying or distribution of the Material, is strictly prohibited and the recipient shall not redistribute the Material in any form to a third party. Please notify the sender immediately by email if you have received this email by mistake, delete this email from your system and destroy any hard copies. OTCGH waives no privilege or confidentiality due to any mistaken transmission of this email.