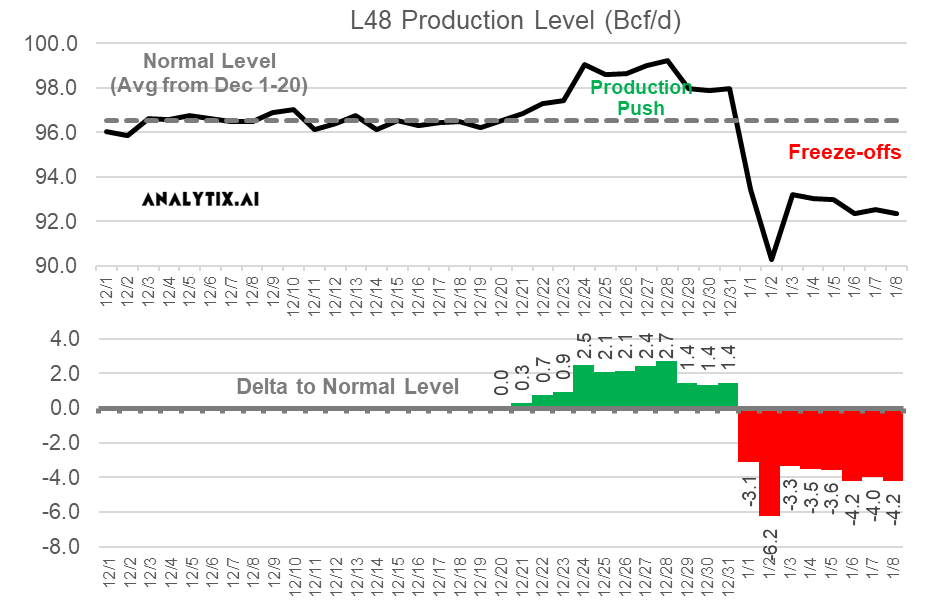
With the sudden turn in weather over the prime shale play, we observed a wild reversal in daily output due to freeze-offs spanning from the Bakken down to the Permian.
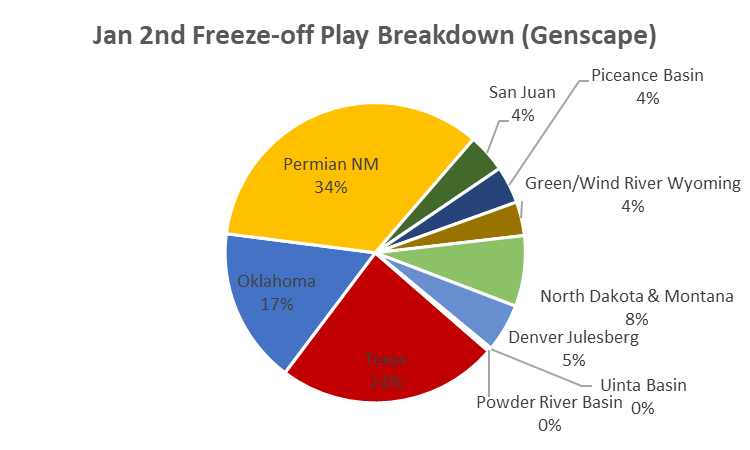
Here is the breakdown of where the freeze-offs occurred on Jan 2nd (the peak freeze-off day) according to Genscape data.
Production freeze-offs occur when temps drop below 32°F (0°C) in producing fields, causing water and other liquids in above-ground gathering lines at the wellhead to freeze and block the flow of natural gas. Northern areas are well prepared for cold weather and have installed glycol units, which help prevent freeze-offs, on most of their vulnerable equipment and lines. That being said, producing fields in these colder climates such as Western Canada’s Montney and Duvernay basins still experience freeze-offs.
The US States with warmer temperatures on average are more susceptible to freeze-offs when temps dip below freezing because producers in these areas have less of an incentive to prepare for cold events. Also notable is that shale plays with wet gas production have a higher likelihood of freeze-offs than dry-gas production as the condensates in the gas stream freeze.
Fundamentals for the week ending Jan 07:
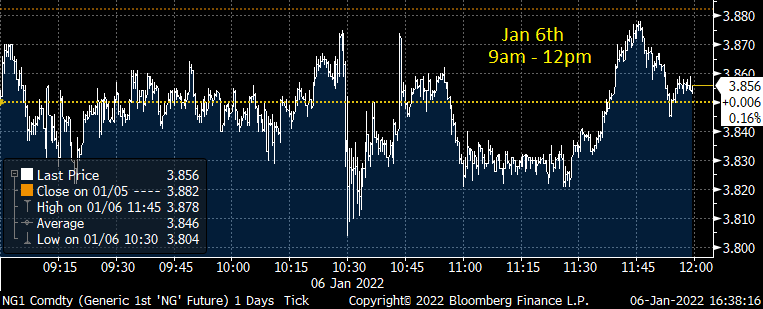
The EIA reported a -31 Bcf withdrawal for the week ending Dec 31th, which came in much lower than analyst estimates. Most major vendors and surveys were calling for a larger draw.
The bearish draw immediately triggered the prompt month prices to drop from 3.86 to 3.81, but the market recovered almost all the losses within 15 minutes. There was not much action for the remainder of the day with the market closing essentially flat to the open.
The was particularly a difficult week to forecast with multiple factors influencing the numbers.
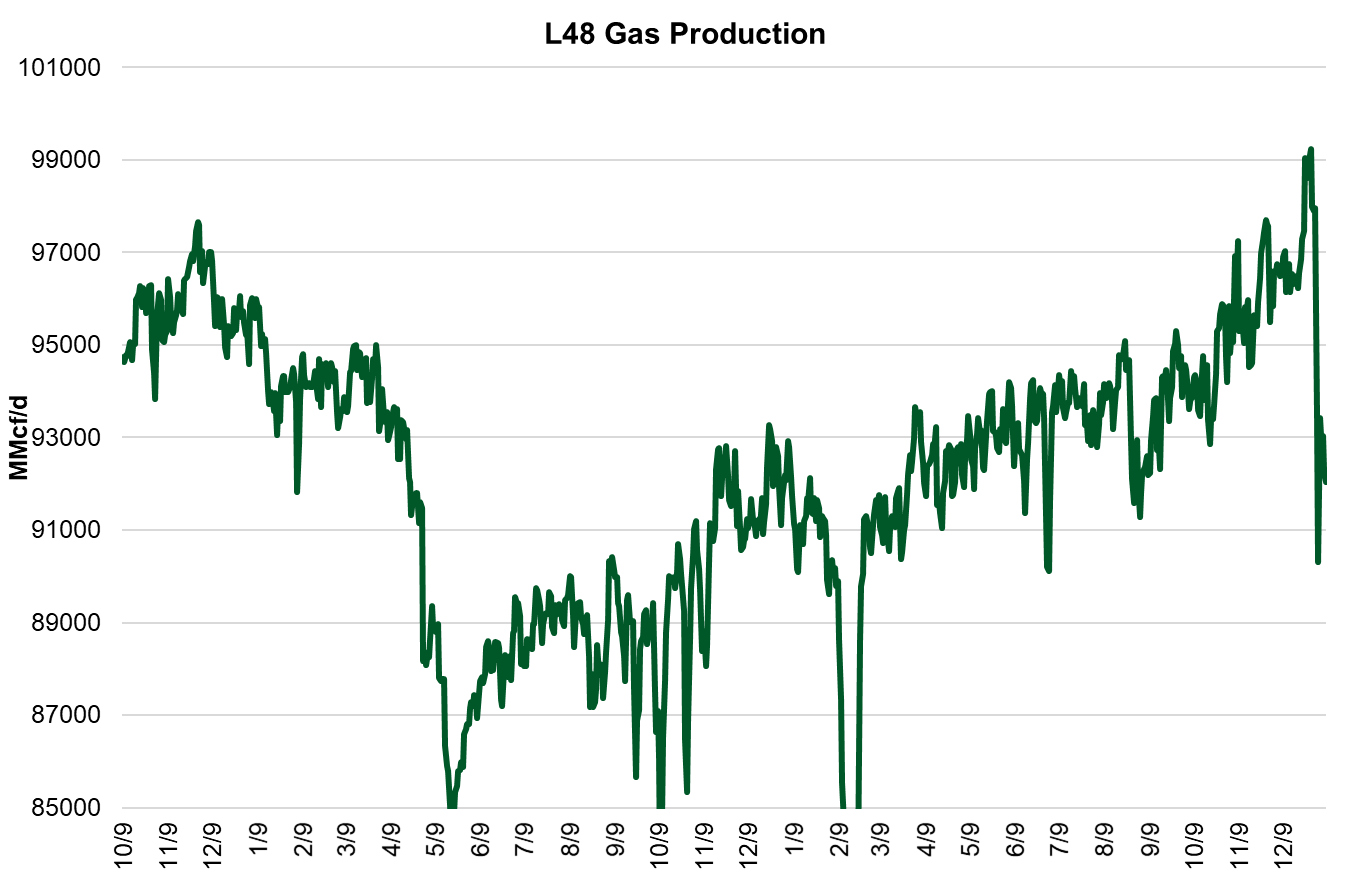
1) Surging production as producers make one last push to pad their financials (as shown in the chart above).
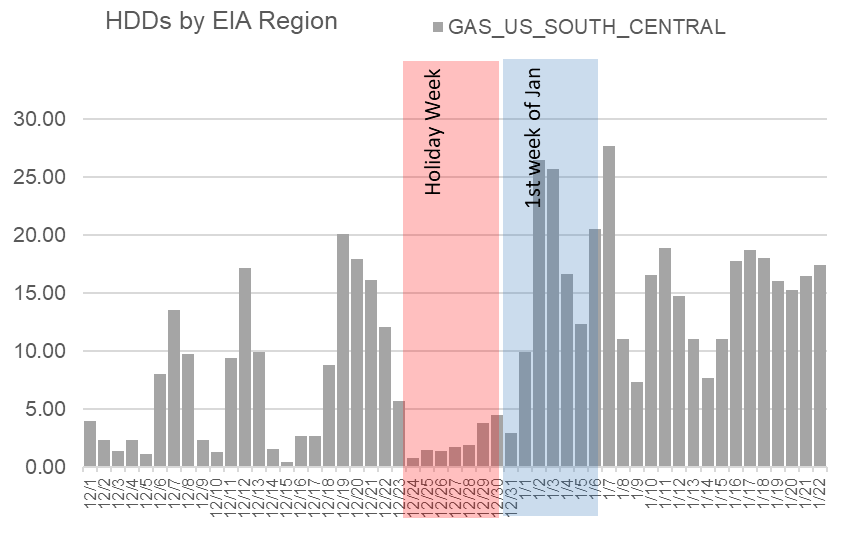
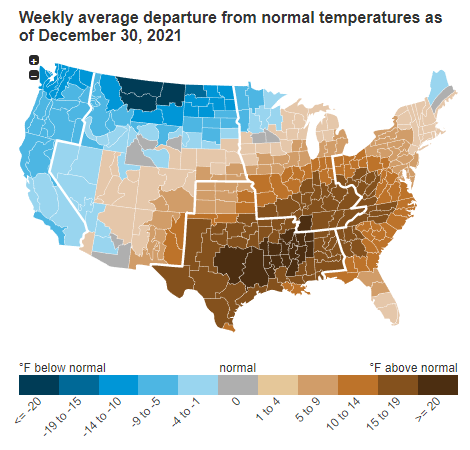
2) The exceptionally warm temps in the densely populated areas. We calculate 38 fewer HDDs than the 10Y normal for the storage week.
3) Holiday impact could have been larger than usual with Xmas and New Years Day falling on a Saturday; hence more people could have taken the entire week off.
4) COVID impact was large as Omi showed its face just in time for the holidays.
The year closed with 3,195 Bcf in storage, which is 154 Bcf behind the same time last year and 96 ahead of the 5Yr average. Current storage levels are now ahead of the 5Yr average in regions but the Mountain and Pacific.
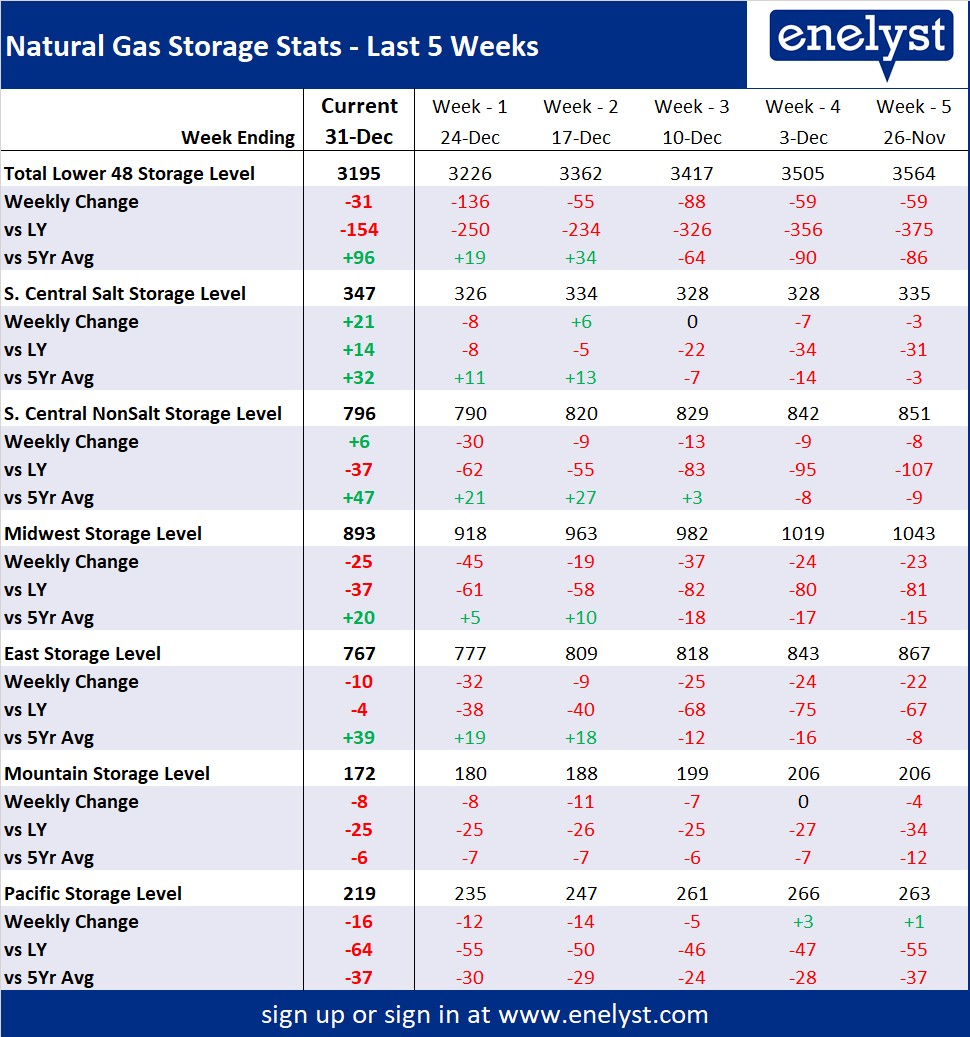
For the week ending Jan 7th, our early view is -177 Bcf. This reporting period will take L48 storage level to 3018 Bcf (-52 vs LY, +40 vs. 5Yr). Over the next 4 reports, we expect total storage draws to total 747 Bcf or an average of 186.7 per week (based on current weather forecast). This would take storage levels to 2448 Bcf by the end of Jan, which would be roughly 40-50 Bcf higher than the same time last year.
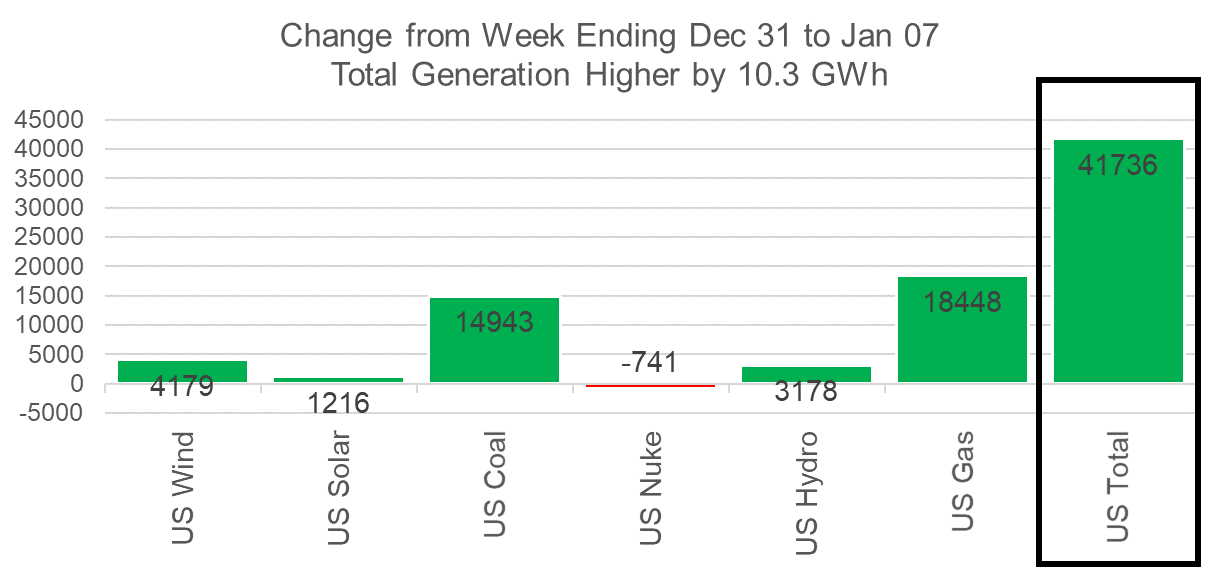
This past week we see total consumption rise considerably with much cooler temps. Total HDDs increased by 5.9F WoW leading to both rescomm and industrial demand jumping by 13.4 Bcf/d WoW. Total natgas gen also rose last week with temps cooling and folks returning to work. Total power load rose by 10% with natgas generation helping fill the gap the most amongst all other gen types. Here is the L48 weekly generation change.
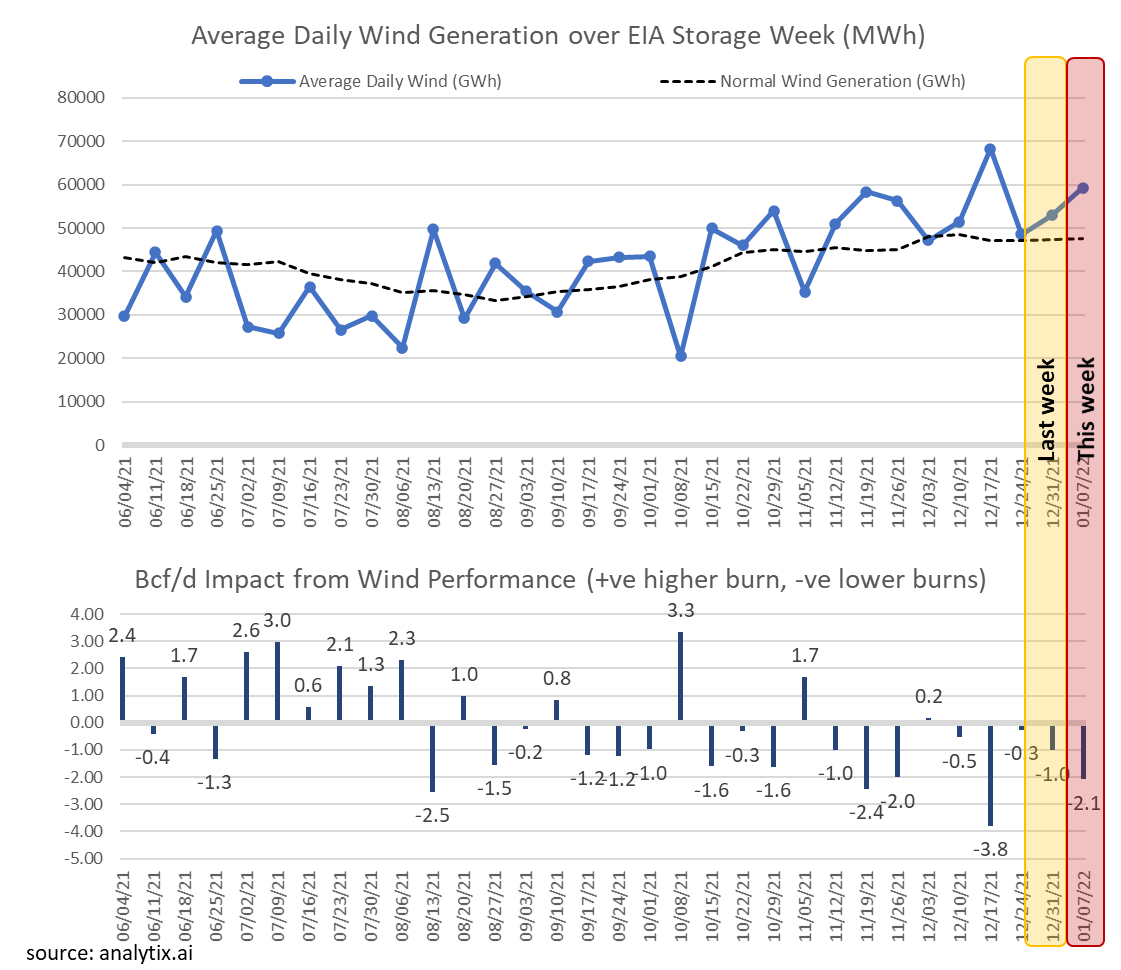
Wind generation continues to operate at above expected levels. This week wind averaged 59.2 GWh, which was 8% higher than the previous week and 24% higher than our “expected” level for this time of the year (see chart below). We approximate stronger than expected wind performance kept burns lower by 2.1 Bcf/d for this storage report.
Domestic dry gas production was lower by 5.3 Bcf/d to 93.3 Bcf/d due to the deep freeze hitting Permian, Midcontinent, Rockies, and Bakken.
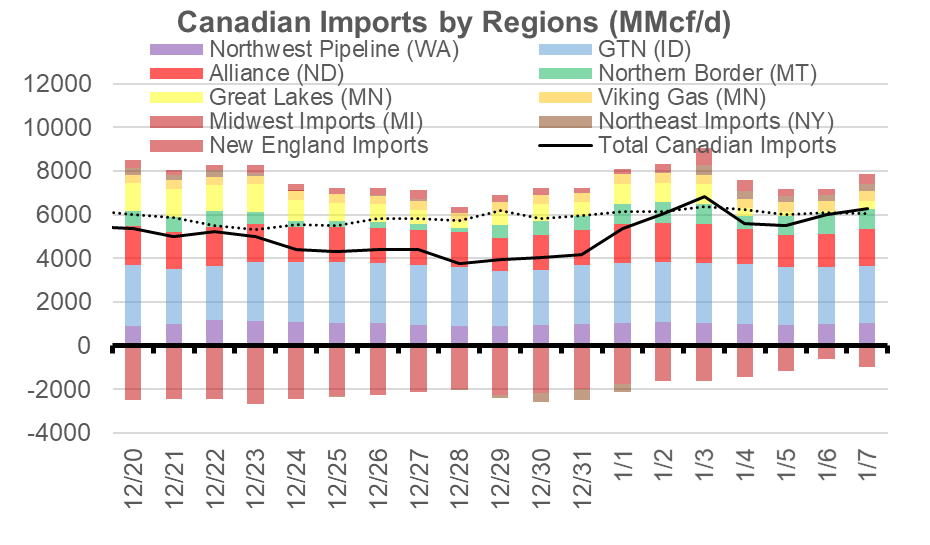
To help the supply loss, we saw a net Canadian import increase from ~4 Bcf/d to ~6 Bcf/d. WestCan is also in a deep freeze situation with production freeze-offs and record gas demand figures. The wide cash spreads kept gas flowing to the US.
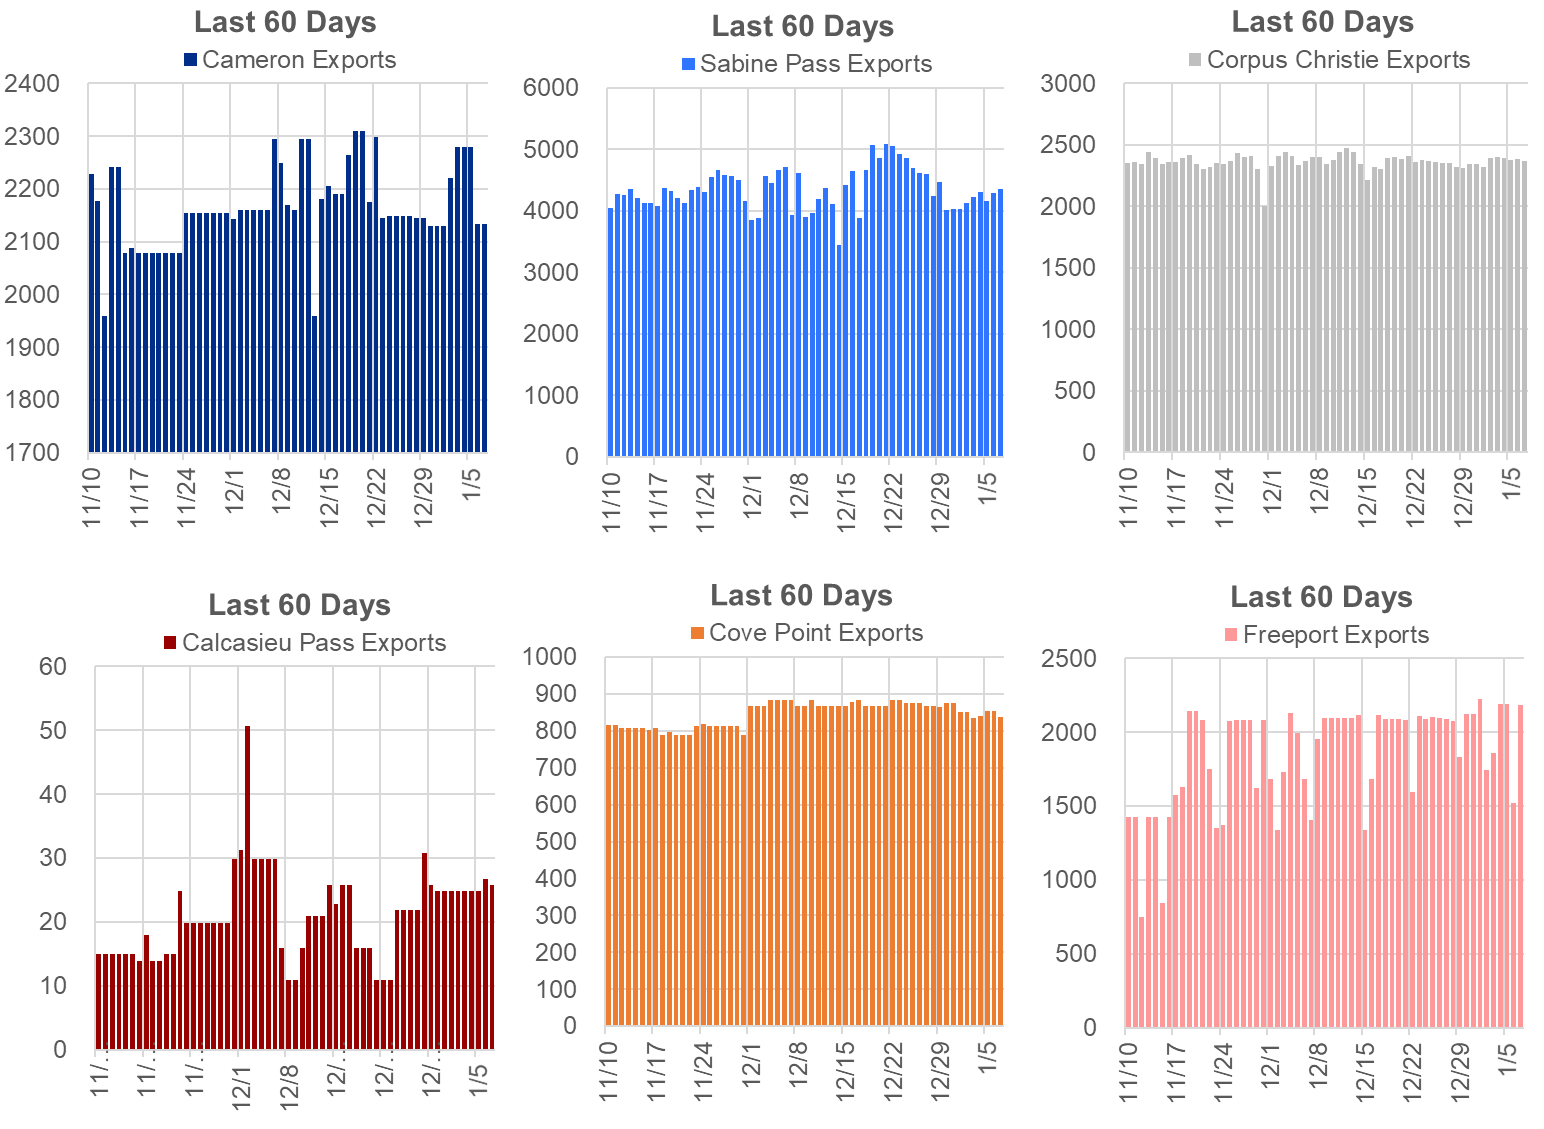
Deliveries to LNG facilities averaged 11.9 Bcf/d, which was -0.4 Bcf/d lower than last week. Sabine was the lone facility that saw lower average deliveries this week. Here is the terminal-by-terminal view to see how each has operated over the past 60 days.
The net balance was 20.6 Bcf tighter week-on-week.
Expiration and rolls: UNG ETF roll starts on Jan 12th and ends on Jan 17th.
Feb futures expire on Jan 28th, and Feb options expire on Jan 26th.
This email, any information contained herein and any files transmitted with it (collectively, the Material) are the sole property of OTC Global Holdings LP and its affiliates (OTCGH); are confidential, may be legally privileged and are intended solely for the use of the individual or entity to whom they are addressed. Unauthorized disclosure, copying or distribution of the Material, is strictly prohibited and the recipient shall not redistribute the Material in any form to a third party. Please notify the sender immediately by email if you have received this email by mistake, delete this email from your system and destroy any hard copies. OTCGH waives no privilege or confidentiality due to any mistaken transmission of this email.
