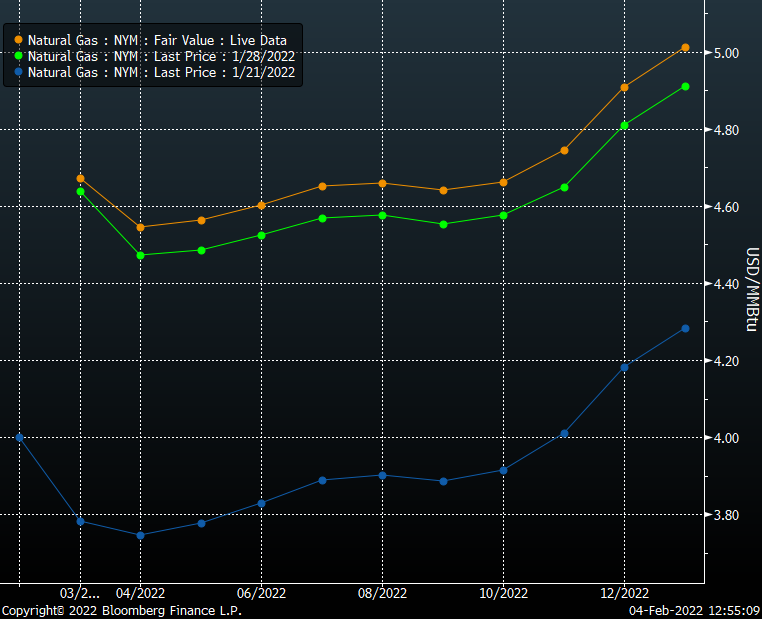
Natural gas futures have been extremely volatile this past week. Weather outlooks have been driving the conversation throughout these price moves. Not only did the March contract make some violent moves this past week, but the entire curve out to Winter 22/23 made some big shifts. The fear of a low winter storage exit has propagated through the summer and into next winter – hence both shifting higher. I think the big unknown remains to be summer production levels. After the strong production in Dec, we have only observed freeze-offs that have messed up the party.
With weather driving all conversations these past few weeks, we reached out to Brian Lovern of Bespoke Weather to give us more insight into what is to come. The weather commentary below is commentary that is provided with his daily service.
[Please reach out to Brian if you have any additional questions: brian@bespokeweather.com]
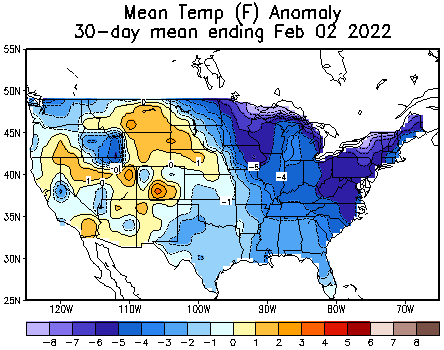
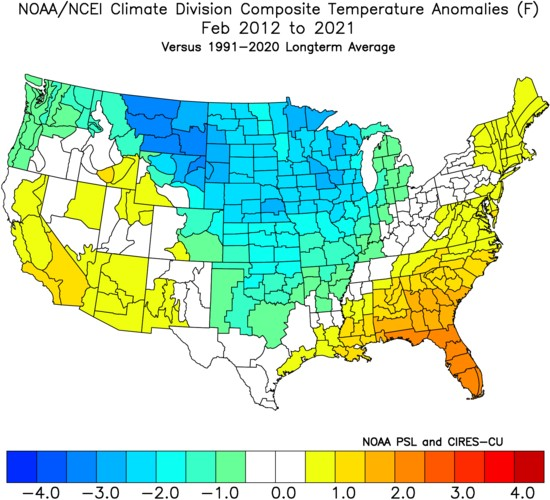
After the 2nd warmest December on record, the pattern has flipped into colder mode over the last few weeks, producing the coldest January the nation has seen since January 2014, with the focus of cold being in the eastern part of the U.S. over the last 30 days.
30-day Temperature Anomalies
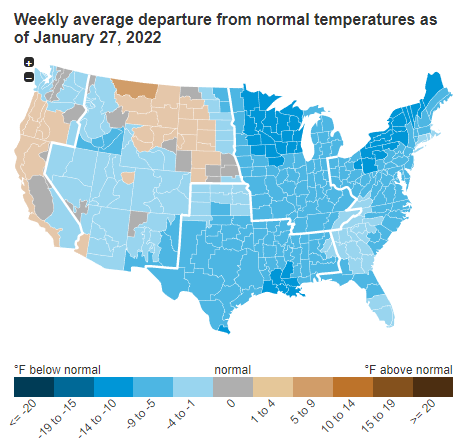
As we look ahead into the remainder of February, it is a tricky forecast, as the data has been quite volatile, but there are reasons to believe the pattern evolves into a more variable one, perhaps closer to normal in terms of national demand. The latest 15-day forecast is shown here:
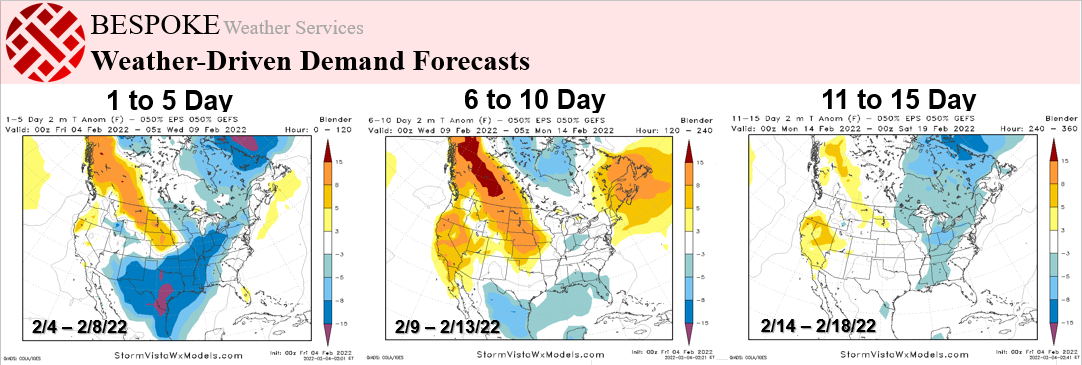
The current Texas cold stands out, but wanes over the next few days, and, as can be seen, the level of cold is not what we have been seeing for the last few weeks, though the next 15 days, taking us a few days beyond the middle of the month, do remain on the colder side of normal.
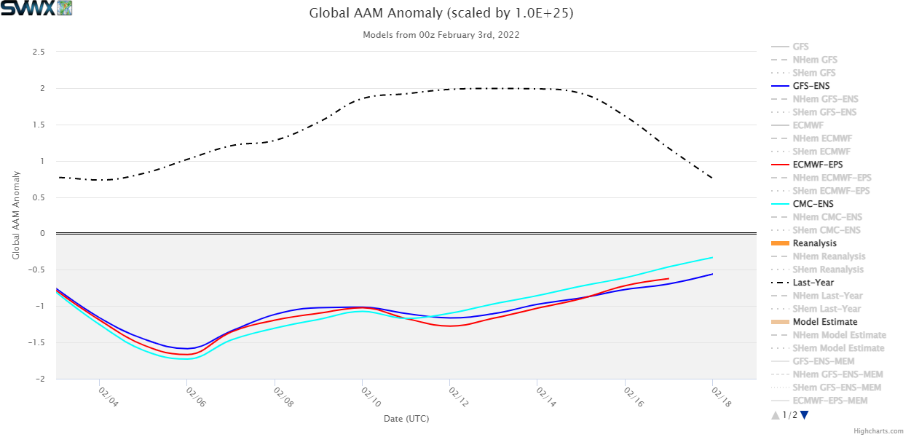
Of note is the fact that we remain in a La Niña base state, globally, as shown by the persistence recently of negative global angular momentum anomalies, a measure of global wind, essentially, where negative anomalies equate to a tilt toward La Niña, and positive toward El Niño. Image courtesy of StormVista.
The longer this persists, the more it increases the risk of colder weather gradually relocating farther west, with the East able to turn milder. We are seeing some hint of this already in some of the modeling, with cold risks moving more toward the middle of the nation, loosening its grip in the East. Incidentally, such a pattern has been rather common in February, regardless of the ENSO state, as shown by looking at an aggregate of the last 10 Februarys.
This type of pattern actually serves as our best guess as to how the back half of February will turn out, using the blend of what we see in the modeling, the La Niña state / tropical forcing signals, and recent climatology. Again, it’s not as cold as we have seen, but is not a “warm” pattern, either. We shift the location of cold, and by virtue of allowing the East to turn milder, national demand would wind up closer to normal in this scenario. We again stress that confidence is below average, however, as the modeling has been volatile, and there have been hints of a return of the more classic La Niña state for a couple of weeks now, which have not yet panned out, so , as always, it will be important to keep up-to-date on the latest data as we move into the home stretch of the 2021-22 winter season.
Fundamentals for the week ending Feb 04:
The EIA reported a -268 Bcf withdrawal for the week ending Jan 28th, which was well below the ~280 Bcf market consensus. The lower draw was better tracked by most flow models; hence it looks like most of us misfired on our S/D weekly balance. Either we all underestimated production (i.e. the Northeast freeze-offs), or we over-estimated gas demand. Since we have a very good daily sample of NE production, I put more weight on overshooting demand. It appears we did not track the non-linearity of the weather & demand relationship well at the cooler weather extremes.
The other scenario is that a few storage operators reported incorrectly and we see the missed amount (~12 Bcf) show up in next week’s report. Let’s hope that is not the case.
The overall power mix changed substantially week-on-week, with the overall power load rising by 5.6% or an average of 26.7 GWh. During the week ending Jan 28th, we observed a big drop in wind that took levels 11% below our “calculated expected”. This was the first after 7 consecutive weeks where wind performance was below the expected levels. Coal gen and natgas gen filled the gap this past week.
For the week ending Feb 4th, our early view is -228 Bcf. This reporting period will take L48 storage level to 2,095 Bcf (-432 vs LY, -271 vs. 5Yr).
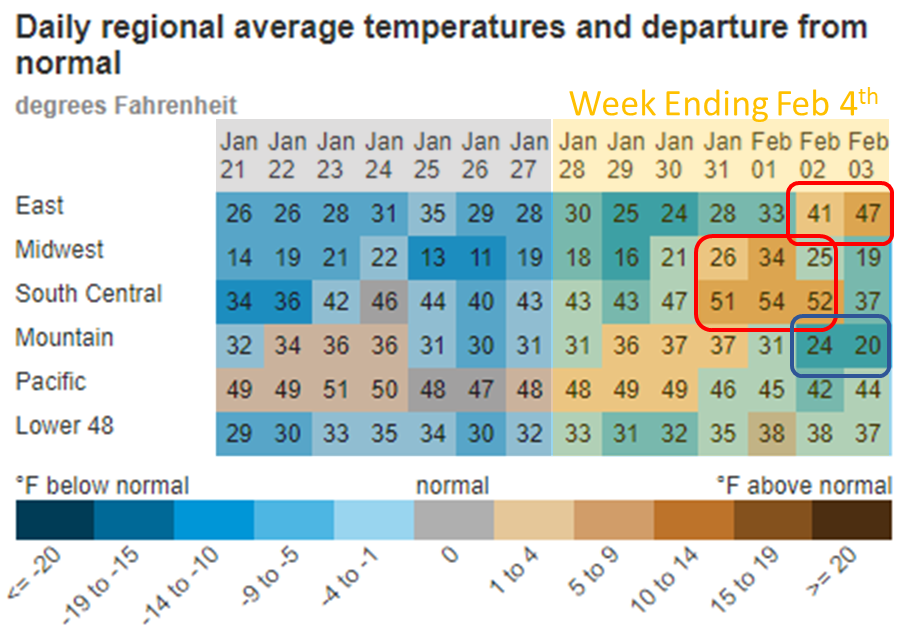
Total consumption remained strong but lower week-on-week. Specifically, we saw warmer temps in the Midwest and SC midweek, and the East toward the end of the week. At the L48 level, GWHDD were 3.4 lower than the previous week leading to total consumption dropping by 5.2 Bcf/d.
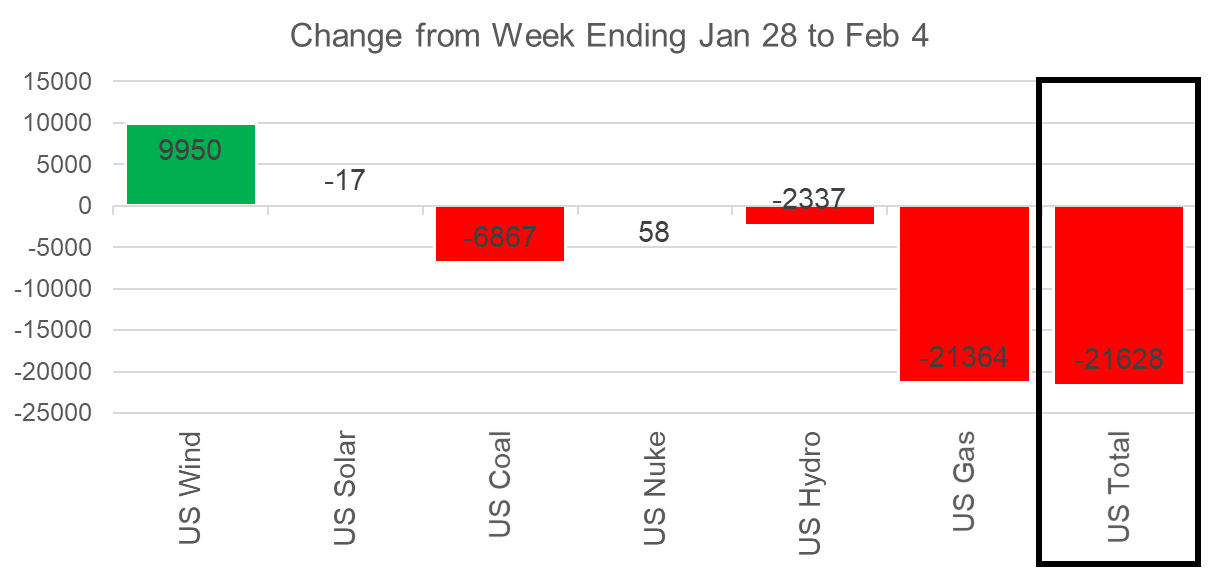
The overall power mix changed with the weather as well. The overall power load dropped by 4.3% or an average of 21.6 GWh. During the week, we also saw wind recover. For the week ending Jan 28th, we saw wind underperform its expected level for the first time in 7 weeks. This past week, wind generation was 18% above normal. With overall power load dropping and wind recovering, we see overall natgas gen power burns drop by 21.3 GWh on average. Using a 7.5HR gas plant, this equates to power burns being lower by 3.8 Bcf/d over the week.
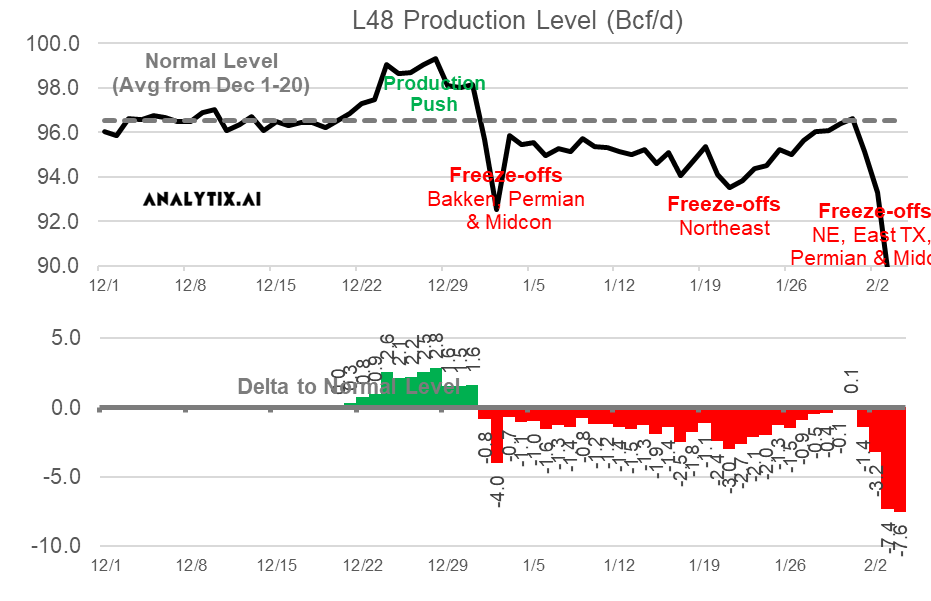
Domestic dry gas production was overall flat week on week, but we did see large daily deviations as cooler weather move moved from blanketing one key production area to another. As of Thursday, production had dropped below 90 Bcf/d as the cooler weather extended from the Northeast to the Permian basin. These lower production figures will show up more in the following week’s report.
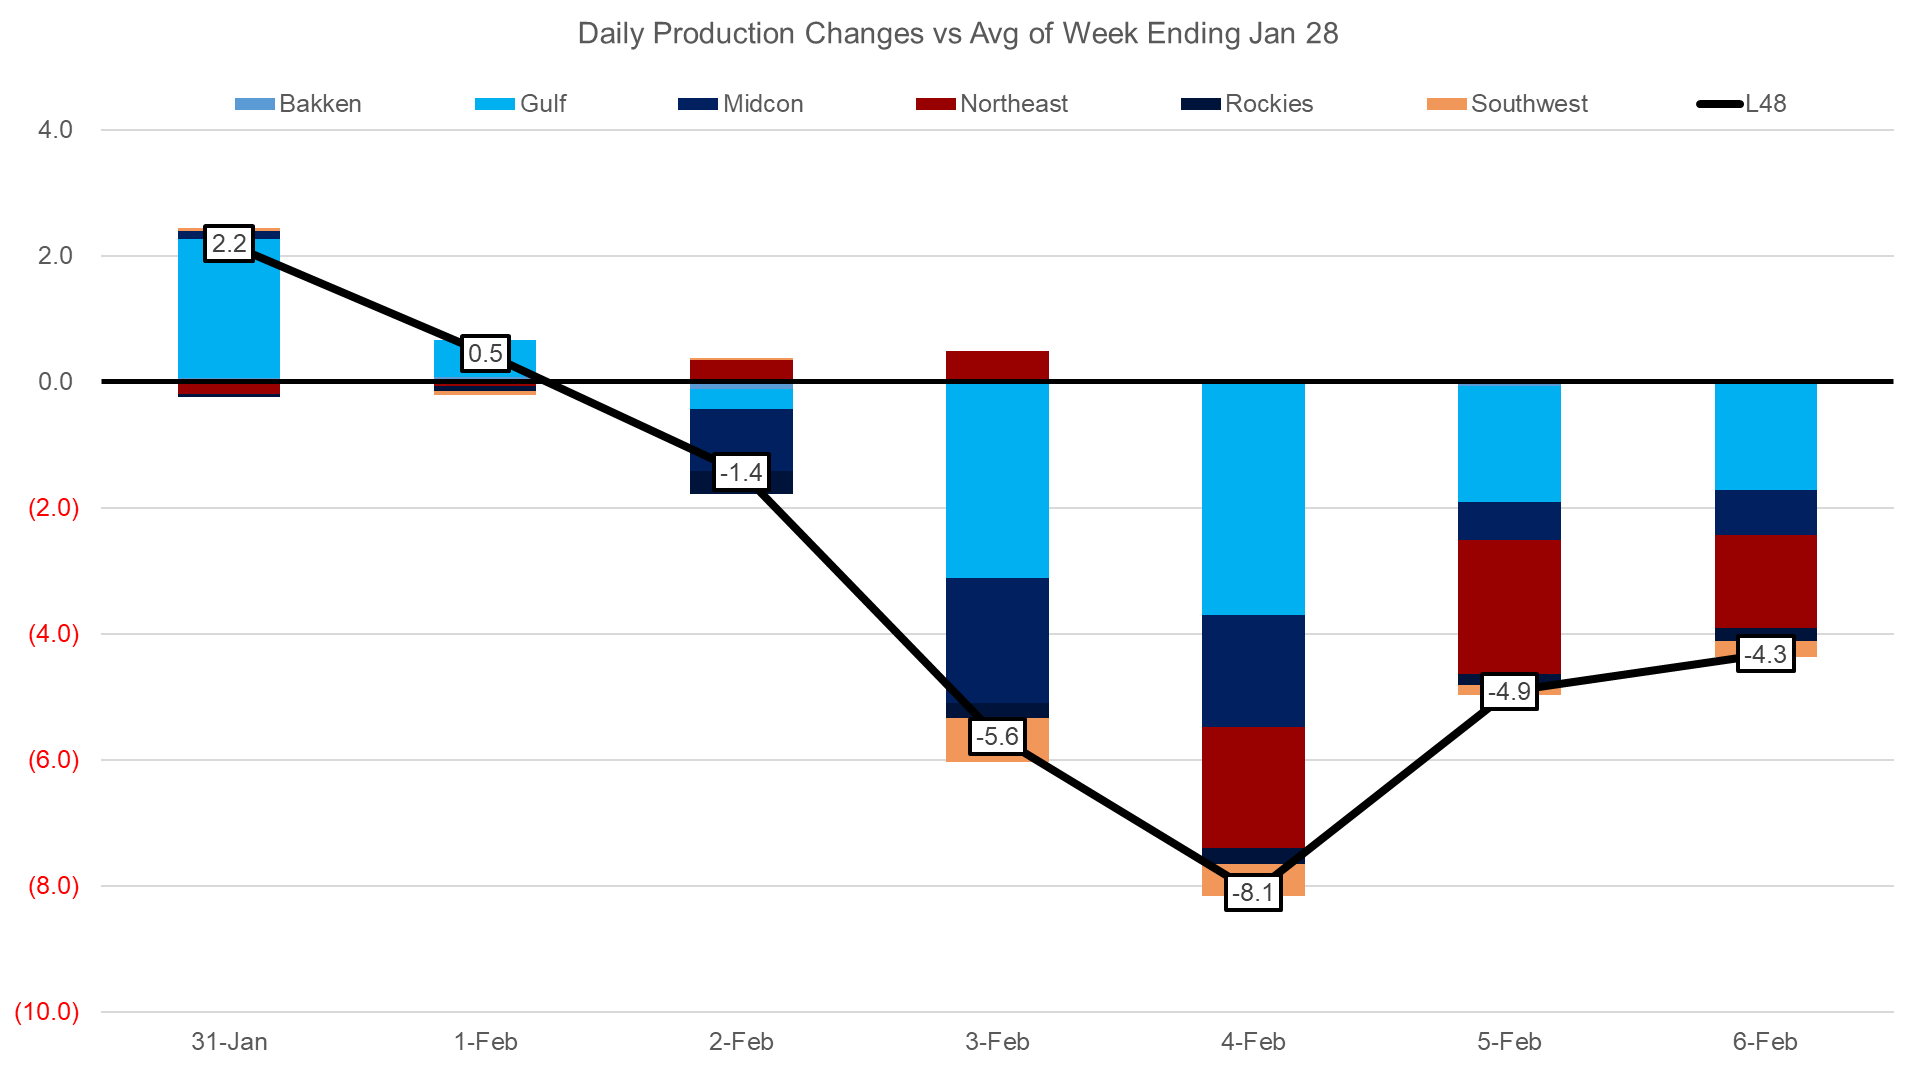
Looking at the daily production change on a region by region basis, you see that some Gulf production recovered early in the week but then the cooler temps extending from to West Texas crushed daily output.
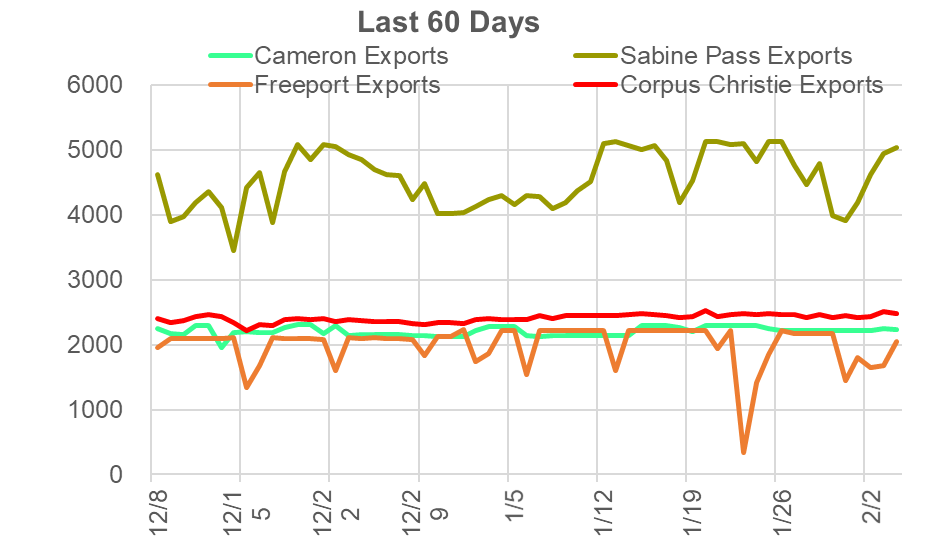
Deliveries to LNG facilities averaged 12.1 Bcf/d, which was -0.4 Bcf/d lower than the previous week. Freeport operations continued to suffer, but the main culprit for the lower LNG levels was Sabine Pass. Deliveries to Sabine dropped below 4 Bcf/d midweek but recovered towards the end of the week. Sabine was lower due to commissioning activity at T6, while Freeport had a trip on T1.
This weekend the total deliveries were back above 13 Bcf/d. With all the major plants recovering, we also have Calcasieu Pass hitting 0.18 Bcf/d of deliveries. Calcasieu Pass LNG has submitted a request to the FERC for authorization to load their first LNG commissioning cargo. They asked for approval to do so no later than February 9, 2022.
Here is the terminal-by-terminal view to see how each has operated over the past 60 days.
The net balance was 5.8 Bcf looser week-on-week.
This email, any information contained herein and any files transmitted with it (collectively, the Material) are the sole property of OTC Global Holdings LP and its affiliates (OTCGH); are confidential, may be legally privileged and are intended solely for the use of the individual or entity to whom they are addressed. Unauthorized disclosure, copying or distribution of the Material, is strictly prohibited and the recipient shall not redistribute the Material in any form to a third party. Please notify the sender immediately by email if you have received this email by mistake, delete this email from your system and destroy any hard copies. OTCGH waives no privilege or confidentiality due to any mistaken transmission of this email.