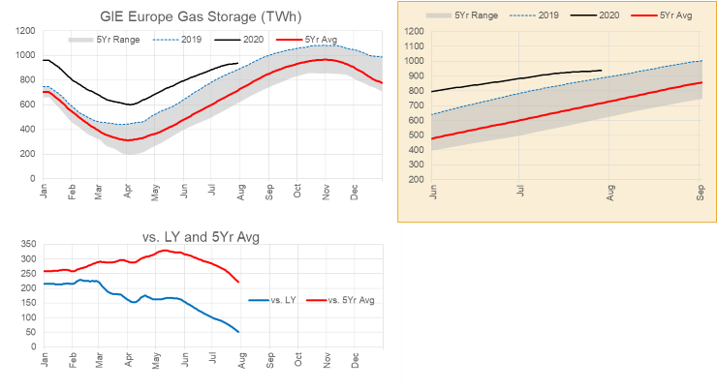
This week we once again take a look at European natural gas storage levels. Lots has changed over the past two months as storage levels start to comeback to the 5Yr range. Lower prices across Europe look to be working in correcting the storage surplus left after winter by either encourage more use, and discouraging net imports.
At the beginning of June, the storage levels were 796 TWh, or 149 TWh ahead of last year. Fastforward to today and the current European storage level is 945 TWh, or 48 TWh ahead of last year.
Curent Storage Level = 945 TWh (85% full)
+48 TWh or +3% YoY
+221 TWh or +30% vs 5Yr Averge.
[Note: 1 TWh = 3.41 Bcf]
The surplus has dropped drastically, and it now looks like European natural storage will not be hitting capacity.
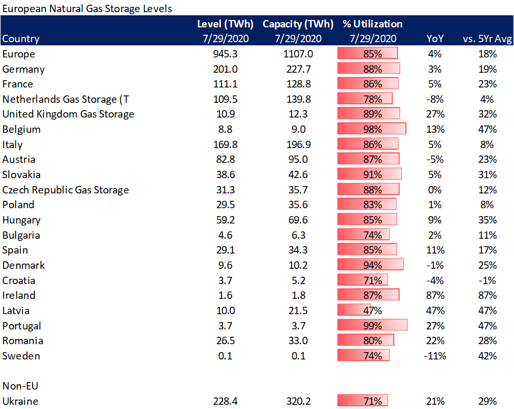
The next table take the same data but breaks it up by country. It shows where the storage is and how full it is. The major storage sites sit in Germany, Netherlands, France and Italy. Ukraine, a non-EU country, has a larger working gas capacity and is well connected to Europe.
Here is a link to a detail Europe infrastructure map.
What has happened to get storage in check, and could this mean US LNG to Europe starts to flow in Oct as spreads widen?
LNG imports
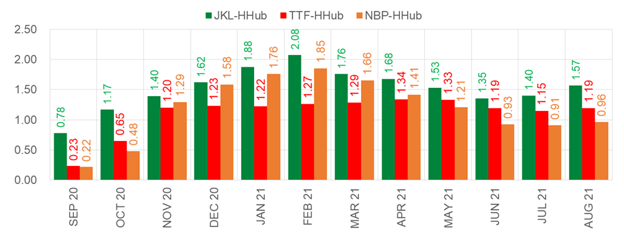
We have seen US LNG fall apart this summer. Global LNG spread to henry hub have tightened (even negative to NBP and TTF) leading to a massive number of cargo cancellations. TTF and NBP traded close (sometime below) to Henry Hub levels
That being said, daily European import data shows levels have not dropped off significantly, and infact are sitting above the 5Yr average and close to last year’s levels.
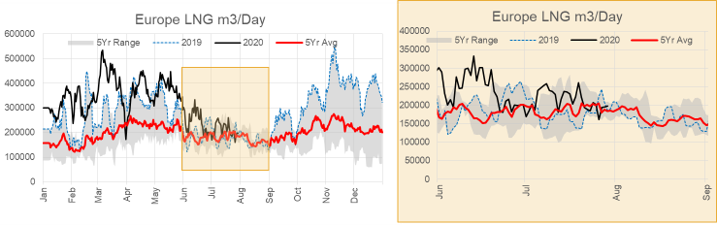
So the storage correction cannot really be attributed to lower LNG imports.
European Coal to Gas Switching
2019 complete year data shows that roughly 28% of Germany’s power came from coal sources, while natural gas only contributed 15%. For H1 2020, there has been a flip where natural gas generation has increased at the expense of coal generation.
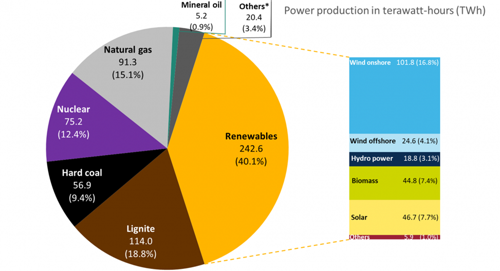
Source: Clean Energy Wire
Behind the change in the power mix is of course price. The current 12-month TTF strip is 30% lower than last year, while front-year coal into Europe has only fallen 12%. Adding to the pricing pressure is European carbon prices which hit a 14-year high in mid-July. The changing price landscape has prompted RWE and Uniper to return mothballed gas plants to service while other generation owners like Vattenfall have booked a $1B impairment on its Hamburg coal plant that was commissioned in 2015.
Ukraine Storage
Ukraine’s natural gas storage capacity is immense. Total storage capacity is 320 Twh, or 30% of Europe’s total capacity. Ukraine storage levels have been at a high all year, but there still remains room to take overflow from Europe.
In June there were concerns that Ukraine storage might not be accessible when Ukraine’s gas grid operator GTSOU announced maintenance at a major interconnect that brought gas from Slovakia into Ukraine. The original timeframe for the maintenance was Aug 11 to Oct 1. The maintenance has since been reduced to Sept 1-21, allowing more excess European gas to flow into Ukraine storage.
Current Ukraine storage levels are now above the 5Yr max typically set in early-November.
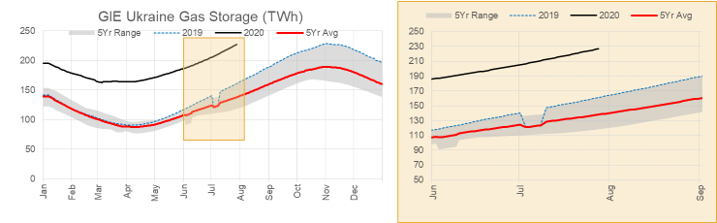
With current Ukraine storage levels at 228 TWh, there is still 92 TWh of space remaining.
[92 TWh = 313 Bcf or 94 LNG tankers worth of gas]
Overall, we do not see European storage a major issue hanging over US natgas markets. The problem seems to be have been corrected by this point, and current LNG spreads indicate that we could see cargo headed back to Europe by October.
Here are current forward Henry Hub to TTF spreads. European ports trade at both discounts and premiums to TTF; hence at current shipping rate US Gulf Coast LNG is economic to some ports for October.
Fundamentals for week ending July 31: Our early view for the upcoming storage report is a +29 Bcf injection for the lower 48. This would take storage levels to 3270 Bcf.
US natural gas dry production remained flat week on week with domestic production averaging 85.9
Bcf/d for the week. Average weekly production is 0.6 Bcf/d lower than 4 weeks ago.
Natural gas demand was similar to the previous week. We saw a very small increase in both power and RC demand. Normal temps usually hit a peak in late-July; therefore we should expect power demand to slide throughout August.
Canadian imports were lower last week averaging 4.5 Bcf/d.
Mexican exports averaged of 6.3 Bcf/d. A new peak of 6.2 Bcf/d was set this past week.
Deliveries to LNG facilities averaged 3.1 Bcf/d. On August 1st LNG deliveries jumped to 4 Bcf/d, potentially indicating US Gulf Coast cargo cancellation will not be as severe as July.
Expiration and rolls: UNG ETF roll starts on Aug 13th and ends on Aug 18th.
September futures expire on August 27th, and September options expire on August 26th
This email, any information contained herein and any files transmitted with it (collectively, the Material) are the sole property of OTC Global Holdings LP and its affiliates (OTCGH); are confidential, may be legally privileged and are intended solely for the use of the individual or entity to whom they are addressed. Unauthorized disclosure, copying or distribution of the Material, is strictly prohibited and the recipient shall not redistribute the Material in any form to a third party. Please notify the sender immediately by email if you have received this email by mistake, delete this email from your system and destroy any hard copies. OTCGH waives no privilege or confidentiality due to any mistaken transmission of this email.