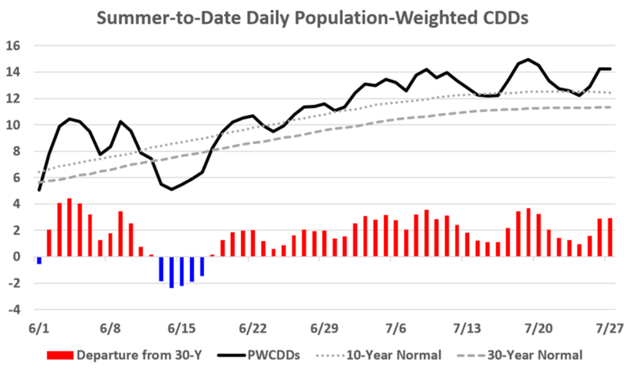
On Friday natgas saw another massive market rally. Prompt month rallied 0.174 to settle at 2.356. Heat and humidity along the East Coast early in the week, 100-degree temps driving power loads in California late in the week, lower Northeast production with TCO maintenance, and higher LNG deliveries this week seemed to trigger big moves in cash and finally in the futures prices.
All the moving pieces this week continue will stress injections for the balance of summer leading to a declining storage surplus. The coming week should be interesting, with traders incorporating this big price change into the supply and demand components.
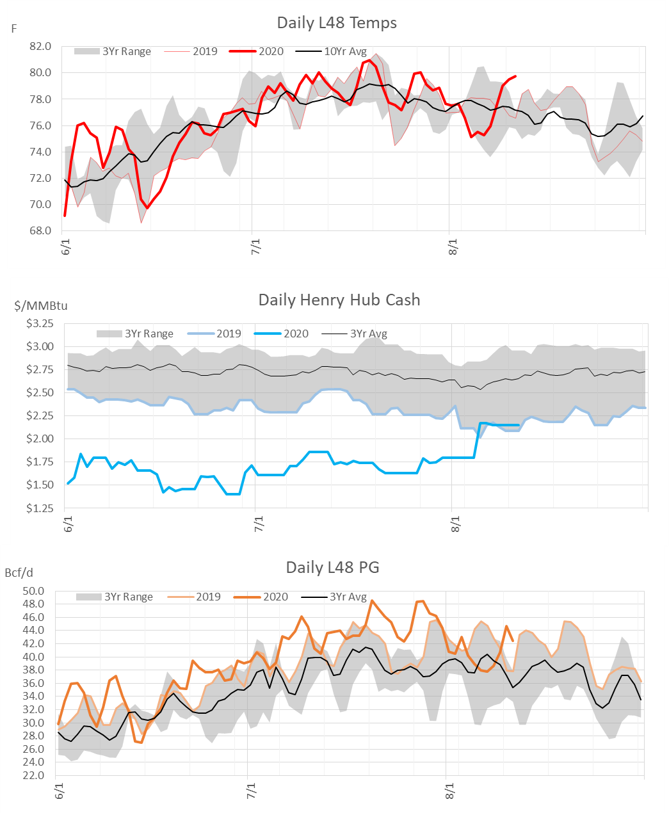
This weekend we turn out attention to power burns. In August, power burns are averaging 41.6 Bcf/d, down sharply from July. The July average was 43.7 Bcf/d, with a peak set on July 20th of 48.5 Bcf/d. July burns hit record levels as each day during the month hovered well above normals, and prices for prompt month stayed below $2/MMbtu.

The power burn story of July can be summarized with the following three charts.
High temps + Low prices = high burns

In August the story has been slight different. This month temperatures equivalent to ones seen last month have yielded lower power burns.
Surging cash and front month price starting on Aug 3rd and now Aug 14th has impacted burns significantly. Month to date, cash prices at the Henry Hub have averaged $2.05, up 35 cents or nearly 21% from a July average at $1.69/MMBtu.
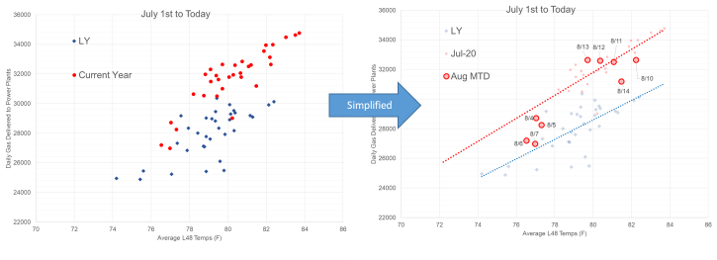
To show how the higher prices are leading to lower burns, we turn to the pipeline nomination data to see how gas deliveries to power generators have changed in August relative to July. Let’s remember that this data is a look at nomination data prior to the big price moving in cash and futures markets on Friday.
For this exercise, we aggregated the daily pipeline nomination data from across the L48 that has been tagged as a delivery to power plants and charted that against L48 gas-weighted temps. The nomination data gives us nearly a 65-70% sample of daily power burns.
In first half of the month, the sample power delivery data averaged 29.8 Bcf/d at an average temp of 79.5 degrees. At the exact same temperatures last month, power delivery data should have shown about ~31.0 Bcf/d.

Note: This chart only shows the week days
Ultimately, so far this month the lower burns have helped negate some of the additional LNG exports we have observed in August so far. That being said, with the move on Friday we can expect burns to be even lower adding to the end of season storage levels.
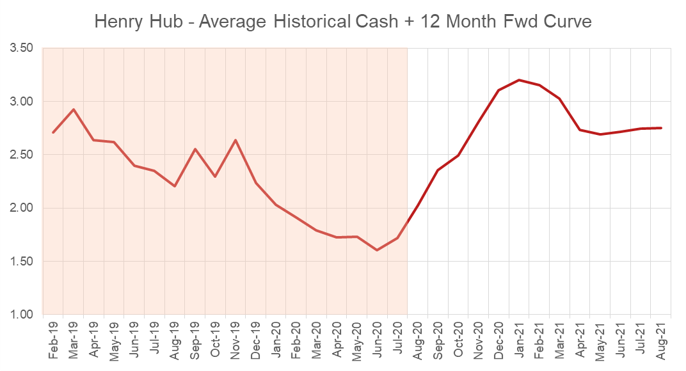
Looking into the winter we have a number of S/D forces to consider. In our opinion, power generation is the fourth most important after outright production levels, LNG export levels, and rescomm demand (winter temps).
With that in mind, power burns can still be used as a flexible component to keep things in check. We look at the Henry Hub prices as a proxy, but fully recognize that regional prices ultimately drive power burns.
Entering the weekend, the winter futures strip averaged $3.06/MMBtu – with 4 month above $3/MMBtu. This is well above last year’s average cash price $2.12/MMBtu, telling us that traders are expecting tight winter conditions despite (potentially) entering the winter at record levels.

Fundamentals for week ending Aug 14: Our early view for the upcoming storage report is a +37 Bcf injection for the lower 48. This would take storage levels to 3370 Bcf.
US natural gas dry production remained flat week on week with domestic production averaging 86.4 Bcf/d for the week. Earlier in the week, Northeast production was lower with maintenance on the Columbia Gas (TCO) system. Most of the lost production on Aug 11th got quickly rerouted to TETCO resulting in minimal change to overall production levels. The maintenance should be completed by Monday.
Total natural gas demand was higher than the previous week, with power burns showing a 2.1 Bcf/d week-on-week increase. Warmer temperatures in the Midwest and Northeast were the main drivers. California also started to heat up, but the real heat arrive on Friday through the weekend.
Canadian imports were higher last week averaging 4.9 Bcf/d. Mexican exports averaged of 6.0 Bcf/d.
Deliveries to LNG facilities averaged 4.4 Bcf/d, up another 0.5 Bcf/d week on week.
Expiration and rolls: UNG ETF roll starts on Aug 13th and ends on Aug 18th.
September futures expire on August 27th, and September options expire on August 26th
This email, any information contained herein and any files transmitted with it (collectively, the Material) are the sole property of OTC Global Holdings LP and its affiliates (OTCGH); are confidential, may be legally privileged and are intended solely for the use of the individual or entity to whom they are addressed. Unauthorized disclosure, copying or distribution of the Material, is strictly prohibited and the recipient shall not redistribute the Material in any form to a third party. Please notify the sender immediately by email if you have received this email by mistake, delete this email from your system and destroy any hard copies. OTCGH waives no privilege or confidentiality due to any mistaken transmission of this email.
