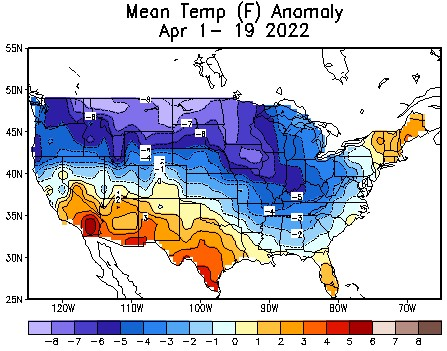
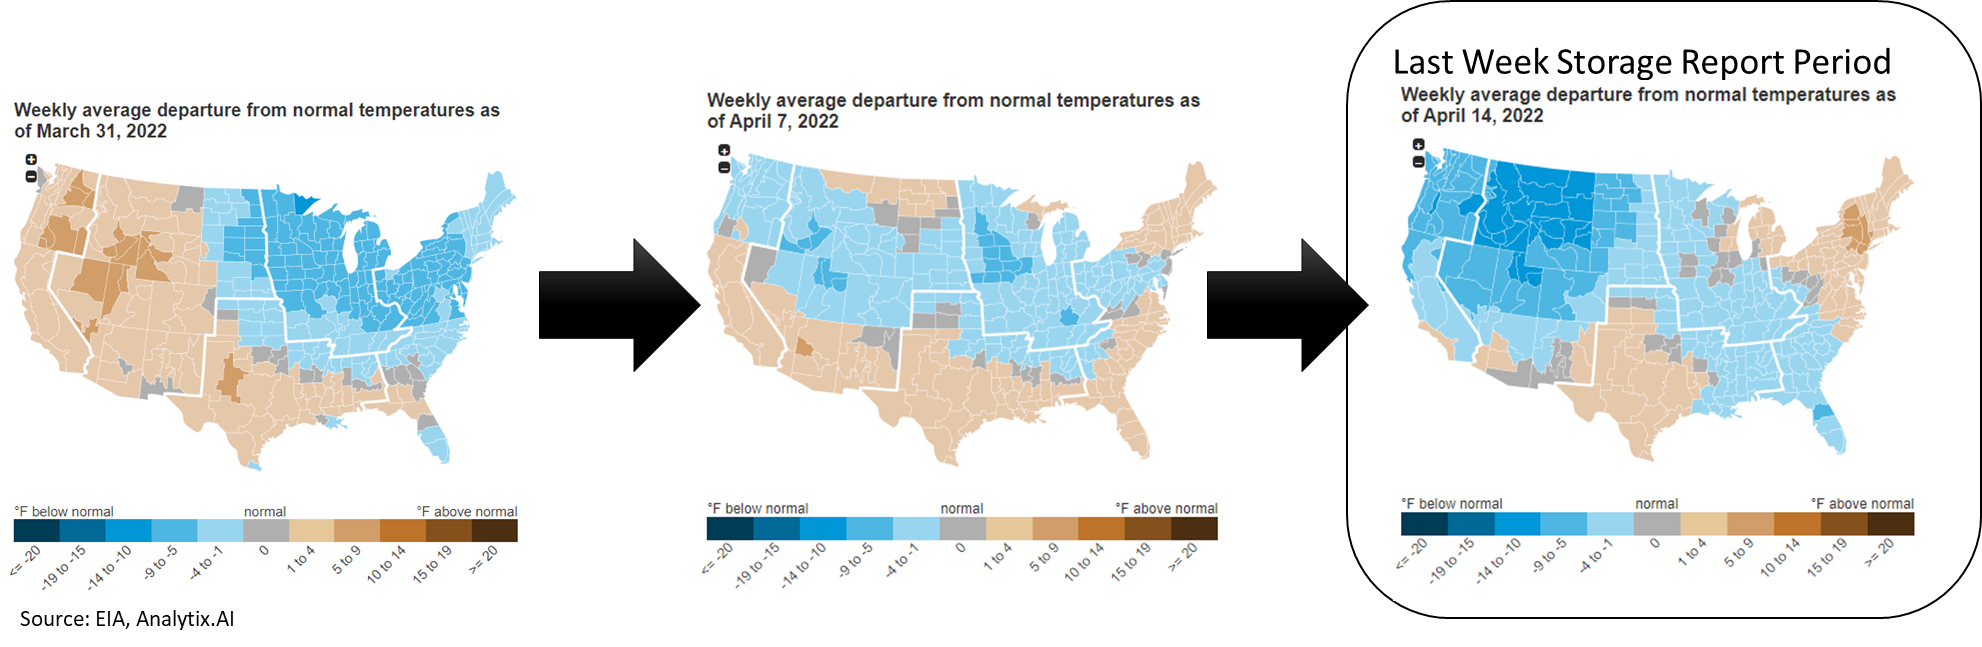
This week we start by looking at some of the upcoming summer weather trends. So far April has been wildly variable the last few years, and this year is no exception. We had Nor’easters, blizzards in the plains, heavy rain, wind storms, heat waves, and the list goes on. Here is a quick graphics shared by the team at Bespoke Weather of the mean temp anomaly for the first 2/3 of April. It has been an impressively cool April up north leading to the HDDs piling up.
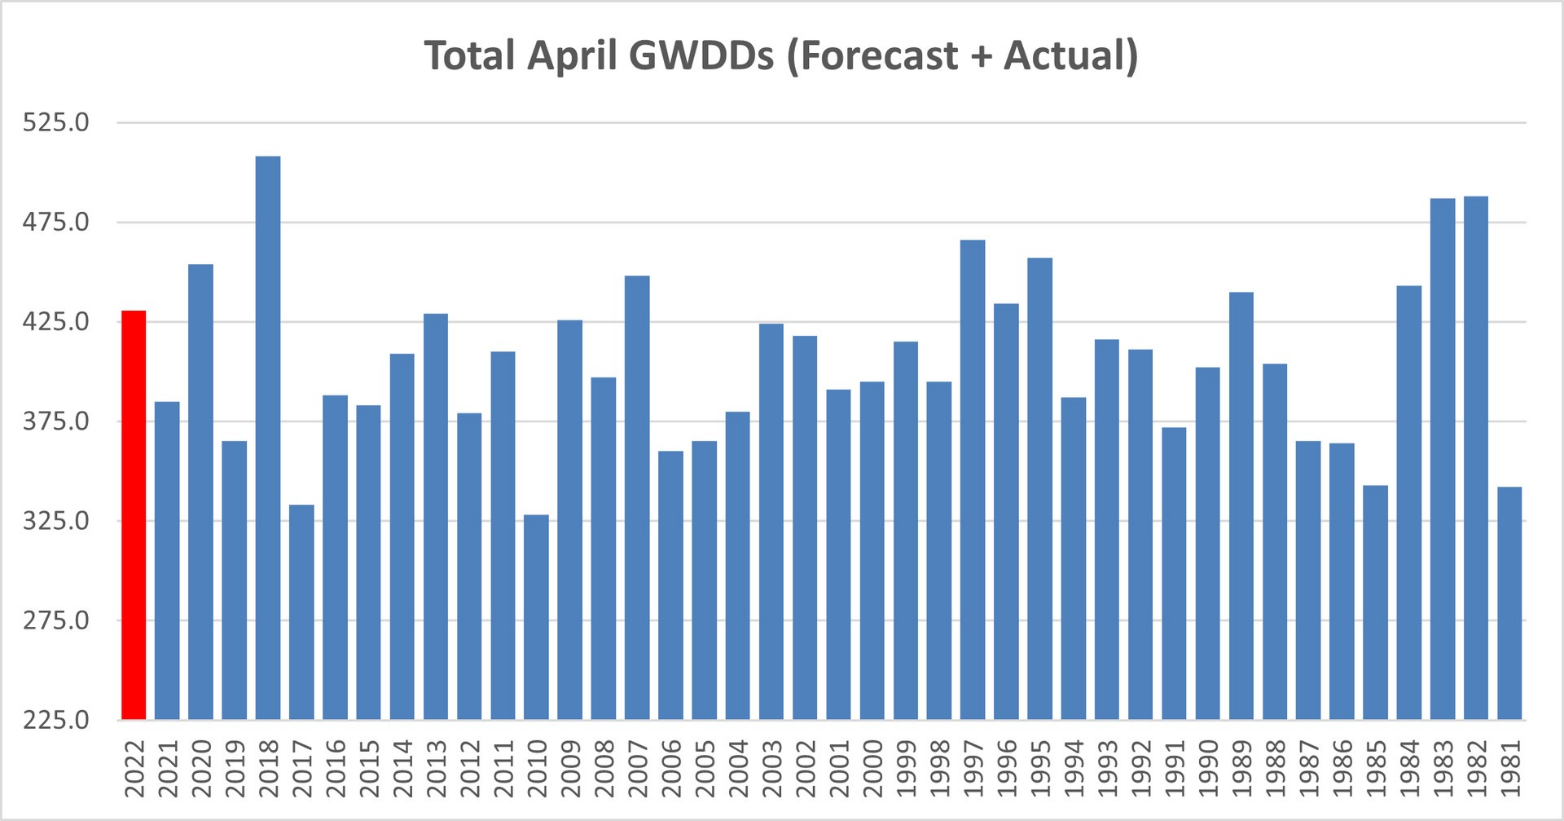
The projected total April demand (GWDDs count) is forecast to be much higher year-on-year, but the last few Aprils have been very variable (as seen in the Bespoke Weather chart below).
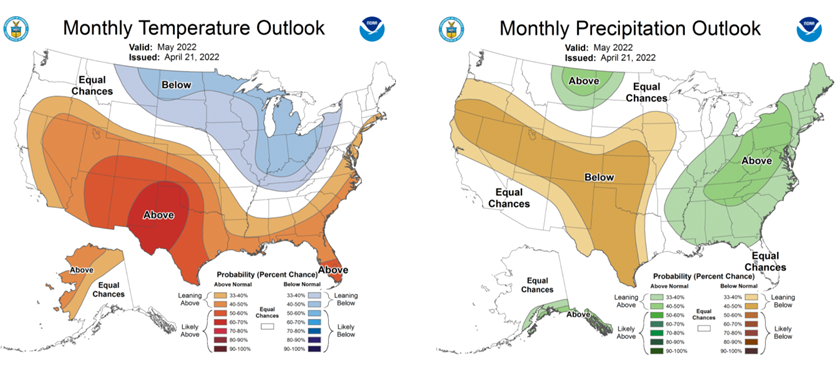
This week NOAA released its longer-term outlooks. The NOAA CPC outlook is based on its dynamic computer models and statistical models.
The latest May outlook map favors elevated odds for cool and wet conditions in the North Plains and East Midwest and hotter/drier SW Plains. This outlook amplifies the drought condition already present from California to Texas.
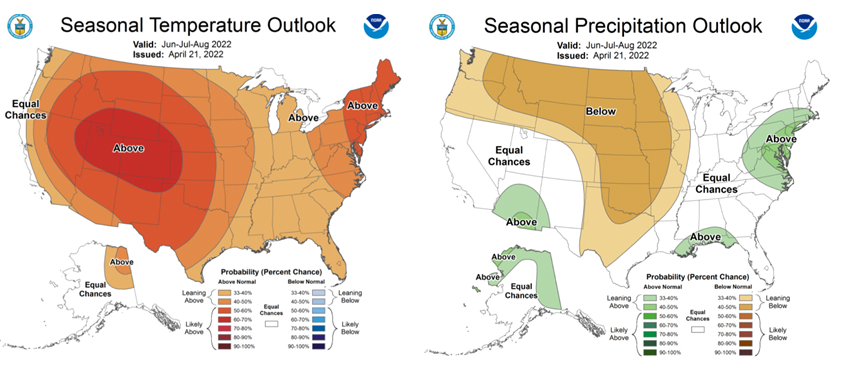
The summer peak months are even more extreme. The NOAA summer maps favor high odds for heat and dryness across much of the country with below-normal precipitation. This will greatly keep power loads elevated and impact the much-needed hydro gen. Hydro gen was already quite low last year, and it appears we are setting up for a bit of the same.
Here is a quick look at the ERCOT power load for Q2 (weekdays only). As can be seen, it has been quite elevated with the heat the region has experienced this month so far. Natgas demand has not jumped though because we have had incremental wind/solar capacity along with overperformance of the available capacity taking on the increased load. That being said, if the US does experience the type of summer that is shown above then we are going to see gas burns jump year-on-year.
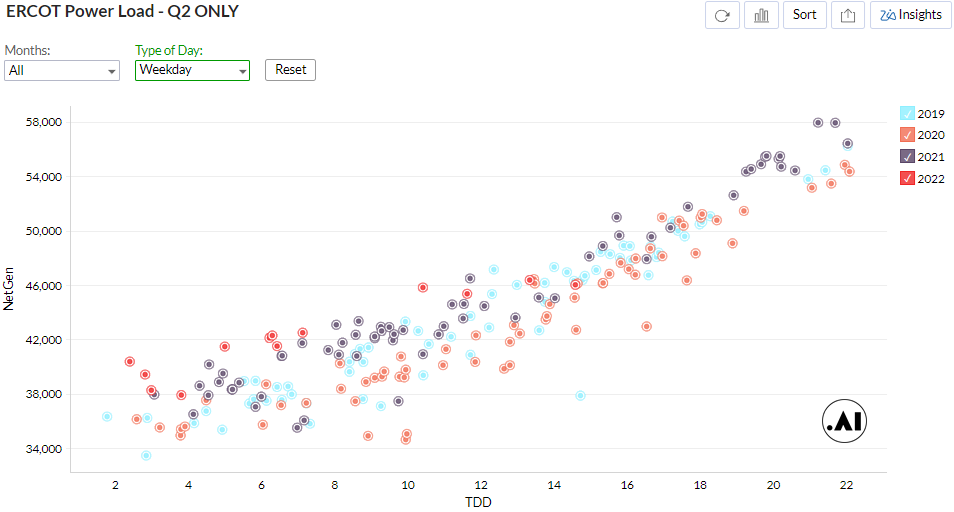
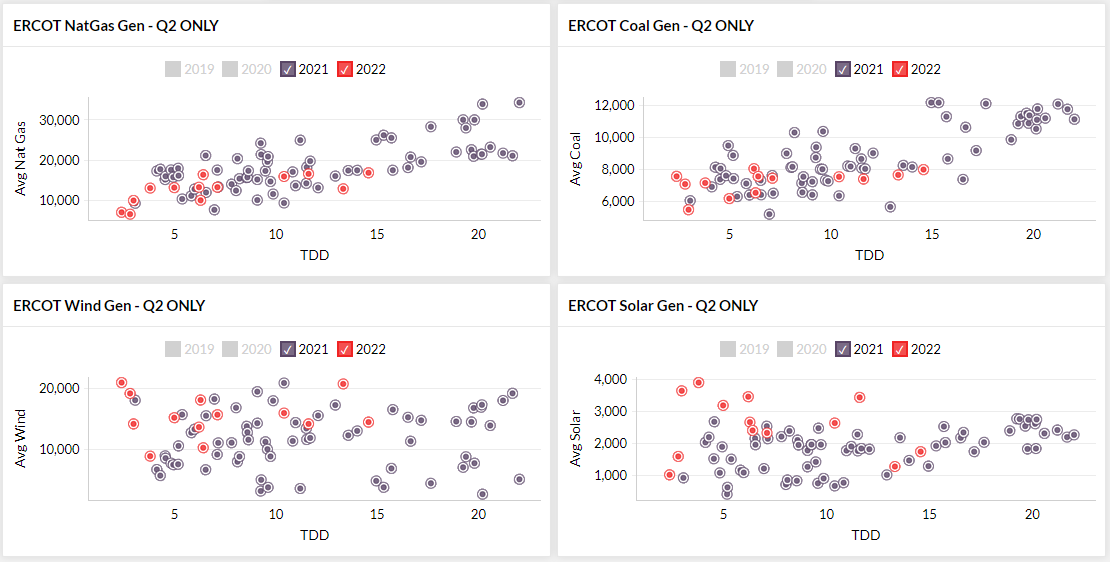
[The charts above are from our analytix.ai dashboards. Drop me a line at het@analytix.ai to get access]
Storage Fundamentals:
The EIA reported a +53 Bcf injection for the week ending Apr 15th, which came in much higher than market estimates. We estimate this report was ~0.4 Bcf/d loose vs LY (wx adjusted). This is quite opposite to the +15 Bcf injection we had the previous week, which we calculate to be 2.4 Bcf/d loose vs LY (wx adjusted).
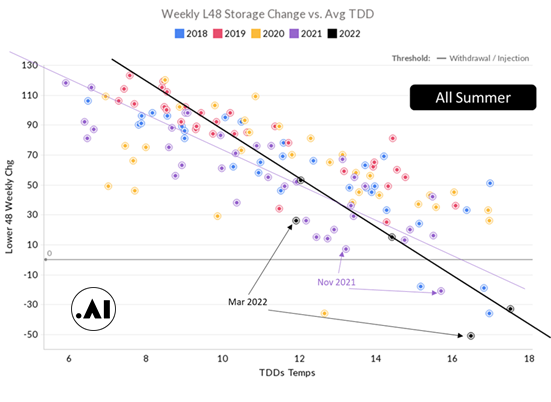
These are just the first two bullet points for the 2022 summer season, and so far we have no clear signal on the trajectory storage injections will take. Here are some quick charts for the analytix platform showing summer injection vs the last 4 years.
[all these charts are interactive and can be found at EIA Storage Charts – ANALYTIX.AI]
As can be seen, the current storage reports are close to LY storage levels on a wx adjusted basis.
If we drill down just to Q2 for each of the year, the story looks somewhat different. The last three storage numbers actually look loose relative to last year’s summer activity on a weather adjusted basis.
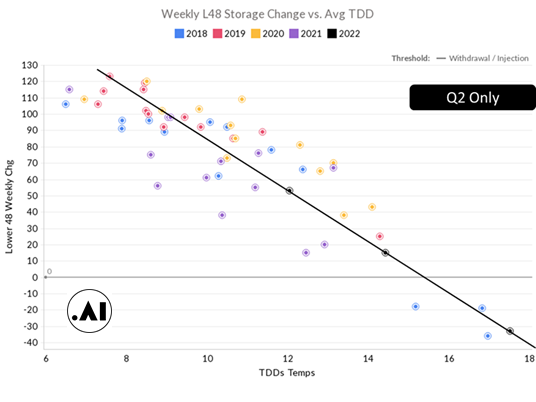
In our opinion, it’s still too early to make any real judgment and hence we see this immense price volatility.
That being said, the weather will ultimately choose this summer’s destiny. ISO power data is already suggesting 5% higher power loads YoY at similar temperatures. If the heat scenario (as shown above) plays out, then we are looking at some smaller than expected storage injections leading to a low end of storage season. With 10Y normal weather modeled for the summer, we and most vendors are getting to a 3300 Bcf end of Oct.
Back to last week’s storage report. The report showed levels reaching 1450 Bcf, which is 399 Bcf less than last year at this time and 285 Bcf below the five-year average of 1,667 Bcf.
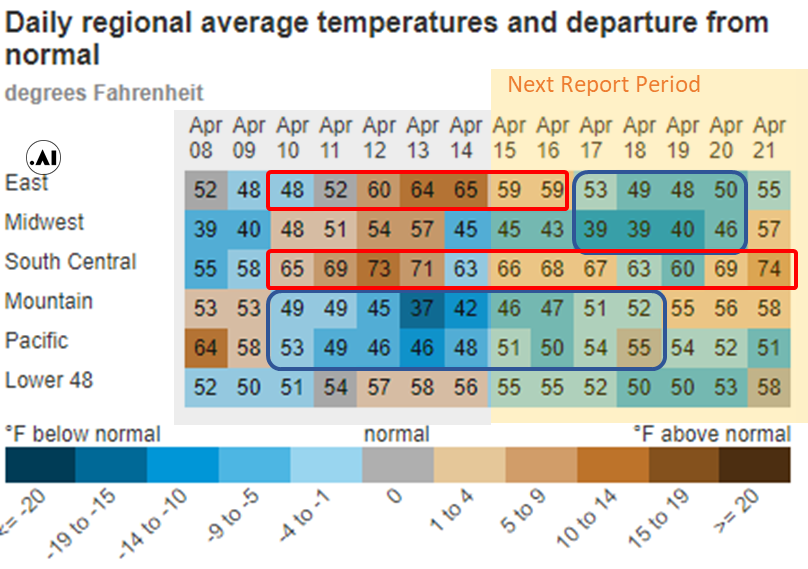
The larger than anticipated injection was primarily due to warm/neutral temps in the South Central and Northeast. At the L48 level, GWHDD increased by -2.3F relative to the previous week; resulting in a 2.7 Bcf/d decrease in natural gas consumption for space heating (rescomm only). The Rockies to the West coast were much cooler but they have little influence on the GWHDD calculation and gas consumption due to the low-density population in those areas.
Power loads were essentially flat relative to the previous week. NatGas gen was also unchanged, as the decrease in Nuke & Hydro was offset by an increase in Wind.
For the week ending Apr 22th, our early view is +34 Bcf. This reporting period will take L48 storage level to 1,484 Bcf (-412 vs LY, -311 vs. 5Yr)
This summer has already been quite volatile weather-wise. Just this past week, the Northeast experienced a late-season Nor’easter that brought heavy snow that knocked down trees and power lines. In Calgary (where I’m at), we got a bit of the same. We received 12″-16″ of snow in a 12-hour period starting Wednesday AM. Overall temps were cooler everywhere except in the deep South which experienced well-above normal weather.
The net result was the L48 GWHDD increased by 1.6F relative to the previous week; resulting in a 2.0 Bcf/d increase in natural gas consumption for space heating (rescomm only).
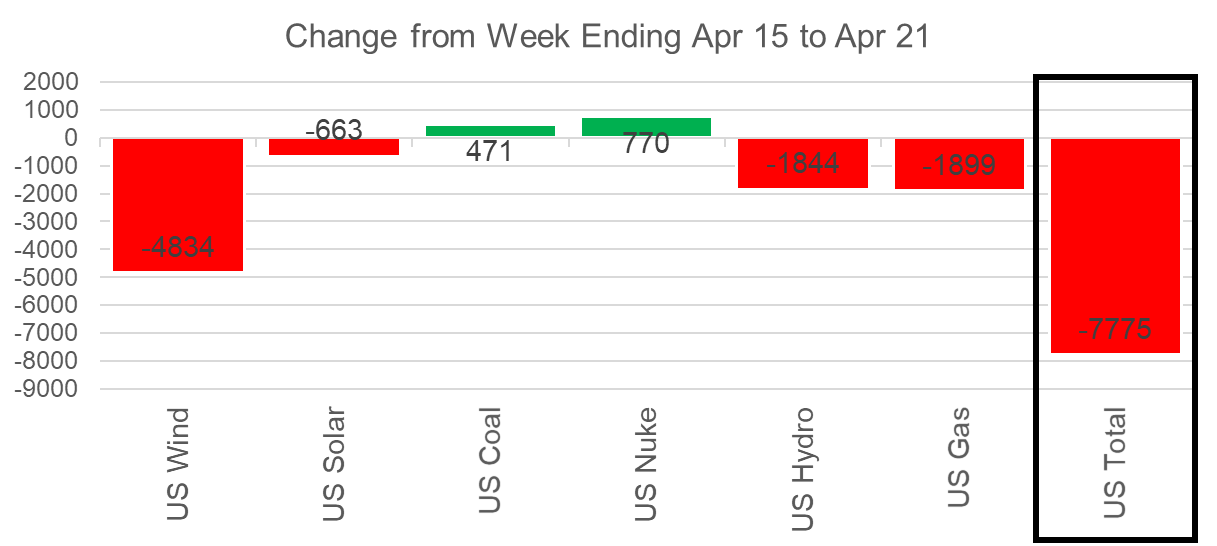
Overall, the power load was lower week-on-week. This is just noise during the shoulder season. All generation types other than coal and nuke were slightly off week-on-week at the national level.
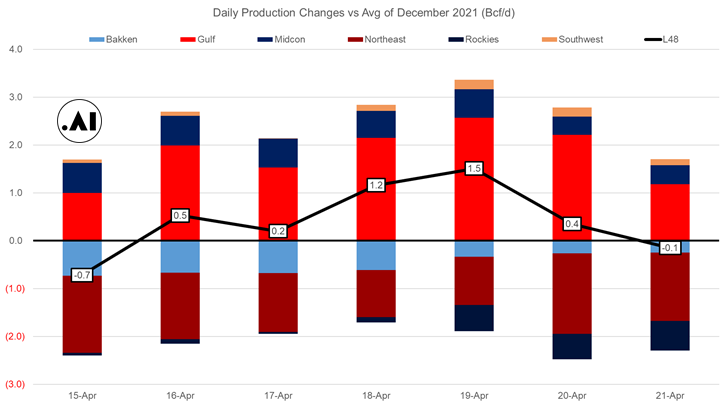
Domestic dry gas production was flat (+0.2 Bcf/d WoW), with a drop in Bakken being offset by higher Northeast production. We usually don’t see much movement out of Bakken production as it’s relatively small, but this can happen with pipe maintenance. Even though the production average was flat week-on-week, we did see a big boost in SC and NE production midweek. That did not last long with production coming at the end of the week. The chart below shows production relative to December’s average level.
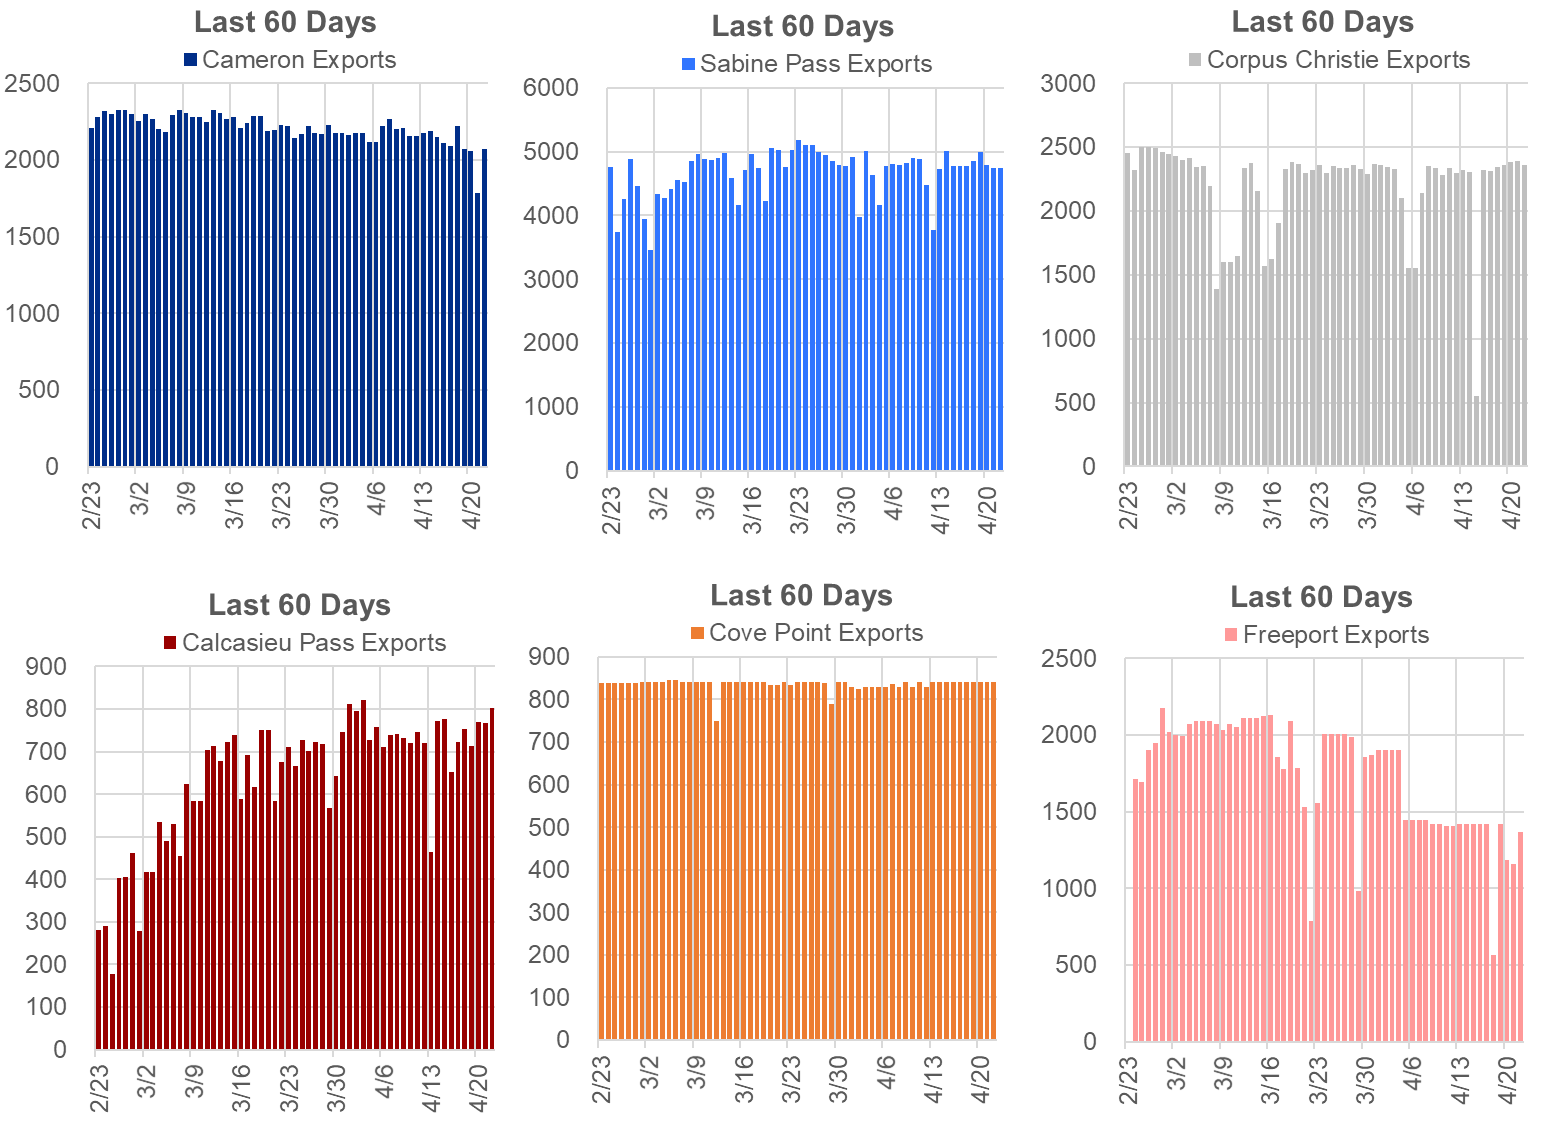
Deliveries to LNG facilities averaged 12.2 Bcf/d, which was -0.3 Bcf/d lower than the previous week. Freeport had some maintenance on T1 that continued into this week. The deliveries to the plant fluctuated between 0.6 and 1.4 Bcf/d throughout the week.
The net balance was -2.3 Bcf/d tighter week-on-week.
This email, any information contained herein and any files transmitted with it (collectively, the Material) are the sole property of OTC Global Holdings LP and its affiliates (OTCGH); are confidential, may be legally privileged and are intended solely for the use of the individual or entity to whom they are addressed. Unauthorized disclosure, copying or distribution of the Material, is strictly prohibited and the recipient shall not redistribute the Material in any form to a third party. Please notify the sender immediately by email if you have received this email by mistake, delete this email from your system and destroy any hard copies. OTCGH waives no privilege or confidentiality due to any mistaken transmission of this email.