This week, we dig into the strong gas burns. The market looks to be picking up on this theme this past week with the summer natgas strip shooting well past $6. The strong performance of gas generation has been a phenomenon we have been seeing since last summer, but it might be more of an issue this summer with power loads growing. The lower coal inventory and production trends have finally got to a point where the C2G flexibility no longer exists.
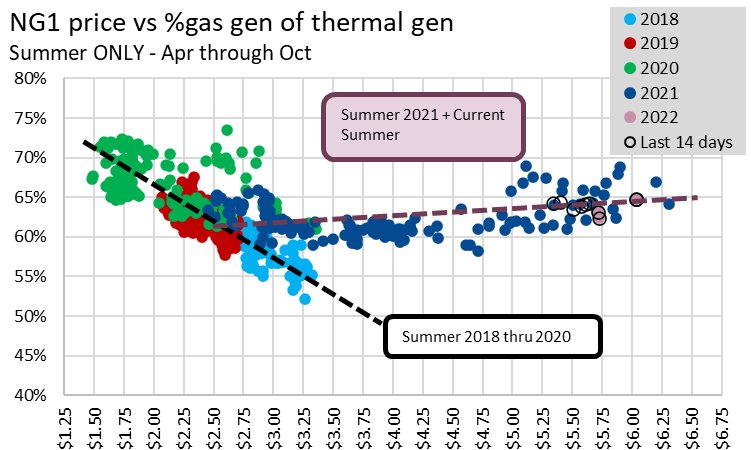
To start today’s discussion, the chart below gives a brief history of summer gas generation relative to coal over the last 4 years (daily points) – more simply put it’s the coal to gas switching dynamic. The y-axis show gas generation as a % of total thermal generation, and the x-axis shows the prompt month price.
Before 2021, it’s very obvious that the gas share falls as gas prices increase. Last year (actually starting in late summer 2020), we see those dynamics change drastically where natgas burns remained steady at 60-70% of the thermal stack despite the big price moves. In fact, the gas share has been increasing even with prices moving above $6 (a bit worrisome).
The chart also shows the first week of April 2022, and the dynamics look similar.
One of the reason power burns have remained strong despite the natgas price rally is that spot coal prices have made epic moves as well. The lower coal production, along with already low stocks have sent prices skyrocketing. Here is a view of basin level prices from EIA/SNL:
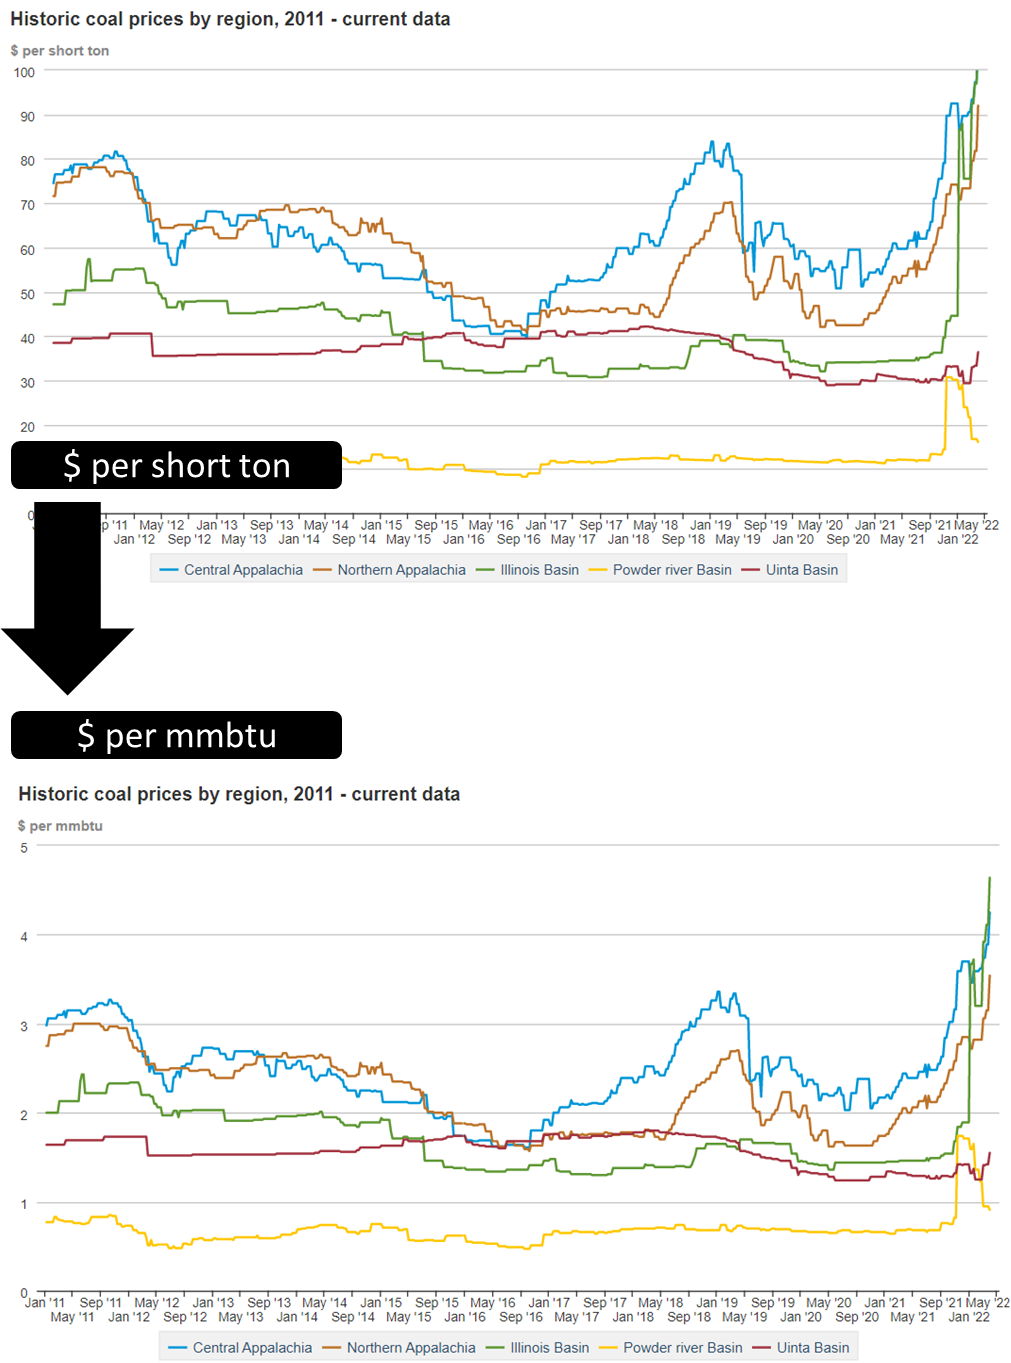
Source: EIA
As an estimate to understand how coal prices compare to gas prices, we add in the rough rail transport cost. This comes from the preliminary 2020 average basin to state cost reported by the EIA. Here are some example costs:
Central App to Virginia is $20.24/ton or $0.81/MMBtu*
Powder River Basin to Illinois is roughly $19.17 or $1.09/MMBtu*
[Send me an email if you are interested in more details on rail costs: het@analytix.ai]
So with the rail transport included, delivered coal to downstream markets is roughly $2.00/MMBtu (PRB) to $5.00/MMBtu (Central App & Northern App).
*Note that heat content and SO2 levels vary widely between regions

We should note that most coal plants have long-term contracts for coal deliveries. So the spot prices only applies to plants with no existing deliveries and ones looking to ramp up above expected levels a few months out. (that’s the beauty of natgas which can be delivered instantaneously through pipelines, while rail logistics are a bit more difficult.)
Final Thought: One last set of data we wanted to show leads us to believe that the extreme power burns could push out into the summer. We believe this is the data series that is waking up the bulls.
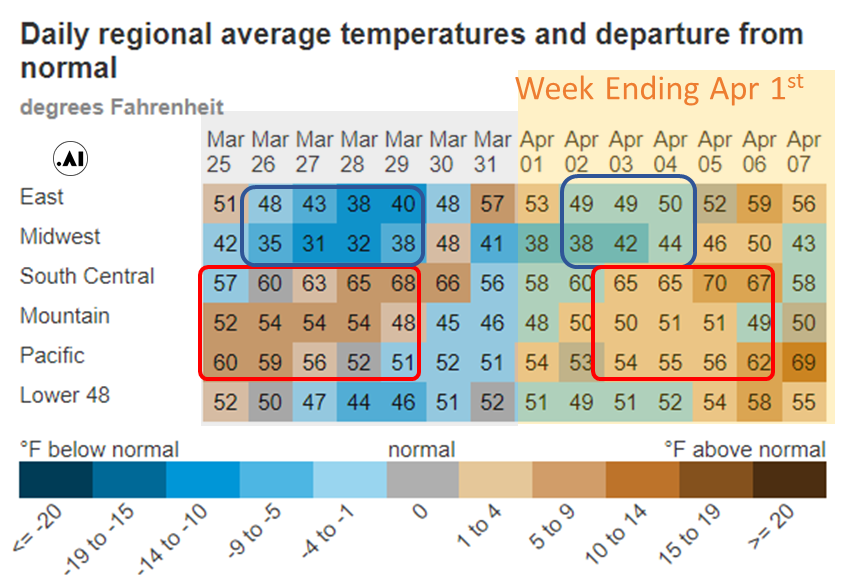
The following table does a YoY comparison of price, weather, and power dynamics side by side.
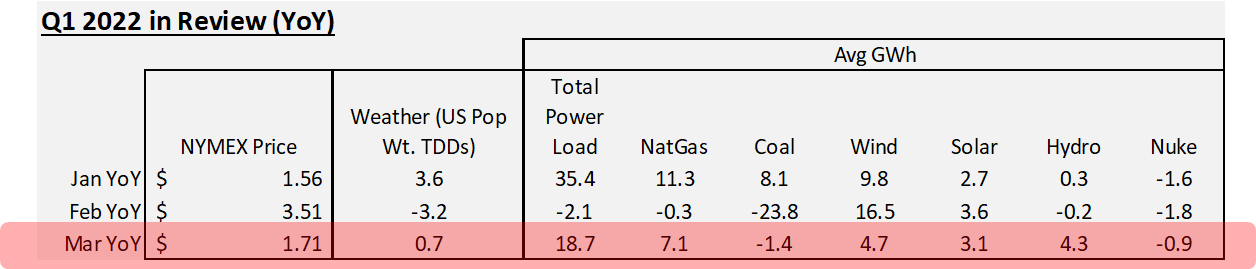
We will focus specifically on March which shows Price Settles higher by +1.71 (Mar settlement), Weather flat, and Total Power Load higher by an average of 18.7 GWh or 5%. The higher YoY power load is the concern here. In March the higher power load was met by hydro, wind, solar, and nat gas (38%). Coal did not help at all despite the large change in price.
Going into this summer, if the load remains elevated by 5% then we can expect a higher reliance on gas generation. [this is especially true knowing that hydro is going to be lower than normal, wind/solar could potentially not show up like last July, and coal gen might be tapped out]
Storage Fundamentals:
The EIA reported a -33 Bcf injection for the week ending Apr 1st, which came in higher than market estimates. We estimate this report was ~0.2 Bcf/d tight vs LY (wx adjusted).
Storage levels were reported to be 1382 Bcf. So after all the fireworks this winter we end at a relatively decent level. We had been expecting a 1300 EOS back in Nov, but that quickly inflated to 1600 with the warm and strong production in Dec. All that looseness unwound quickly right on Jan 1st as the weather turned cooler and higher demand and production freeze-offs plagued us for the remainder of winter. The current storage level is 399 Bcf less than last year at this time and 285 Bcf below the five-year average of 1,667 Bcf.
The last draw of the season was was primarily due to cool temps across the East Coast and Midwest which led to strong draws in those regions. All other regions saw small injections. At the L48 level, GWHDD increased by +5.5F relative to the previous week; resulting in a 6.3 Bcf/d increase in natural gas consumption for space heating (rescomm only). The Rockies to the West coast were quite warm but have little influence on the GWHDD calculation and gas consumption due to the low-density population in those areas.
Power loads were higher by 3.7% relative to the previous week. Wind generation held steady, while solar was higher. The rise in the power load was mainly made up of higher natgas (2/3) and coal gen. The higher gas gen resulted in 1.4 Bcf/d of additional gas burned.
For the week ending Apr 8th, our early view is +26 Bcf. This reporting period will take L48 storage level to 1,408 Bcf (-428 vs LY, -292 vs. 5Yr)
With the start of summer, it still kind of feels like the back half of winter. There are wild weather episodes across the country ranging from heavy rain, snow, strong winds, and intense heat. Weather still looks to have a heavy influence on prices this past week. At the high level, temps in the East and Midwest remained cool to start the week, while the rest of the country was generally hot. The net result was L48 GWHDD decreasing by -3.4F relative to the previous week; resulting in a 5.5 Bcf/d decrease in natural gas consumption for space heating (rescomm only). Some portions of the South and Pacific saw some extreme temps leading to cooling demand early in the summer.
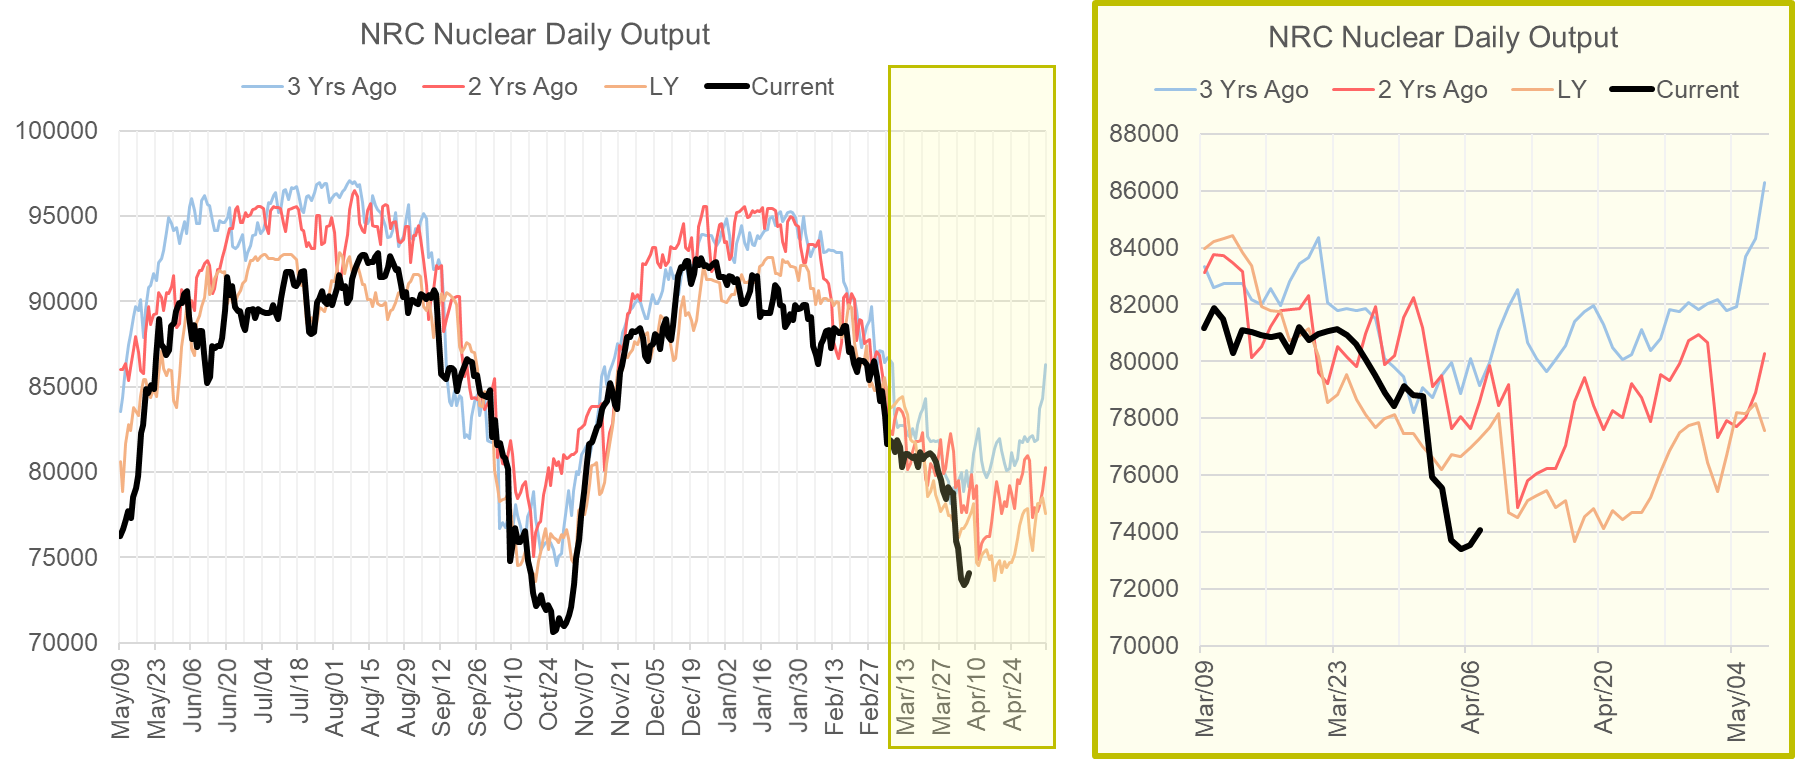
Overall, the power load was lower by 2.5% relative to the previous week. We are at a seasonal low as we enter the shoulder season. All generation types were flat week-on-week at the national level other than the nuke generation.
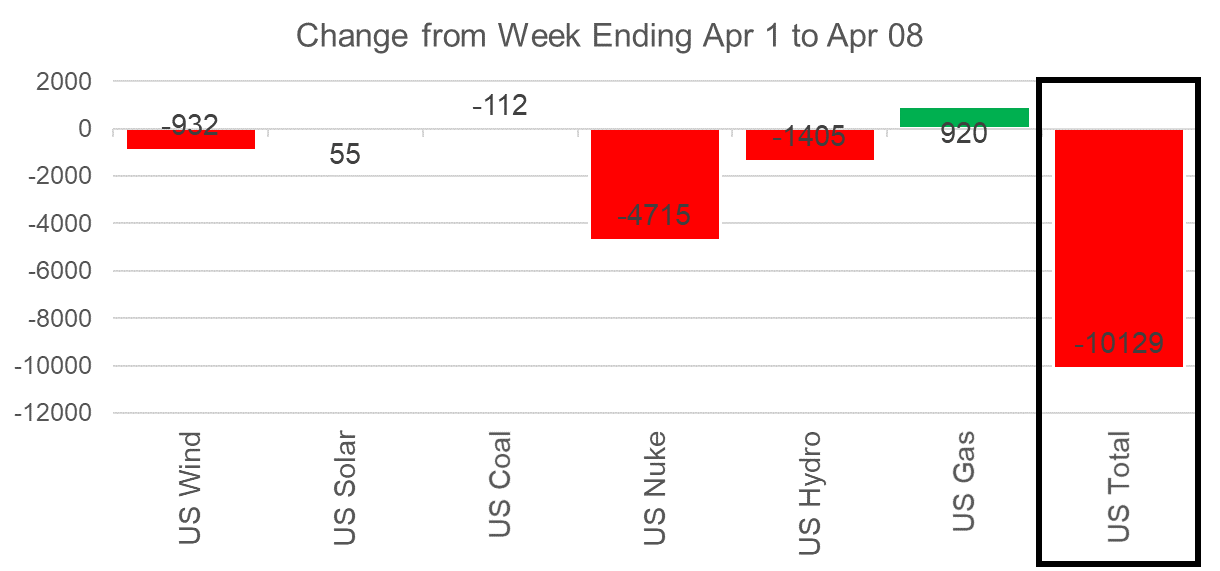
Indiana Michigan Power’s Cook Nuclear Plant started refueling on Unit 1 on April 2nd, but the plant was reduced before that to allow for equipment testing before the outage.
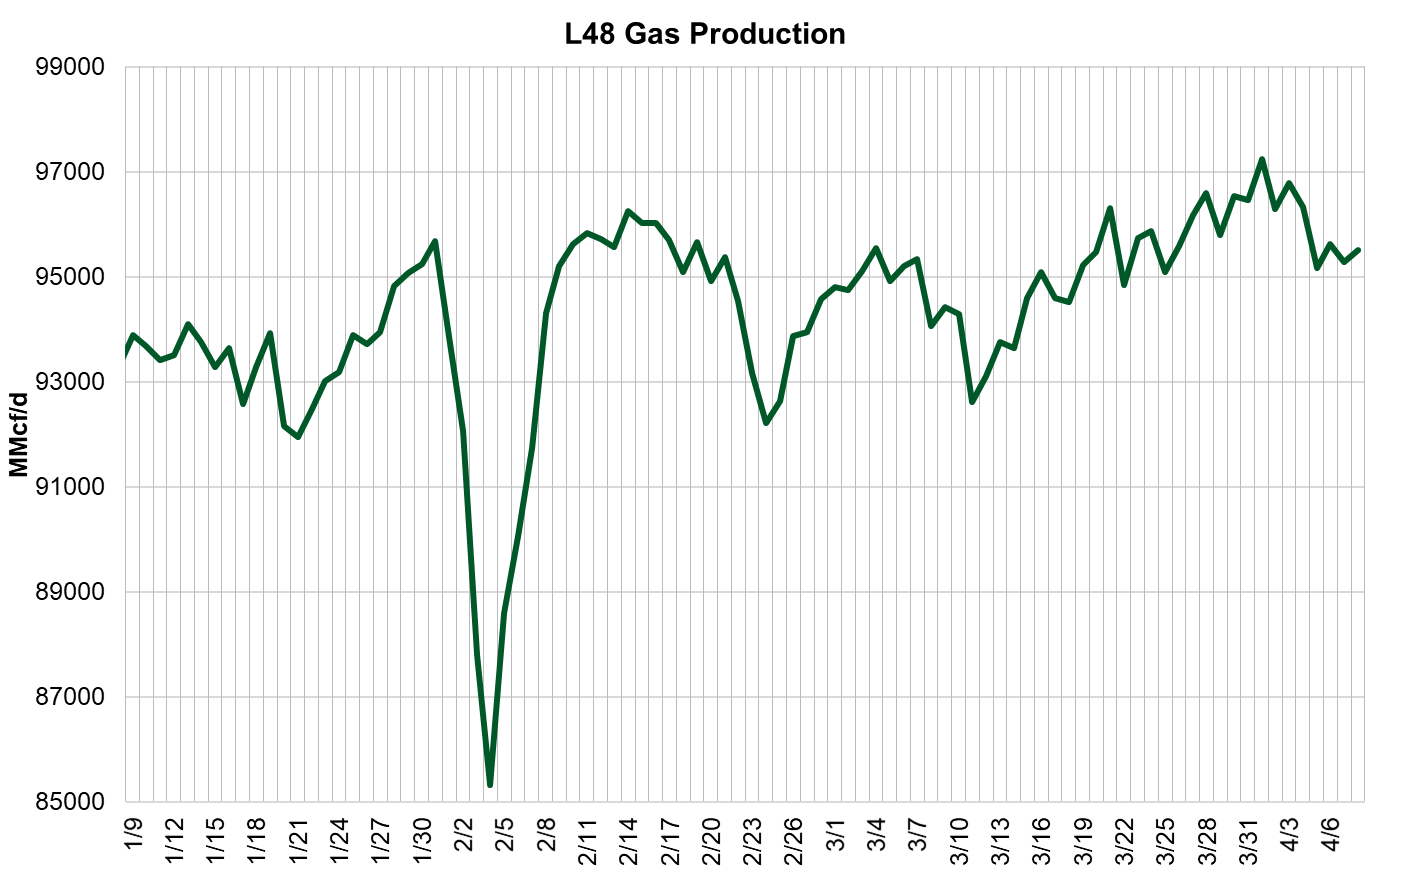
Domestic dry gas production was flat this week, with a drop in Permian production being offset by higher Northeast production. There drop in Permian products appears to be related to pipeline maintenance. We should expect some production noise with maintenance schedules ramping up in Q2. The average production for the week was higher by 0.1 Bcf/d to an average of 96.1 Bcf/d.
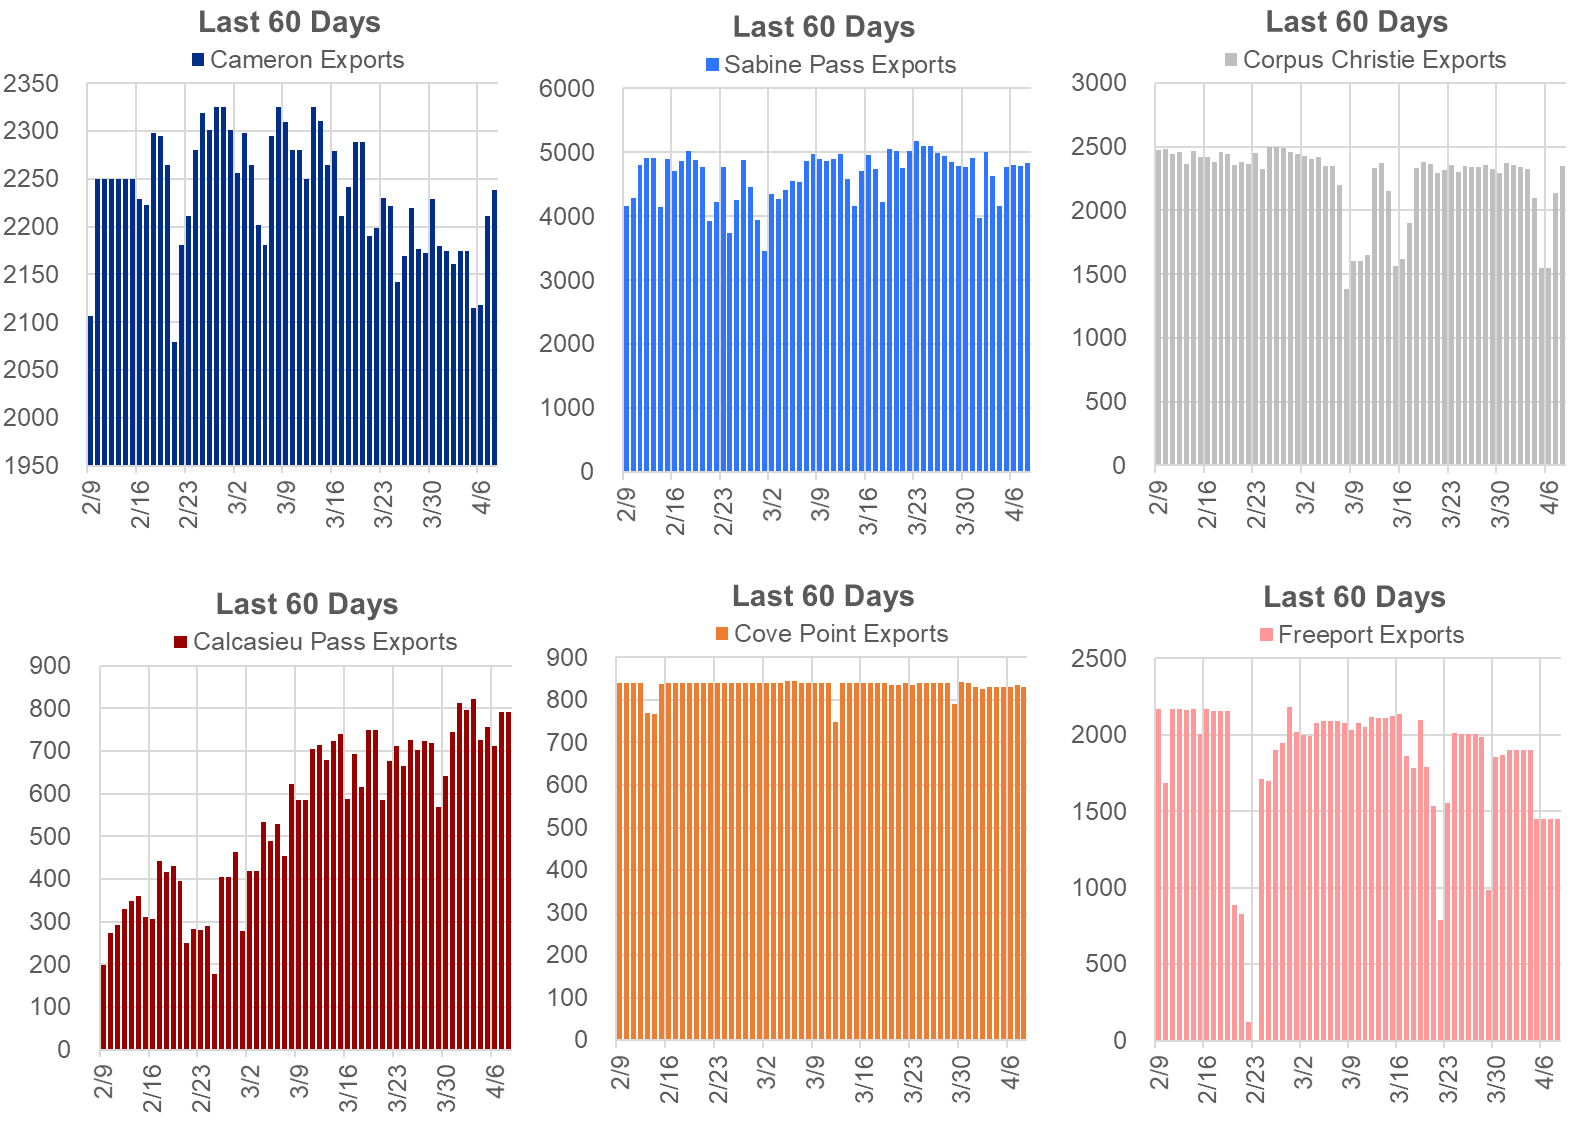
Deliveries to LNG facilities averaged 12.4 Bcf/d, which was 0.6 Bcf/d lower than the previous week. Operations at Sabine and Corpus Christie were lower by 0.3 Bcf/d week-on-week. We are uncertain of maintenance at Sabine Pass, but Corpus Christi’s trunkline had some minor maintenance at the Sinton Compressor Station lowering plant deliveries.
The net balance was 8.3 Bcf/d looser week-on-week.
This email, any information contained herein and any files transmitted with it (collectively, the Material) are the sole property of OTC Global Holdings LP and its affiliates (OTCGH); are confidential, may be legally privileged and are intended solely for the use of the individual or entity to whom they are addressed. Unauthorized disclosure, copying or distribution of the Material, is strictly prohibited and the recipient shall not redistribute the Material in any form to a third party. Please notify the sender immediately by email if you have received this email by mistake, delete this email from your system and destroy any hard copies. OTCGH waives no privilege or confidentiality due to any mistaken transmission of this email.