This week we start by getting our first glimpse of winter. This is the time of the season when all the major energy meteorologists start lining up to give their first view of which way winter goes. There are obviously varying views out there, but today we start with details from our friends at the World Climate Service (WCS).
Hit this link to get the full report, which includes their view on the European Weather: Preliminary Winter Forecast Summary
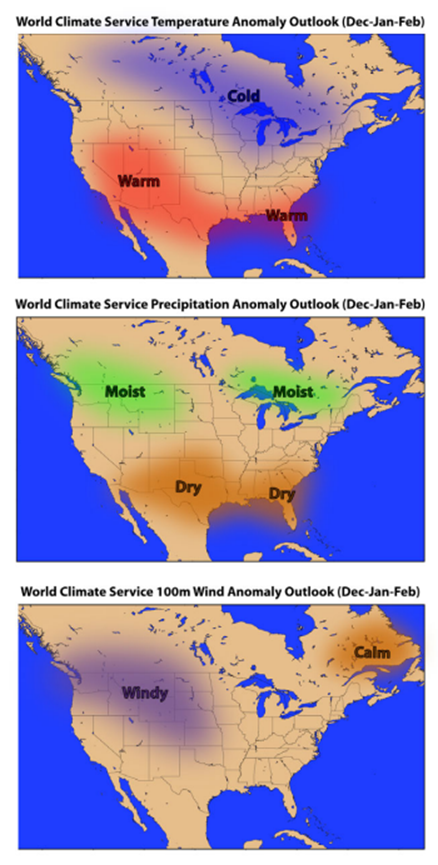
This is the WCS assessment of likely winter outcomes based on current information; hence their confidence level of the current projection is moderate. The next update will be provided in mid-November.
Summary:
• Warm in the Southwest and along the Gulf Coast (lingering influences of the La Nina)
• Cold from central Canada to the Great Lakes (chance of numerous cold air intrusions into the Ohio Valley)
• Wet in the Northern Rockies and in southeastern Canada; dry across the southern U.S.
• Above‐normal wind from the Pacific Northwest to the Plains, calm near Newfoundland
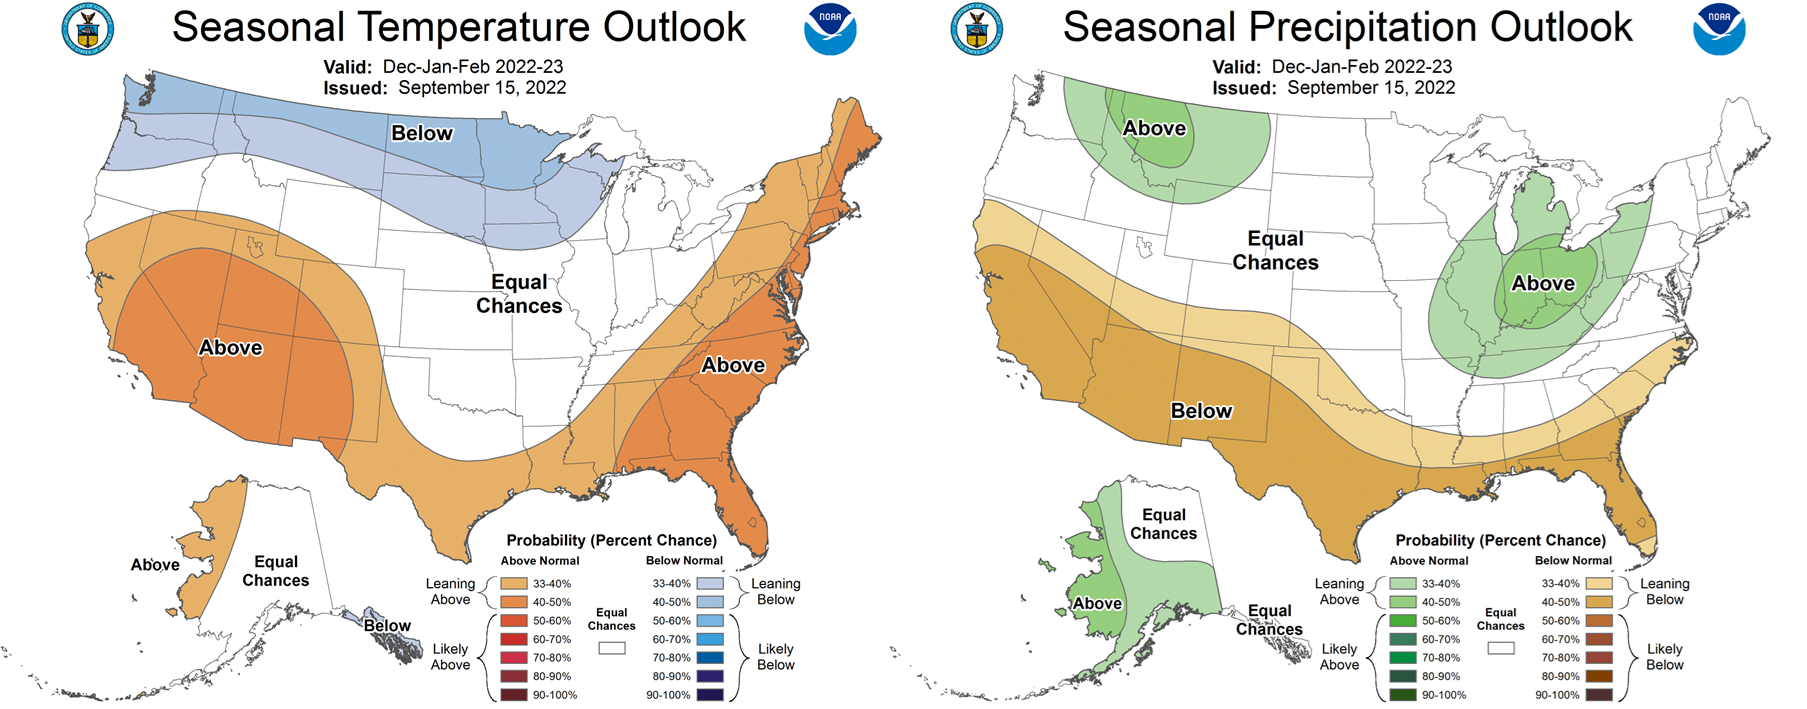
For comparison here is the latest outlook for Dec-Jan-Feb from NOAA, which looks very similar.
We also wanted to touch on something a bit more immediate, i.e. the rising activity in the Atlantics. Compared to the previous season, August and September have been unusually quiet even with the early calls for a very active hurricane season.
Currently, 4 storms are being tracked in the Atlantic by NOAA. Fiona hit Eastern Canada hard this weekend, and the storm entering the Gulf of Mexico has been named Ian.
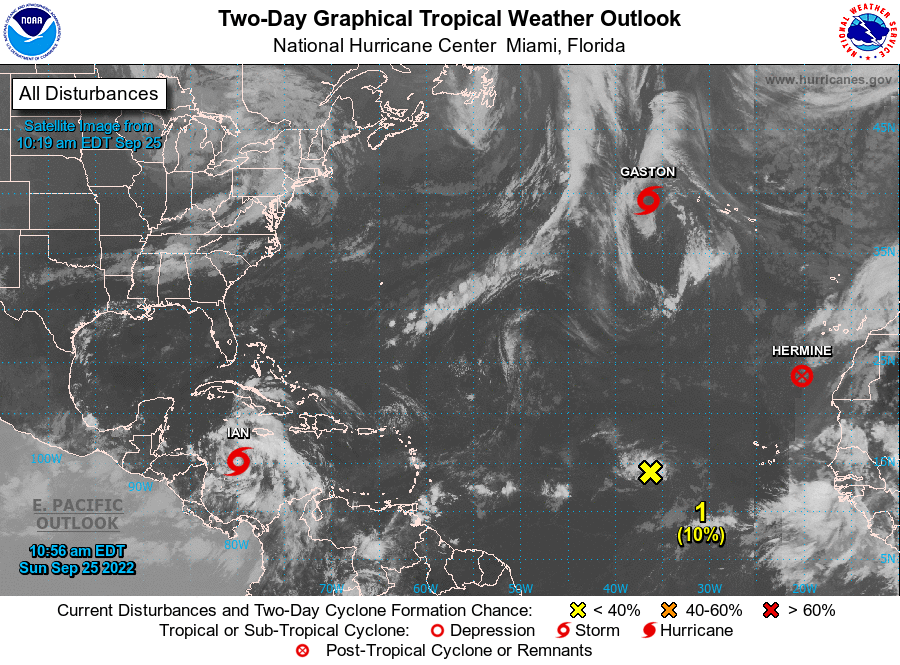
Source: https://www.nhc.noaa.gov/gtwo.php?basin=atlc&fdays=2
Typically, the impact on energy markets are hard to predict as it could be net bullish or bearish to markets. In recent years, hurricanes have impacted demand by slowing LNG exports (damage to facilities or delaying cargoes) and/or reducing gas consumption with cooler temps and power outages.
For Ian, the majority of paths now show the storm winding into Western Florida. Authorities and residents in Florida were keeping a cautious eye on Tropical Storm Ian as it travels through the Caribbean and expected to continue gaining strength and become a major hurricane in the coming days. Ian was forecast to pass west of the Cayman Islands early Monday, and then near western Cuba by Monday night and early Tuesday. It could reach Florida later in the week with the heavy winds and flash flooding to the Florida peninsula and the Florida Keys.
Current trajectory of the storm show it will likely be net bearish for natgas markets.
Source: https://www.sfwmd.gov/weather-radar/hurricane-model-plots
If the storm were to wind Eastward and impact offshore production, a good source to keep track of impacts to offshore production is the Bureau of Safety and Environmental Enforcement (BSEE) which tracks shut-in oil/gas production and the status of rigs/platforms daily. BSEE surveys 19 companies each day by 12:30pm ET and provides a report to their Newsroom by 2pm ET.
Here is a link to bookmark: https://www.bsee.gov/newsroom/news-items
Lastly, I wanted to touch on the dry conditions still present across much of Pacific, West, and South Central. Here is the current look:
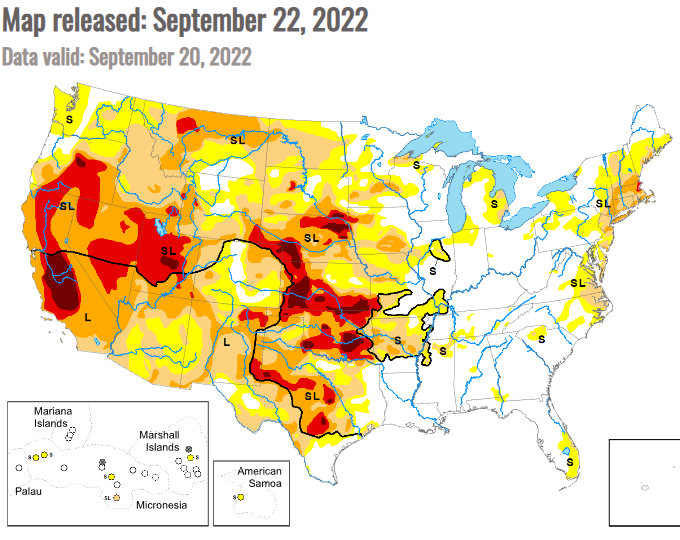
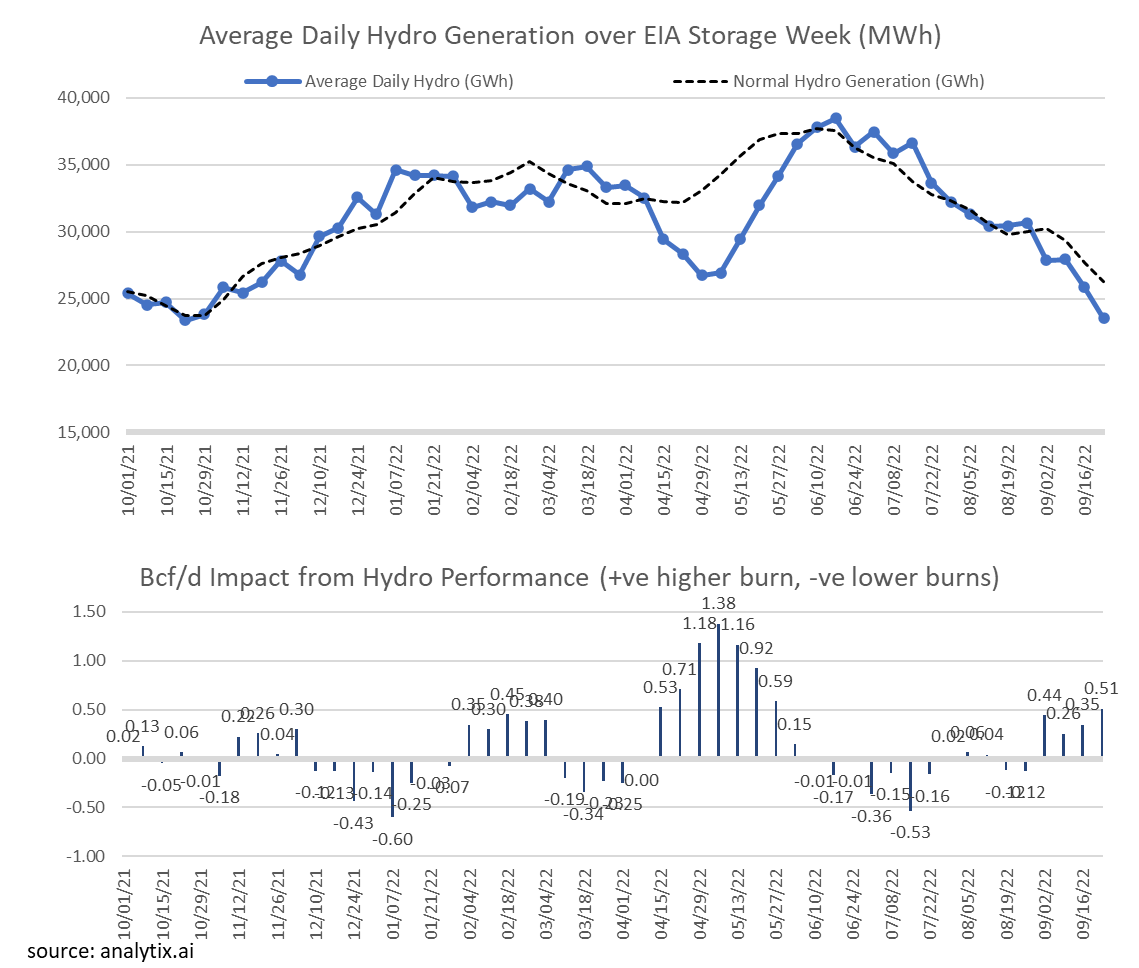
As a result of these conditions, we have seen hydro gen underperform much of the summer leading to higher power burns (assuming natgas gen is the marginal power unit). The chart below is the average GWH produced from US hydro generation each EIA compared to the expected levels based on history. The resulting over/under performance in terms of gas burns is shown in the 2nd accompanying chart.
NatGas Storage Fundamentals:
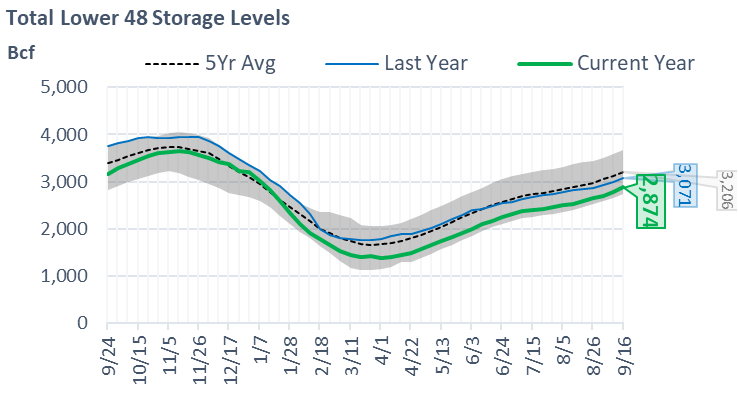
The EIA reported a +103 Bcf injection for the week ending Sept 16th, which came in much higher than our estimate of +95. This storage report takes the total level to 2874 Bcf, which is 197 Bcf less than last year at this time and 332 Bcf below the five-year average of 3,206 Bcf. This was only the 2nd 100+ injection of the year, after week ending June 3rd.
Here are the few factors that changed WoW that led to the triple-digit storage injection:
- Total supply remained strong at over 100 Bcf/d, but this wasn’t the moving factor as it was in line with the previous week.
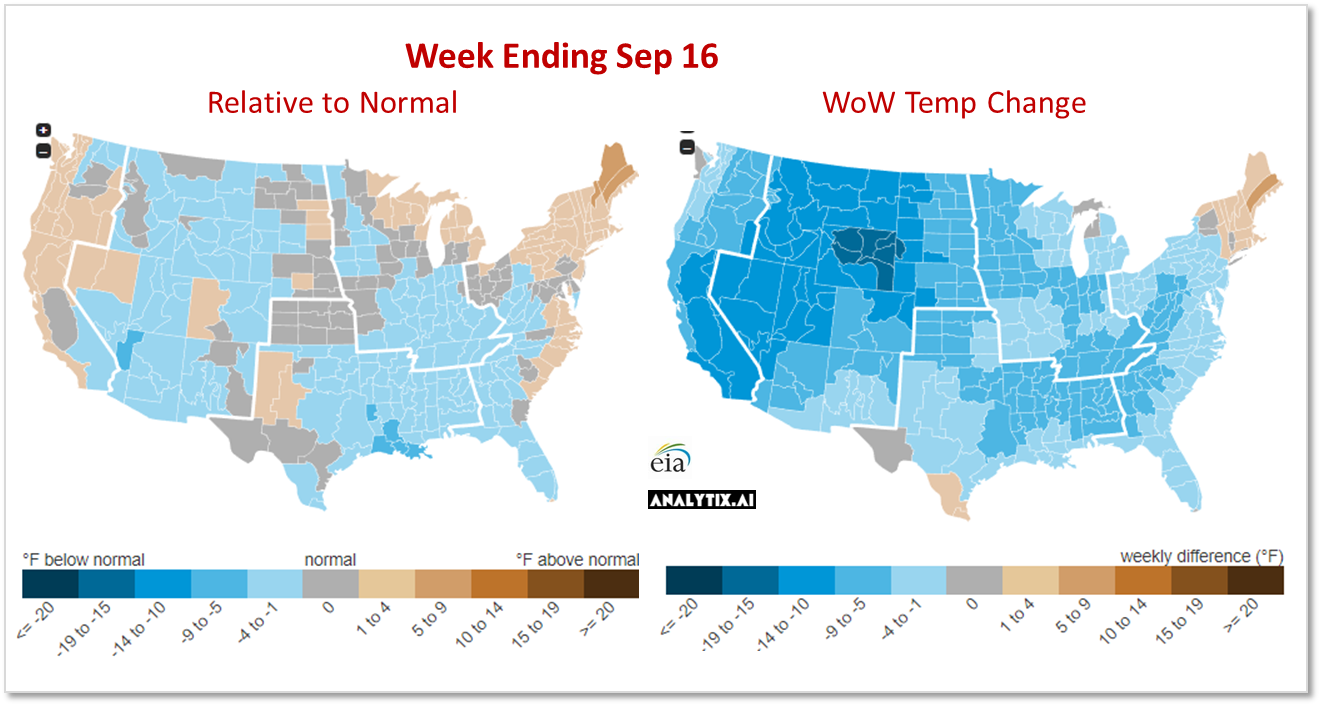
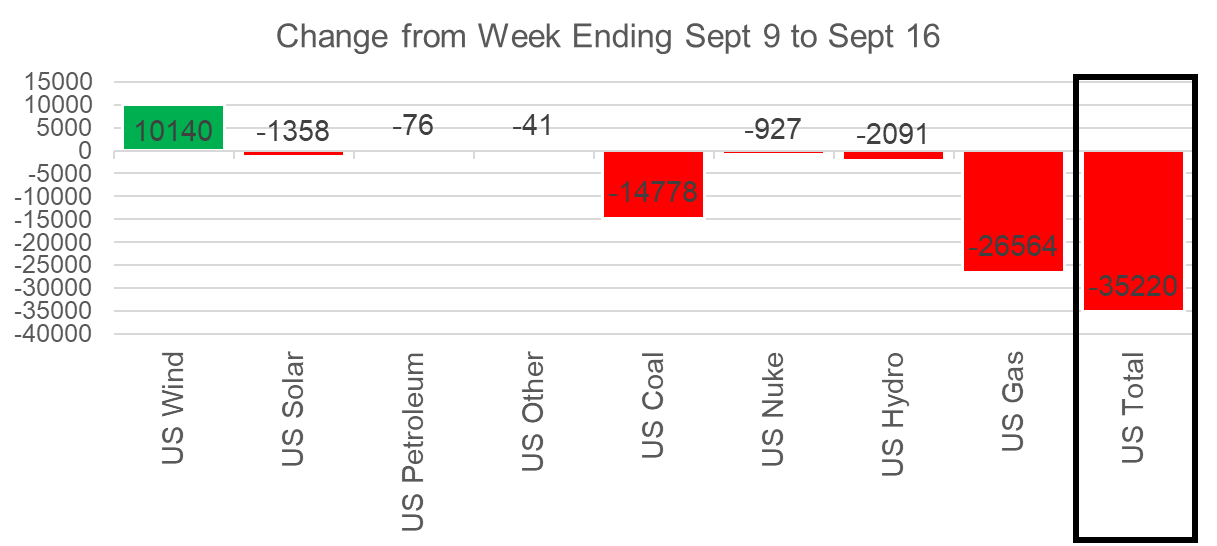
- The main factor that pushed more gas into storage was the lower consumption week-on-week with the cooler temps. The L48 population wt. CDDs dropped by 4.6 F leading to most of the country dropping to normal or below normal temps. As can be seen in the weather maps below, the shift in temps was quite drastic.
- Power burns were off significantly with wind generation mean-reverting back to normal levels. wind generation averaged 37.4 GWh which is 10.1 GWh higher than the previous week. This rising wind output lowered 1.8 Bcf/d or 12 Bcf/week of power burns.
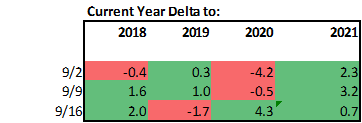
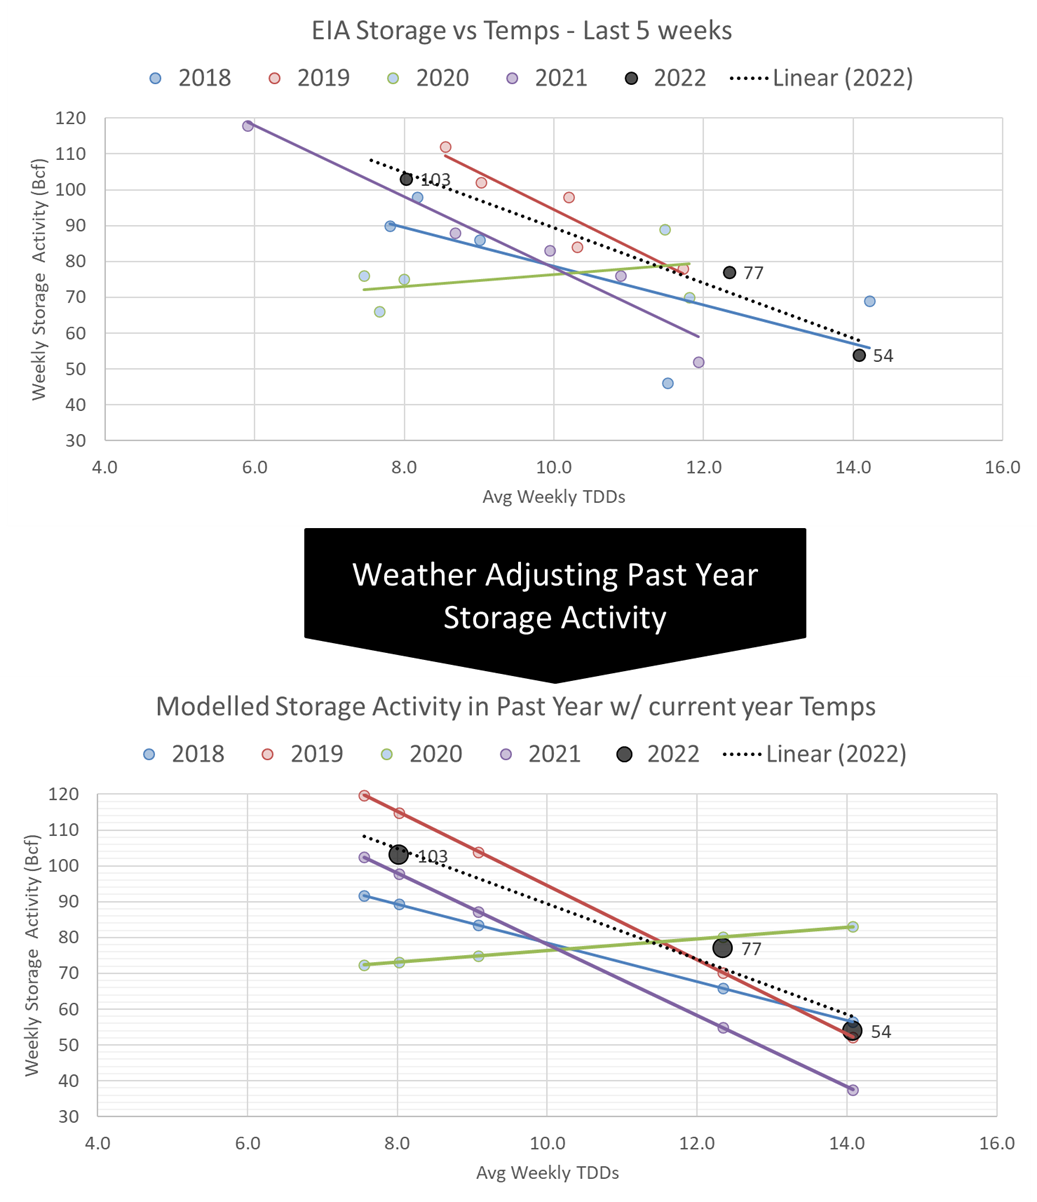
We calculate the +103 Bcf injection being +0.7 Bcf/d loose YoY – (wx adjusted). [We compare this report to LY’s rolling 5-week regression centered around week #38]
The image below shows the same data in chart format. The lines for 2018-2021 essentially show the resulting injection in those years (during week 36 through 40) if they experienced the same temps as this current summer (historical + the 15-day forecast).
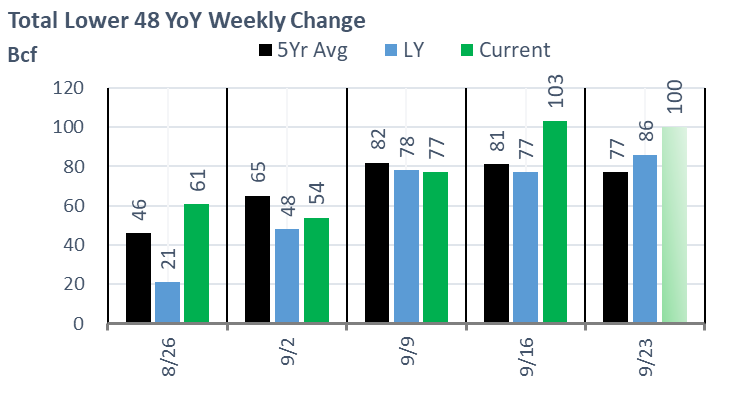
Our estimate for ending Sept 23th, our early view is +100 Bcf. This reporting period will take L48 storage level to 2,974 Bcf (-183 vs LY, -309 vs. 5Yr). This upcoming report once again dramatically decreases the YoY deficit. Last year we injected +86 Bcf during the same week.
The similar week-on-week injection looks to come from overall SnD factors looking somewhat that same week-on-week. Here is the full fundamental picture compared to last week and the same week last year.
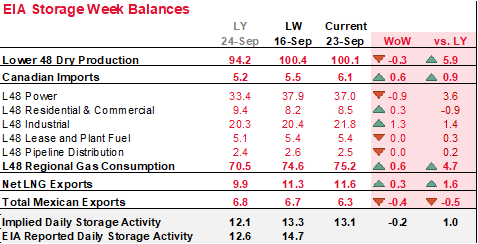
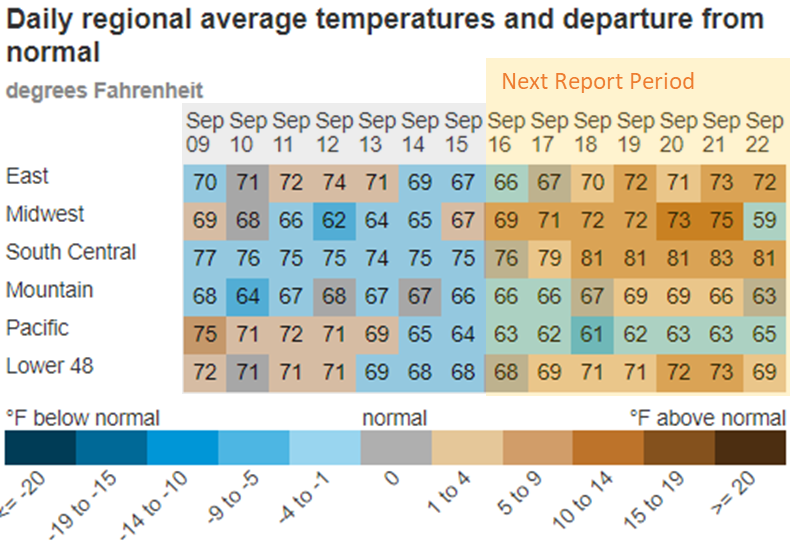
The L48 population wt. CDDs were slightly higher this past week even as we should be cooling seasonally. This past week was +0.4F warmer (led by the Midwest and SC), which only incrementally changed gas consumption. Here is a view of the temps by EIA region.
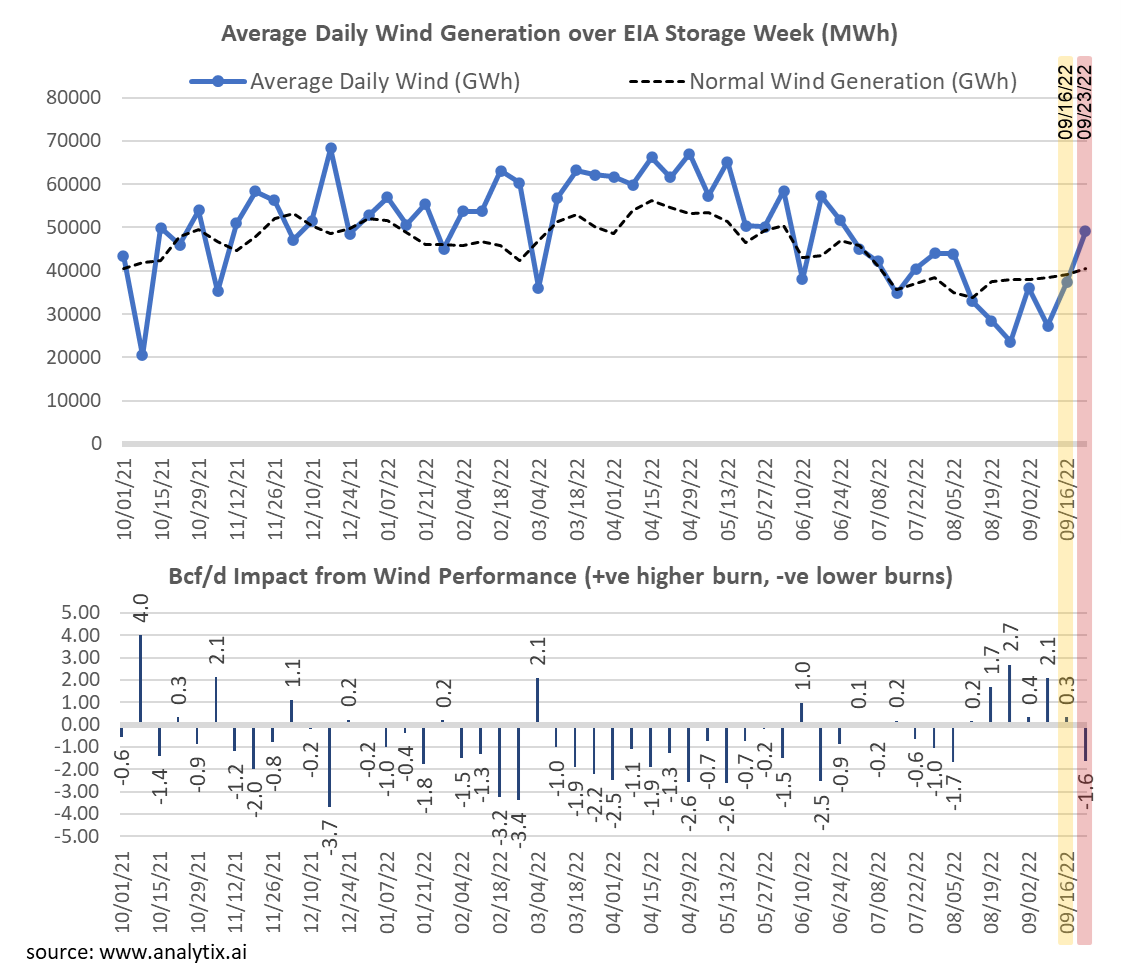
The amount of wind energy produced increased significantly week-over-week leading to lower power burns. For week ending Sept 23rd, wind generation averaged 49.1 aGWh which was 11.7 aGWh higher than the previous week. This increased wind output should have lowered power burns by 2.0 Bcf/d or 14 Bcf/week of power burns. The US has been going through a low wind period since early August, and in fact, this was the first time wind averaged above “expected levels” in the past 6 weeks. Here is our view of wind performance and its impact on power burns.
A few other things to note from this week are:
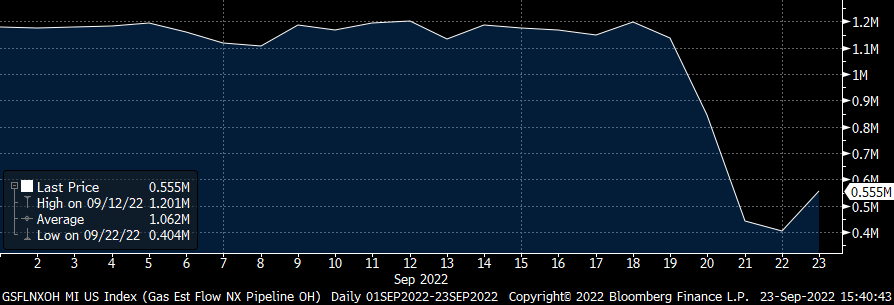
- TETCO faced another outage this past week. Line 73 between its Salineville and Colerain compressor stations has been impacted starting Sept 20th. The anticipated return is no earlier than Sept 28th based on the current pipeline notice. The outage has limited flow onto the Nexus pipeline to take NE molecules out.
The following meters will remain unavailable for flow:
74200 – MOMENTUM KENSINGTON / HIGHWAY 644, COLUMBIANA CO., OH
74201 – ACCESS MIDSTREAM CLARKS MILL ROAD-JEFFERSON CO., OH
74203 – DOMINION ENERGY TRANSMISSION, INC – CLARKS MILL ROAD, JEFFE
Additionally, receipt nominations at MR – 74202 ACCESS MIDSTREAM HIGHWAY 219 – JEFFERSON CO., OH will remain available for flow southbound on Line 73 only.
The following chart shows NEXUS flow out of the NE. It is unclear if the volumes not exiting the region are making their way into the Northeast.
- Cheniere earlier this year asked the Biden administration for an exemption from the new emissions standard. At issue is a rule under the US Clean Air Act called the National Emissions Standards for Hazardous Pollutants, which imposes curbs on emissions of carcinogens like formaldehyde and benzene, that was re-instated in February to apply to a type of gas-fired turbine. Cheniere is the only LNG company that uses these types of turbines and whose facilities are being impacted. The Environmental Protection Agency denied the request.
The latest is that some turbines at Sabine Pass can be repaired or have minimal equipment replaced to help it bring emissions down. Also, Cheniere noted that the Corpus Christi facility showed emissions from all of its 18 refrigeration turbines were well below the EPA’s threshold.
This email, any information contained herein and any files transmitted with it (collectively, the Material) are the sole property of OTC Global Holdings LP and its affiliates (OTCGH); are confidential, may be legally privileged and are intended solely for the use of the individual or entity to whom they are addressed. Unauthorized disclosure, copying or distribution of the Material, is strictly prohibited and the recipient shall not redistribute the Material in any form to a third party. Please notify the sender immediately by email if you have received this email by mistake, delete this email from your system and destroy any hard copies. OTCGH waives no privilege or confidentiality due to any mistaken transmission of this email.