This past week the natgas market observed some wild price swings, but this time it had nothing to do with Freeport LNG. The main trigger was the potential rail strike that would have halted rail service nationwide which would have wreaked havoc and caused supply chain issues for multiple industries, including coal, chemicals, and oil and gas material/equipment.
The front month experienced a $1.42 drop from Wednesday’s peak to the week close.
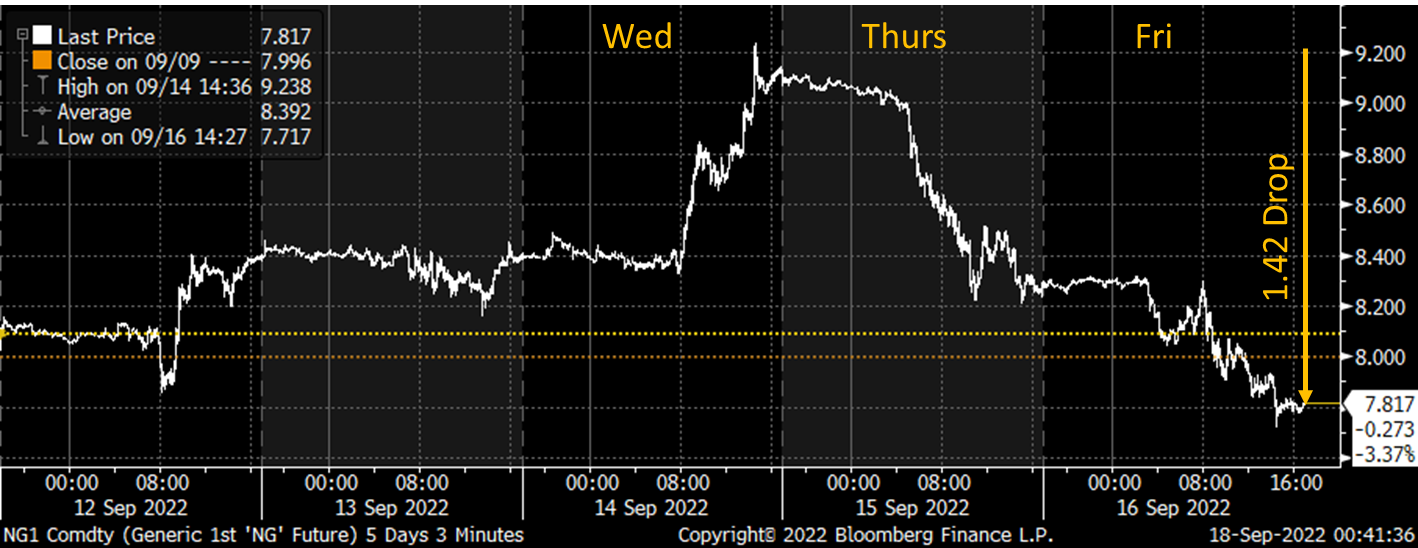
Contract negotiations have been taking place for three years between railroad management and all the associated unions. Up until Wednesday all but two unions had agreed to the most recent contract offer. With no consensus amongst the 12 associated unions, the fear of no deal sent natural gas markets running to over $9 on Wednesday as the pause of coal deliveries would put excess pressure on natural gas-fired generators. The tide turned quickly on Thursday with the rumors of a tentative agreement reached early Thursday morning.
The market move we saw on Wednesday was fully justified in our opinion, as the duration of the strike could have been days to months. To fully understand the rail strike impacts to gas markets, let’s take a look at how fragile the coal generation industry has become.
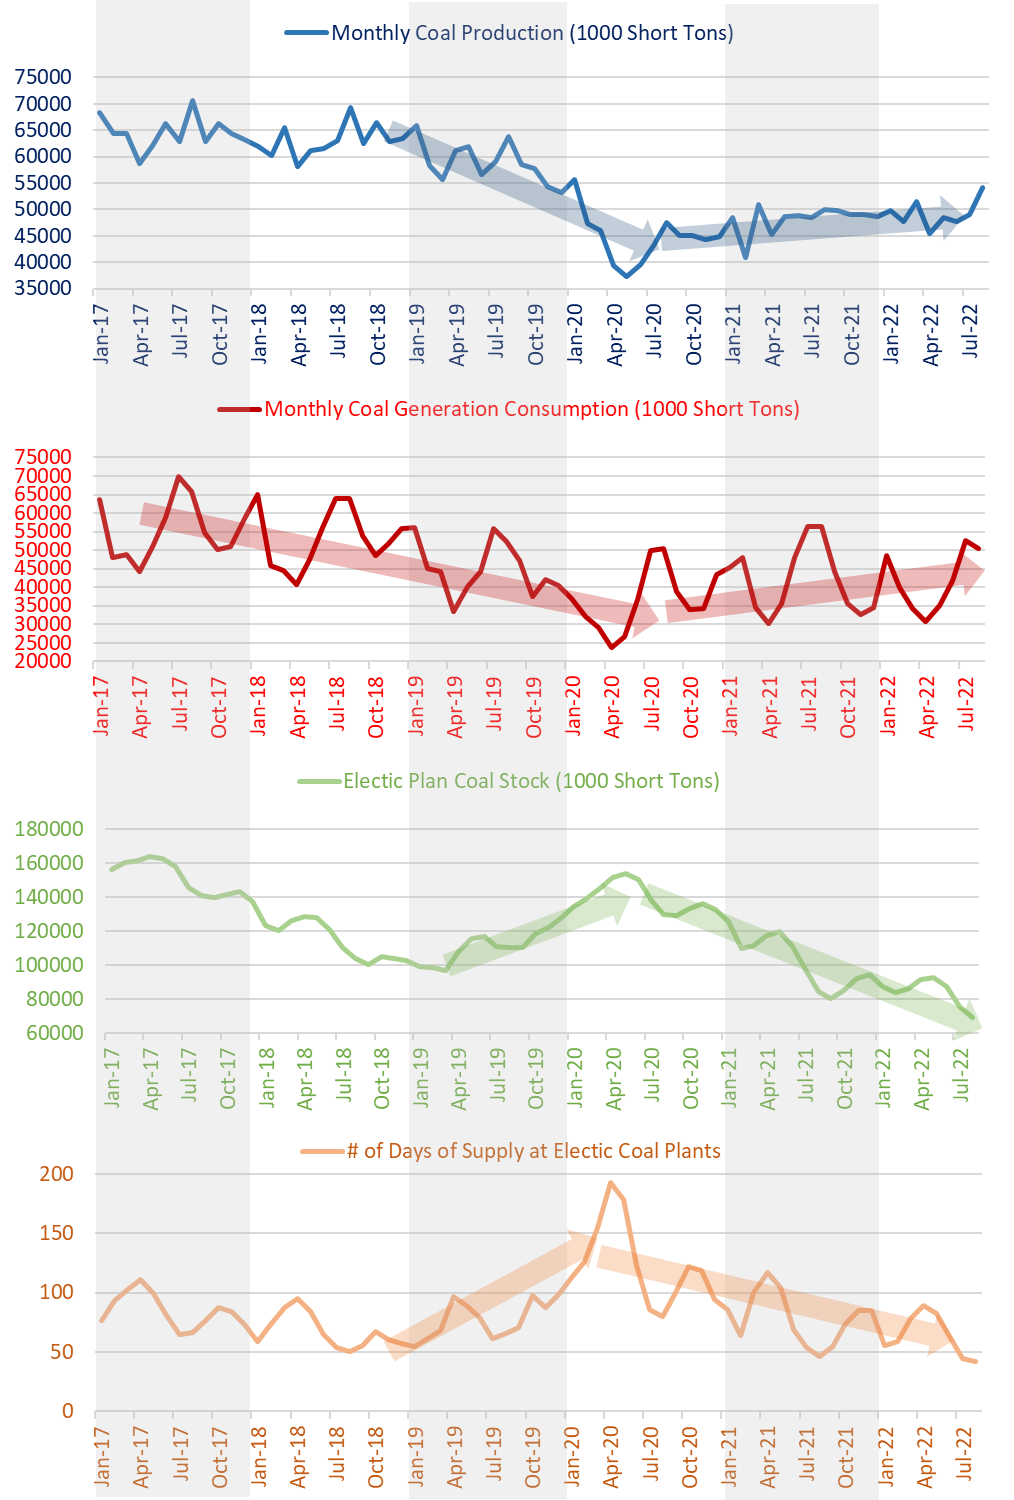
To start we must understand that coal generation still makes up roughly 20% of the needed daily generation to fulfill power demand. The post-COVID era and continuing conflict between Ukraine/Russia have left coal stockpiles extremely low in the US. The charts below show a complete story of how coal supply, consumption, and stockpiles have trended in the past 5 years, but the final chart brings the entire story together.
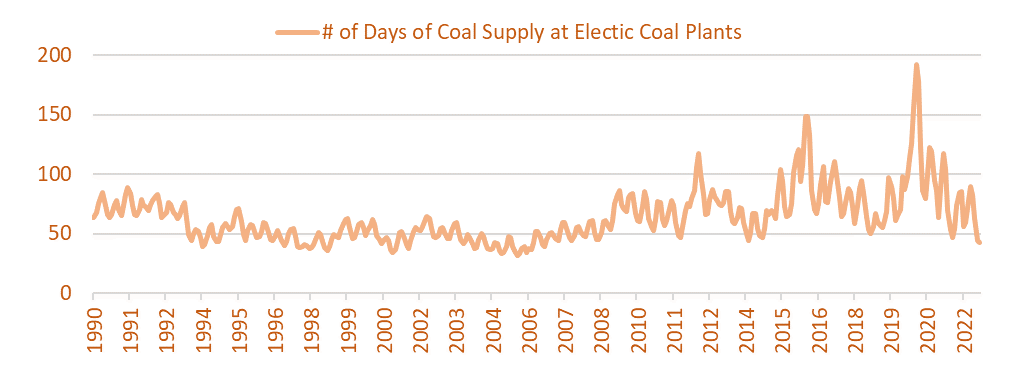
The final chart estimates the number of days of coal supply that are currently sitting at US coal plants (currently stockpiles at electric plants / current monthly electric consumption). With the latest EIA coal data for August, we estimate there are only 42 days of coal burn available; hence any stoppage in rail would cripple coal generation availability adding immense pressure to the already high power burn level. As can be seen in the same chart extending back to 1990, the coal supply level was last this low before the shale era.
Luckily, it appears we have avoided this threat and with it, we have seen prices retreat to below $8.
NatGas Storage Fundamentals:
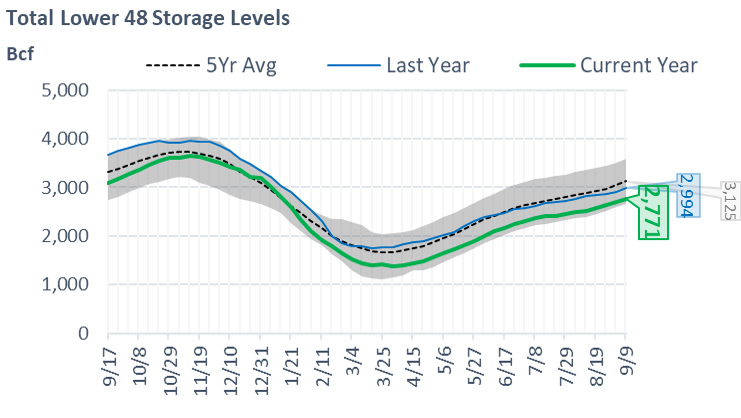
The EIA reported a +77 Bcf injection for the week ending Sept 9th, which came in slightly above our estimate of +74. This storage report takes the total level to 2771 Bcf, which is 223 Bcf less than last year at this time and 354 Bcf below the five-year average of 3,125 Bcf.
Here are the few factors that changed WoW that led to the slightly higher storage injection relative to the previous week:
- Total supply was higher by +0.8 Bcf/d (Northeast production finally jumped, while net imports from Canada were relatively flat)
- The storage week covered the labor day long weekend; hence we estimate 6 Bcf of less demand for the holiday Monday relative to a typical Monday.
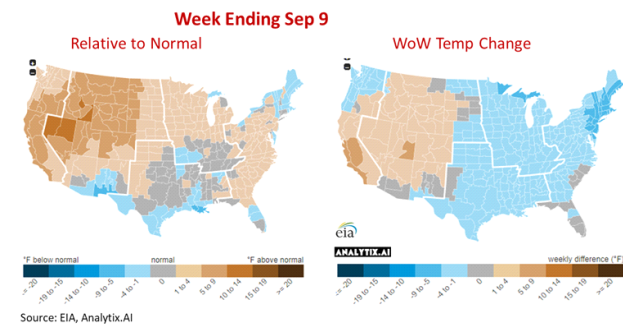
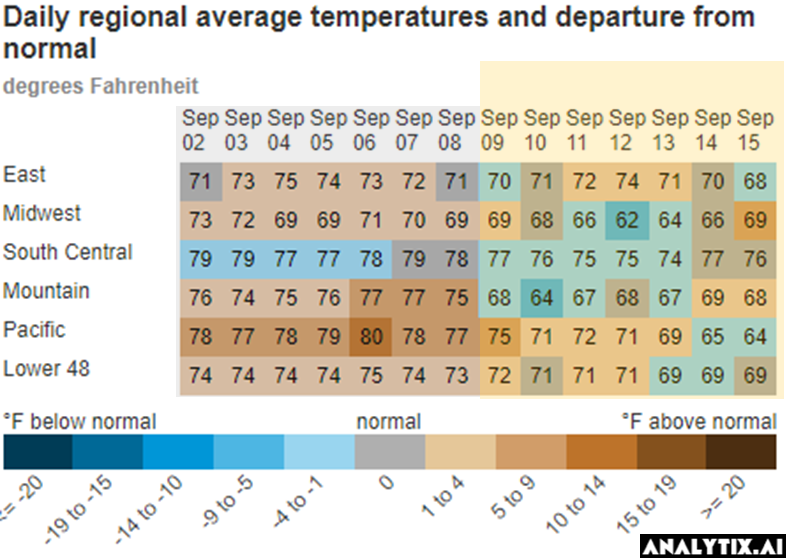
- Power burns were off significantly even with wind generation not showing up for much of the reporting week (-8.9 aGWh WoW). The main driver was the dropping temps (see image below) which reduced overall power demand by 4.8% week-on-week. The cooling across much of the Central-East led to much lower power usage.
Here is a look at how the weather looked last week relative normal and the previous week:
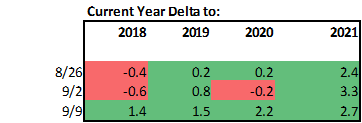
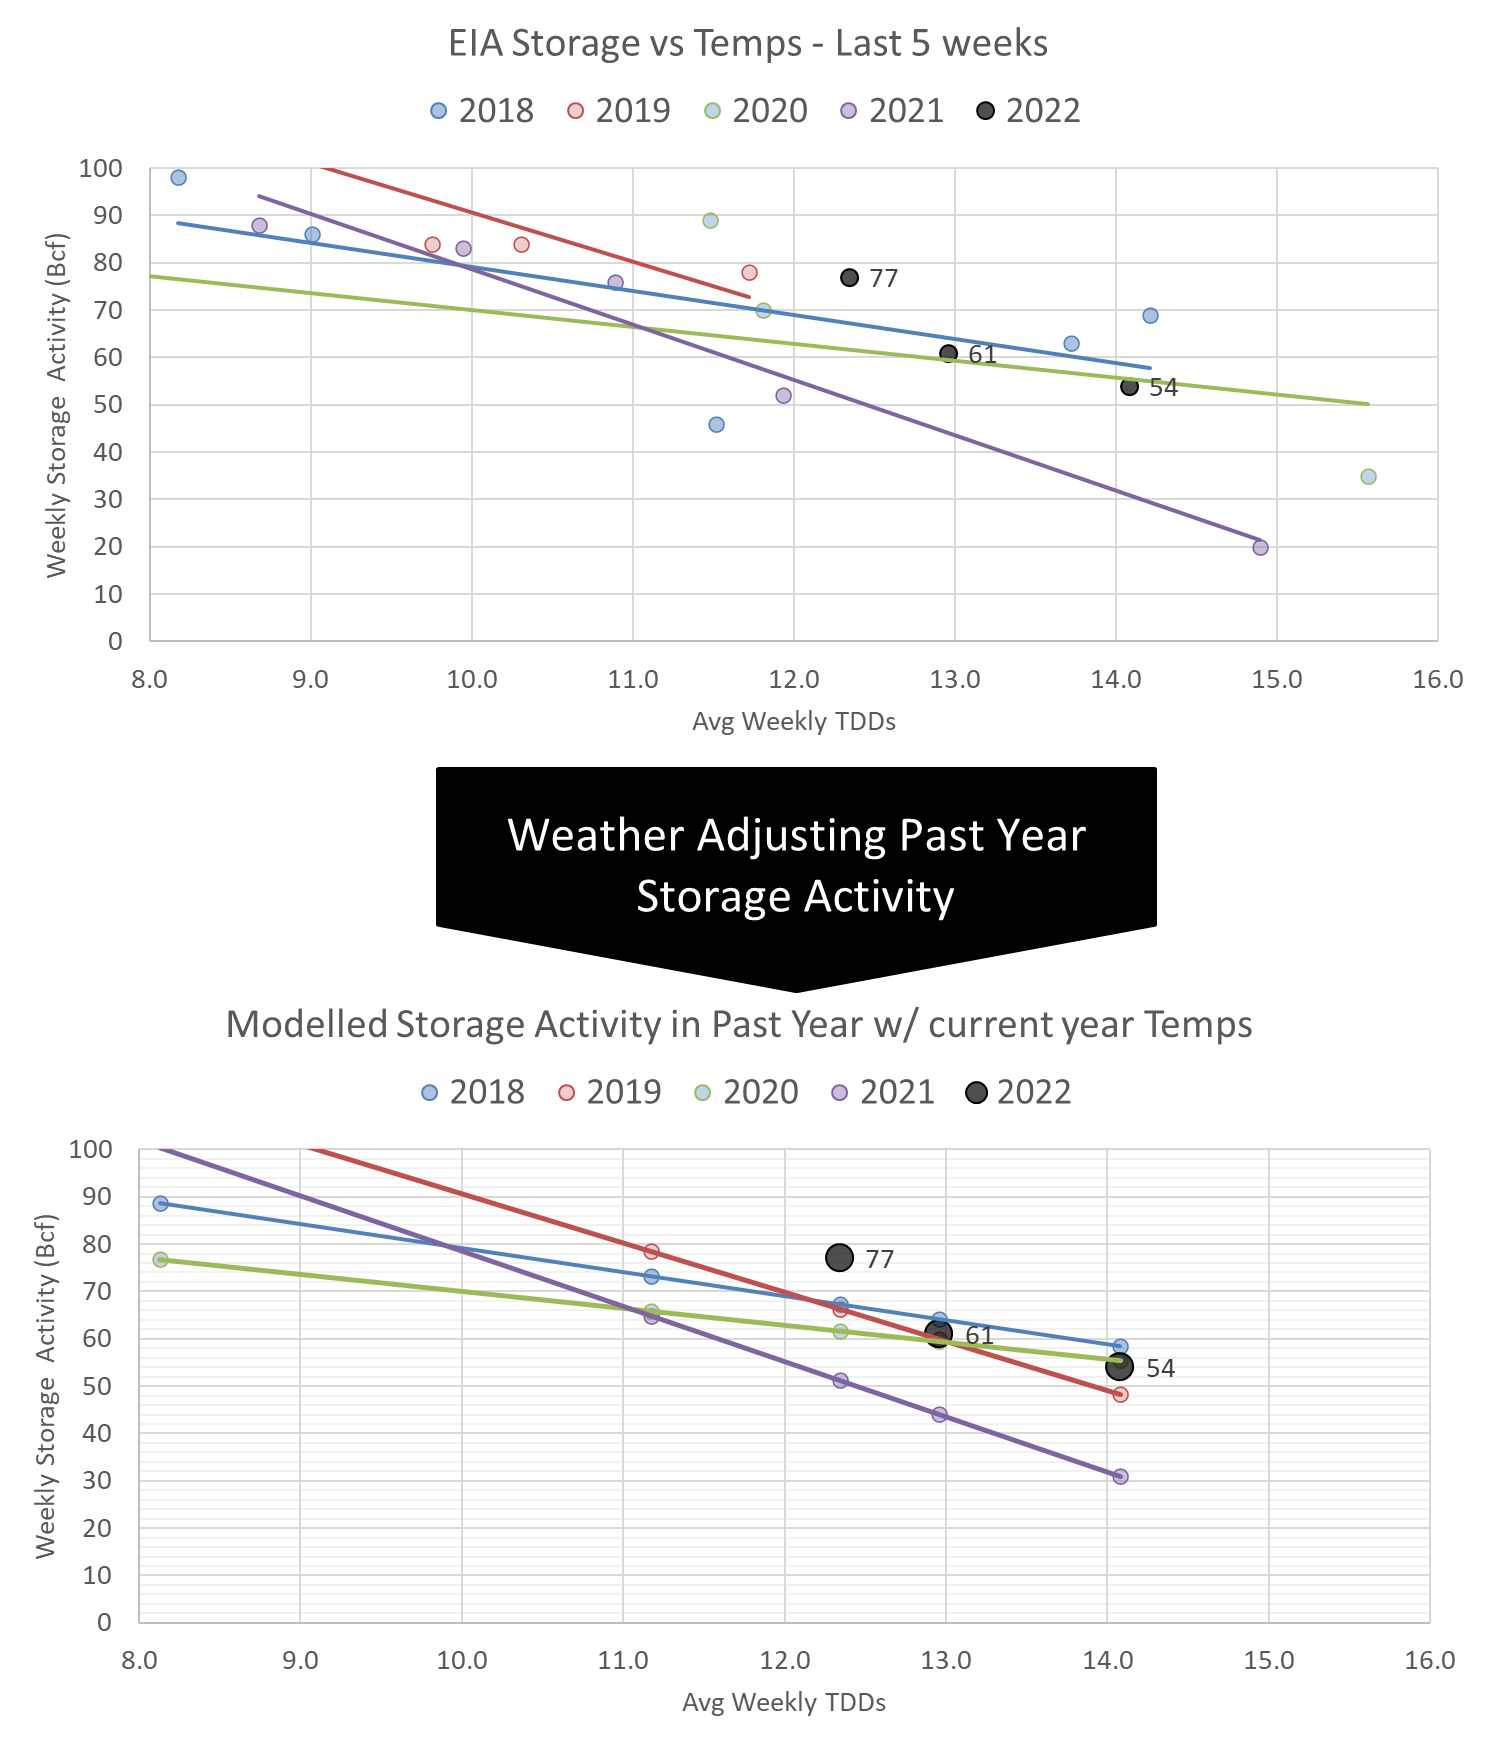
We calculate the +77 Bcf injection being +2.7 Bcf/d loose YoY – wx & holiday adjusted. [We compare this report to LY’s rolling 5-week regression centered around week #37]
The image below shows the same data in chart format. The lines for 2018-2021 essentially show the resulting injection in those years (during week 35 through 39) if they experienced the same temps as this current summer (historicals + the 15-day forecast).
Our estimate for ending Sept 16th, our early view is +100 Bcf. This reporting period will take L48 storage level to 2,871 Bcf (-200 vs LY, -335 vs. 5Yr). This upcoming report dramatically decreases the YoY deficit. Last year we injected +77 Bcf during the same week.
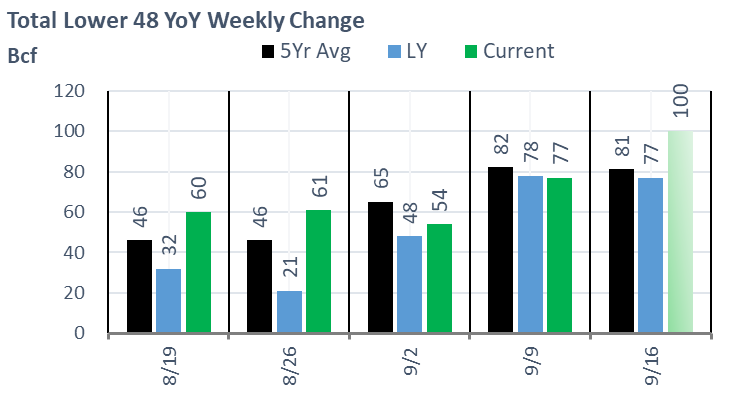
The higher injection week-on-week is quite justifiable by strictly looking at the change in demand alone. Here is the full fundamental picture compared to last week and the same week last year.
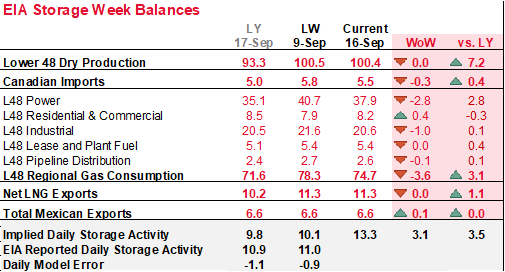
The main factors that have led to the lower consumption week-on-week are the changing temps and wind impact. The L48 population wt. CDDs dropped by 4.6 F leading to most of the country dropping to normal or below normal temps.
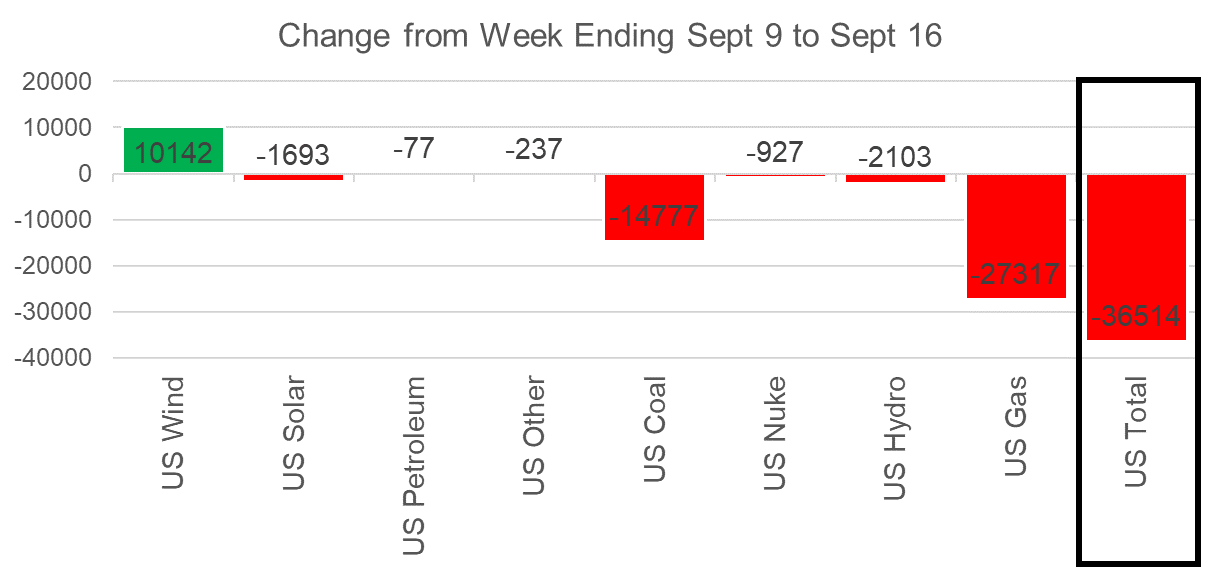
The amount of wind energy produced increased significantly week-over-week. For this upcoming storage report, wind generation averaged 37.4 GWh which is 10.1 GWh higher than the previous week. We estimate the rising wind output lowered 1.8 Bcf/d or 12 Bcf/week of power burns.
This email, any information contained herein and any files transmitted with it (collectively, the Material) are the sole property of OTC Global Holdings LP and its affiliates (OTCGH); are confidential, may be legally privileged and are intended solely for the use of the individual or entity to whom they are addressed. Unauthorized disclosure, copying or distribution of the Material, is strictly prohibited and the recipient shall not redistribute the Material in any form to a third party. Please notify the sender immediately by email if you have received this email by mistake, delete this email from your system and destroy any hard copies. OTCGH waives no privilege or confidentiality due to any mistaken transmission of this email.
