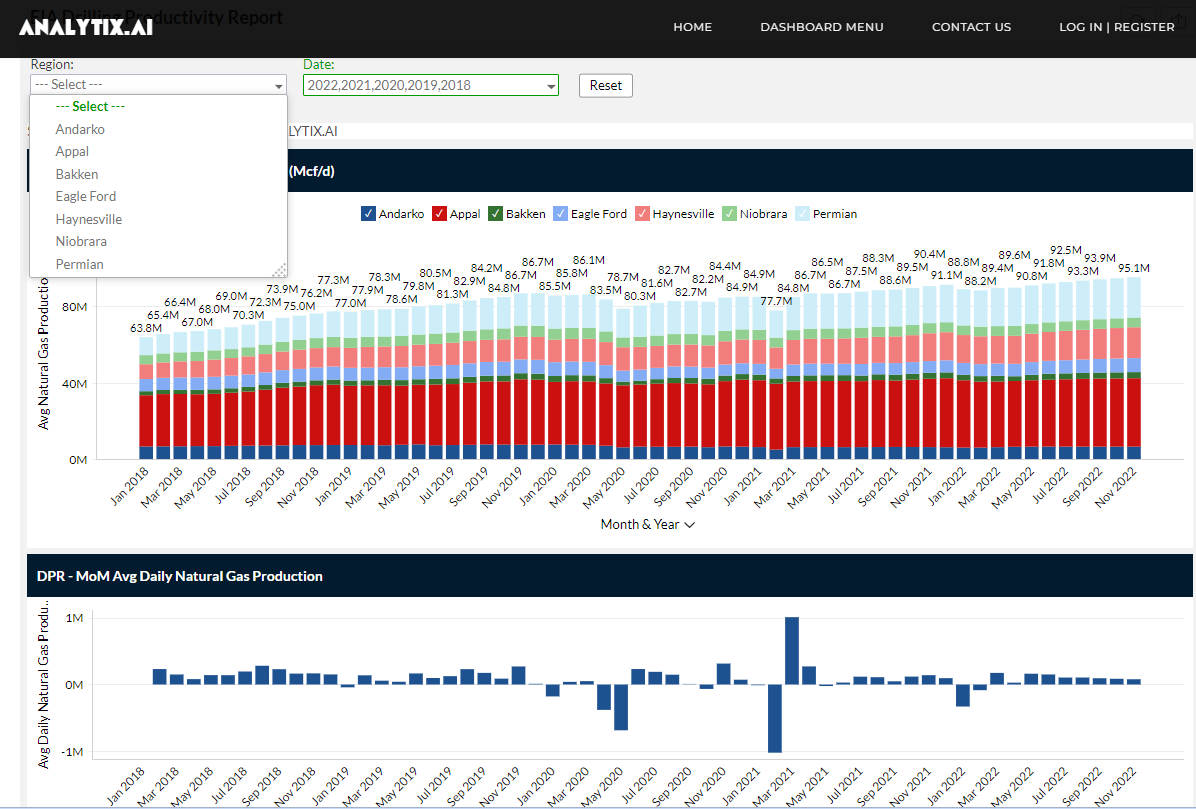
This week we start with a look at data from the latest EIA Drilling Productivity Report.
The charts below are from our data dashboard. If you want to see the DPR data by basin and for a different timeframe, then hit this link to play around.
http://www.analytix.ai/drilling-productivity-report.html
Total shale production (wellhead) is expected to reach 95.1 Bcf/d from the 7 major shale basins.
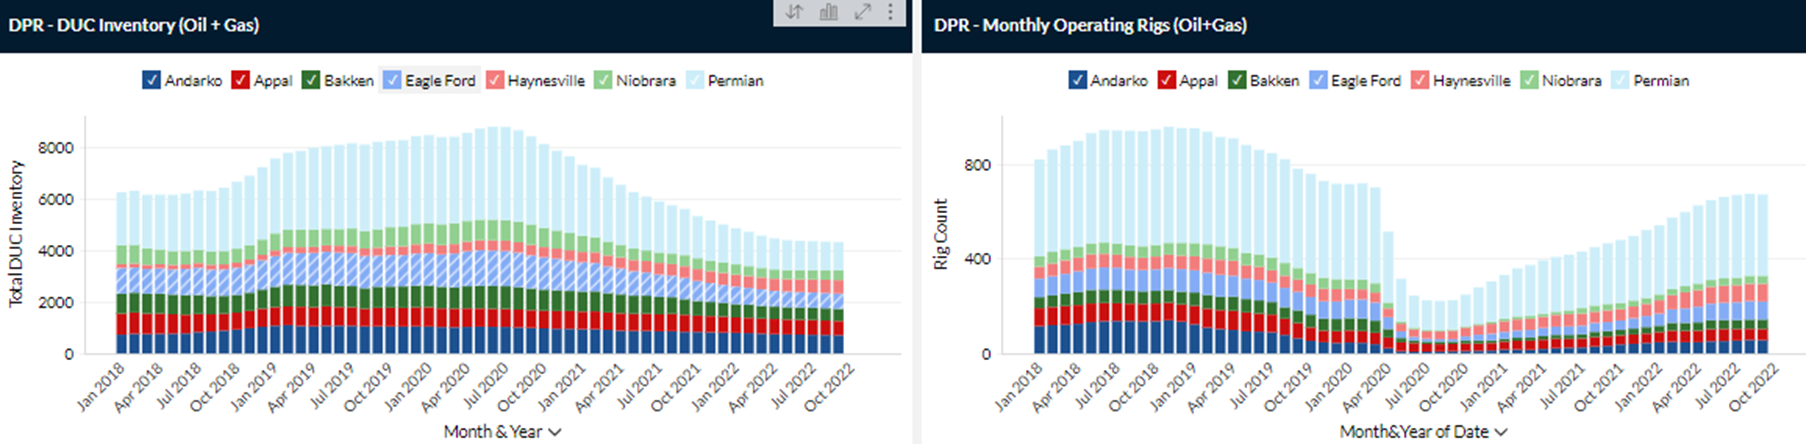
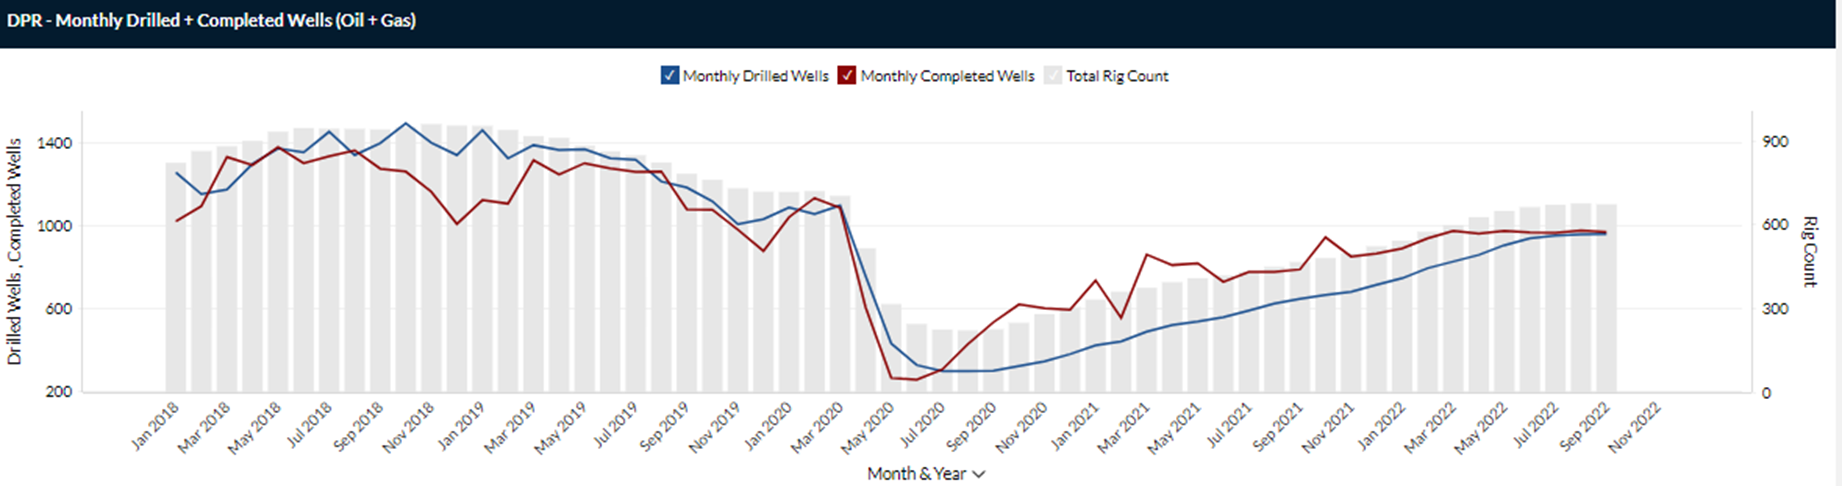
DUCs continue to fall. But the real story looks to be a result of a pickup in rigs. The newly drilled well pool looks to be servicing the growth in production rather than DUCs being drawdown. In some regions, DUCs are being added back to inventory, i.e. Haynesville.
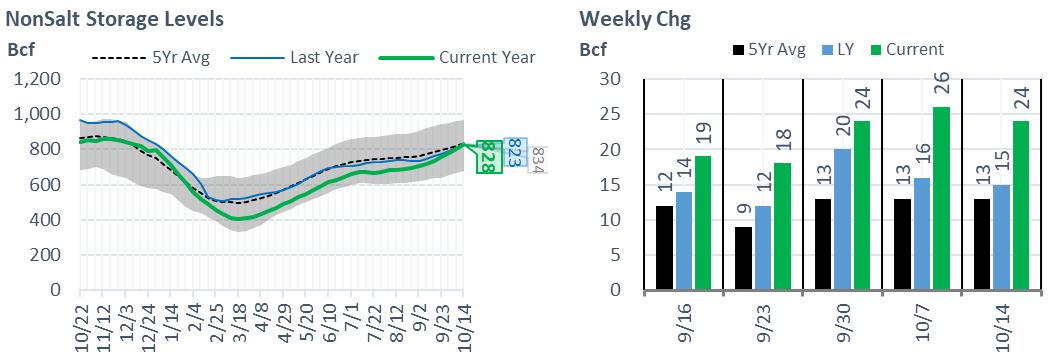
NatGas Storage Fundamentals:
The EIA reported a +111 Bcf injection for the week ending Oct 14th, which came in right at our estimate of +109. This storage report takes the total level to 3342 Bcf, which is 106 Bcf less than last year at this time and 183 Bcf below the five-year average of 3,525 Bcf. This is the 5th consecutive triple-digit build.
Noteworthy has been consistently stronger than expected SC Non-Salt builds that now take levels above last year. This is the only region that is currently sitting at a surplus to last year.
Our fundamental storage model once again is short by 1.0-1.3 Bcf/d. When the error is so consistent, we hate that we cannot explain whether we are missing it on the production side or the demand side. At this point, I’d say we are undershooting demand just because our production numbers are much higher than the rest of the industry estimates. For this report, below are some good details to explain the +111 Bcf build: adhere
- Total domestic production fell off the record high set in the previous week. Total lower 48 production dropped by -0.3 Bcf/d.
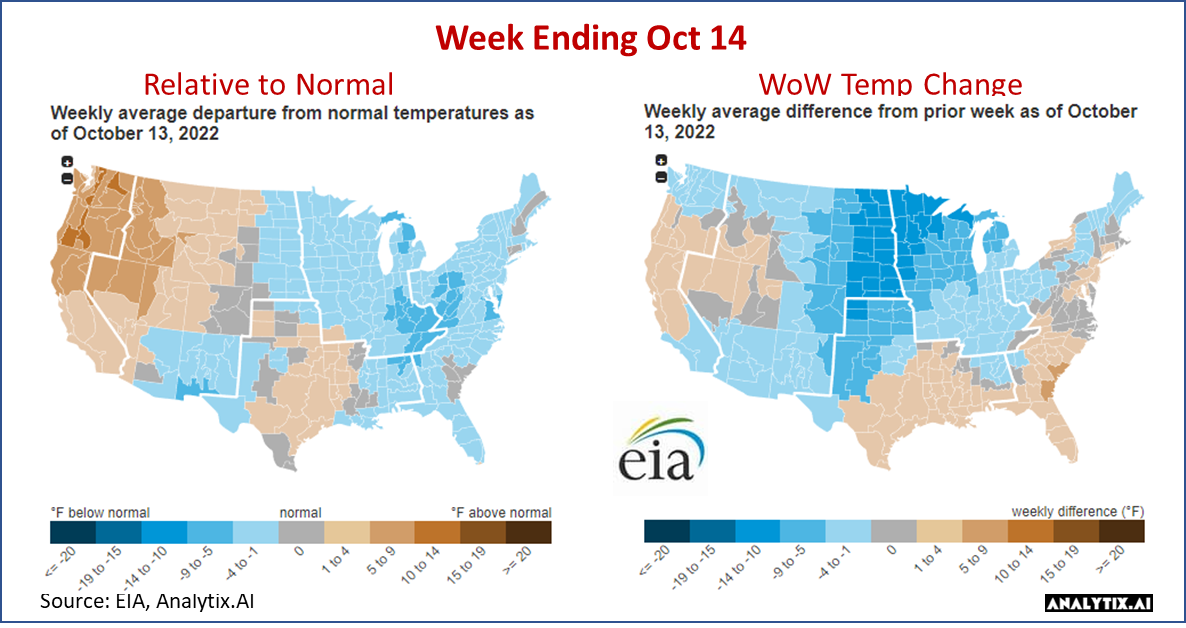
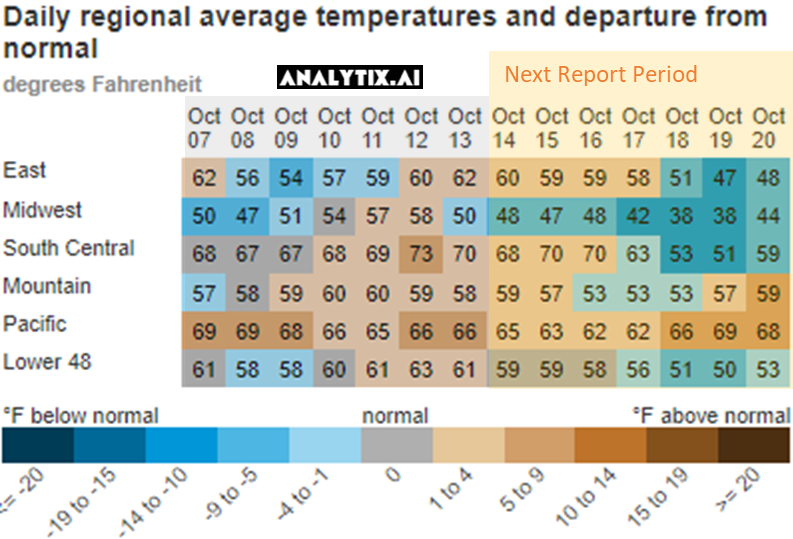
- Gas consumption rose once again with the cooler temps starting to set in across much of the country. The Midwest and the entire East coast pushed below normal leading to a pick up in RC gas consumption rise. During the reporting week, CDDs were relatively flat while HDDs rose by 0.6F. Here is a view of the temps by EIA region.
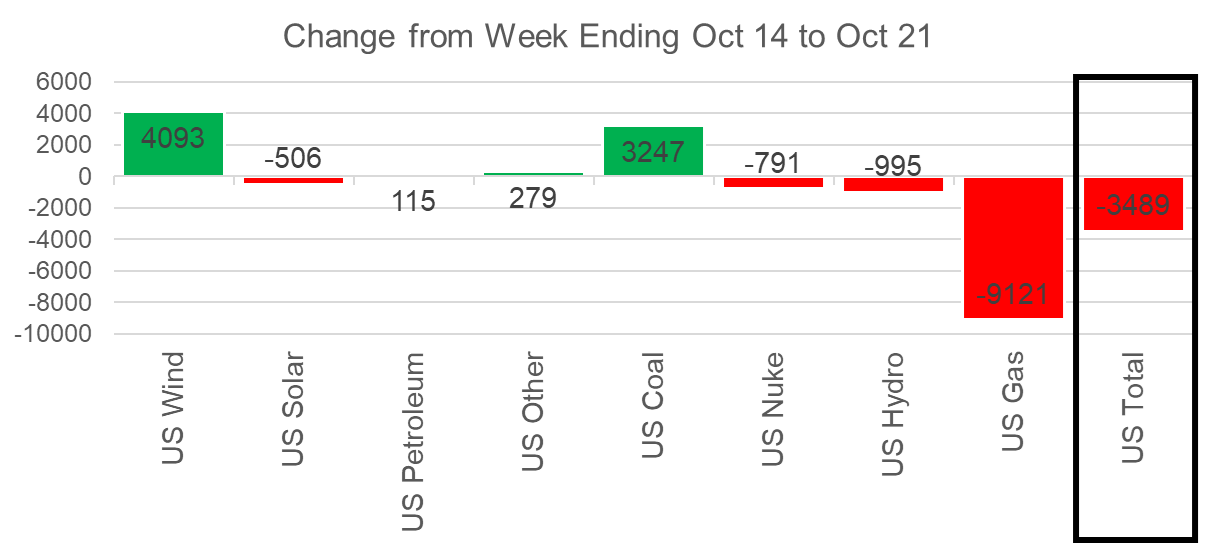
- With CDDs relatively, power loads also remained flat. As usual, the power mix did change. The big movers this week did not include natural gas. Wind rose by 8.3 aGWh, which was entirely offset by Nuke generation dropping by 7.3 aGWH. Despite the jump in wind, we should have expected at least 45 aGWh for this time of the year.
- LNG feedgas levels remained unchanged.
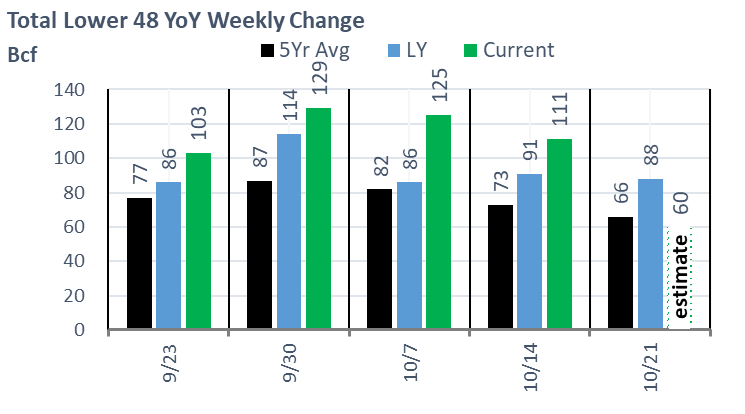
We calculate this reported injection to 6.1 Bcf/d loose YoY – (wx adjusted), which has been instrumental in reducing the YoY storage deficit. [We compare this report to LY’s rolling 5-week regression centered around week #42]
Our estimate for week ending Oct 14th is +60 Bcf. This reporting period will take L48 storage level to 3,342 Bcf (-134 vs LY, -189 vs. 5Yr). Last year we injected only +88 Bcf during the same week. This will be the 2nd weekly injection in 10 weeks that will fall short of last year.
Here is the full fundamental picture compared to last week and the same week last year. As can be seen, the storage injection was considerably lower with a contraction in production, and a surge in RC led demand and LNG.
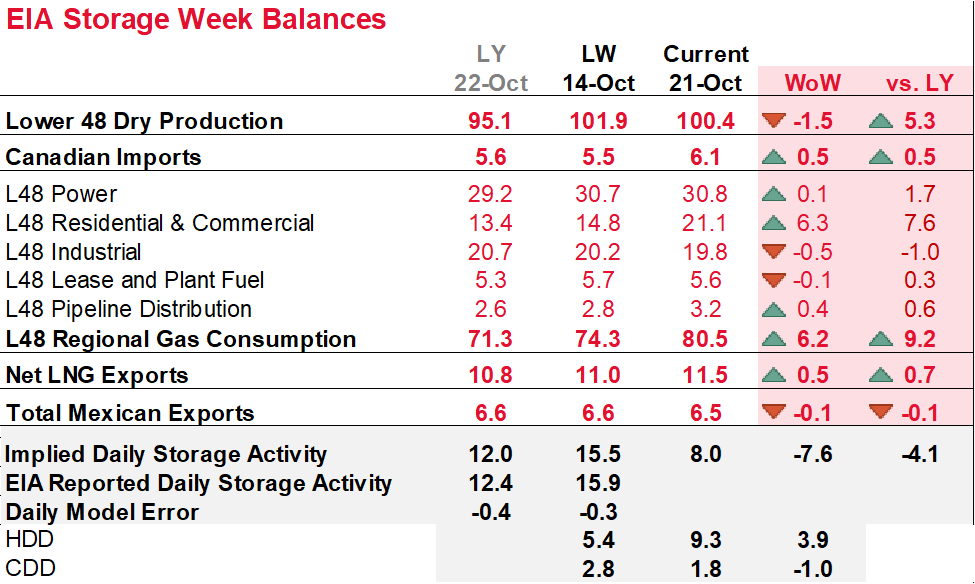
Production: Domestic production dropped across multiple regions this past week. The most notable losses were in the Permian which saw production drop by as much at 1 Bcf/d. The drop in production in the region led to Waha cash strength. The Appalachian basin also continues to lag the peak levels seen last year. We are hoping to see levels pick up there as regional demand picks up and shale producers ramp up their production levels going into the end of the year to beef up their financials.
RC Consumption: Temps at the national level cooled across much of the Central-East of the country leading to stronger natural gas demand. At the national level, we saw HDDs pick up by 3.9F which translated into +6.3 Bcf/d of RC demand. As we noted last week, the change to cooler temps has a quick impact on RC consumption, as the spread between daytime highs and nighttime lows widens.
Power Burns: Power burns head to their seasonal lows with CDDs rapidly falling off. The overall reduction in power load was off by 3.5 aGWH or 0.8%. Natural gas was pushed out with an increase in Wind and Coal generation this past week.
LNG: This past week, LNG feedgas levels strengthened with cooler temps hitting the Gulf Coast. Total feedgas levels jumped by 0.5 Bcf/d, with Sabine making up most of the weekly change.
Other things to note on LNG:
- Cove Point should complete its annual maintenance sometime this week.
- Freeport has one LNG tanker that’s been waiting near the facility offshore since Oct 17th, while another one continues its journey to the facility. The Prism Brilliance is waiting and Prism Diversity is set to arrive on Oct 28th. Click these links to track them: PRISM BRILLIANCE PRISM DIVERSITY
This email, any information contained herein and any files transmitted with it (collectively, the Material) are the sole property of OTC Global Holdings LP and its affiliates (OTCGH); are confidential, may be legally privileged and are intended solely for the use of the individual or entity to whom they are addressed. Unauthorized disclosure, copying or distribution of the Material, is strictly prohibited and the recipient shall not redistribute the Material in any form to a third party. Please notify the sender immediately by email if you have received this email by mistake, delete this email from your system and destroy any hard copies. OTCGH waives no privilege or confidentiality due to any mistaken transmission of this email.