This week we start with a few charts on wind performance. Wind generation is becoming more important to gas burn levels each month as more wind generation comes online. 2020 and 2021 saw large with large federal subsidies offered to developers. These subsidies include, among other things, a production tax credit (PTC) and an investment tax credit (ITC). Wind power is the main beneficiary of the PTC, and solar is the primary beneficiary of the ITC. The ITC and PTC were established in 1978 and 1992, respectively, with expiration deadlines. However, these expiration dates have been extended 24 times by Congress.
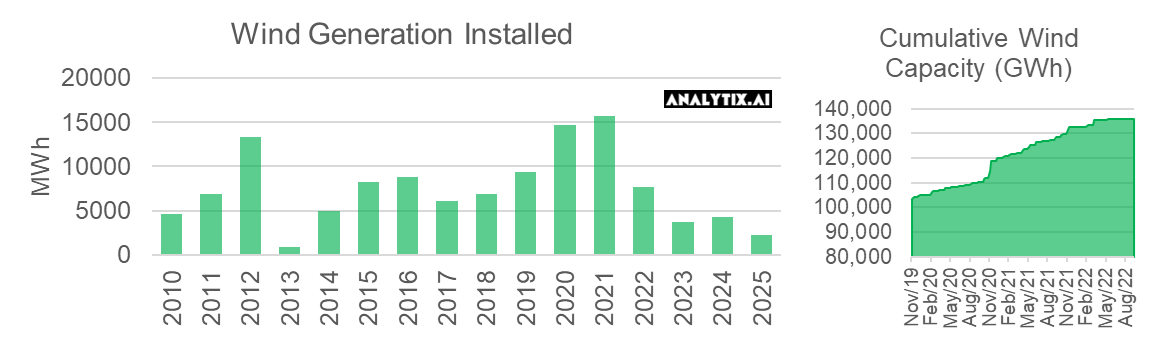
With all the wind, the stable operation of the power grid comes into question. Unlike natural gas, coal, and nuke generation – wind can be unreliable. The variability of wind through the day and seasonality of wind throughout the year has a very direct impact on natural gas generation. Here is some info on past wind stats and seasonality. I compiled the expected wind gen capacity factor by analyzing the last 4 years of wind gen and adjusting it for more installed wind capacity.
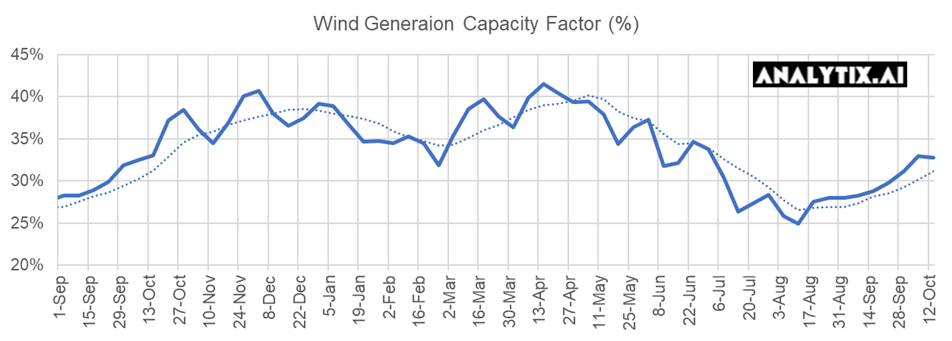
Note: This is the average for the US, but we have done the same analysis at the regional ISO level
As seen, wind patterns have a very distinct rhythm. In the most general view, wind peaks in the winter and drops off significantly during the peak summer months. So at its best, we can expect a 40% wind factor, and at its lowest (during the peak of summer) we can expect 25%. [Note: we see this dip in Jan/Feb, and we believe this could be due to ice buildup around gears and on wind turbines that increase friction]
We’ve shown this picture in the past. Using our understanding of seasonality and total installed generation, we can calculate an average expected wind generation level for each storage week. E then use that data, to calculate the over/under performance each week and how that translated into over/under power burns. The chart below gives all the details on a week-by-week basis.
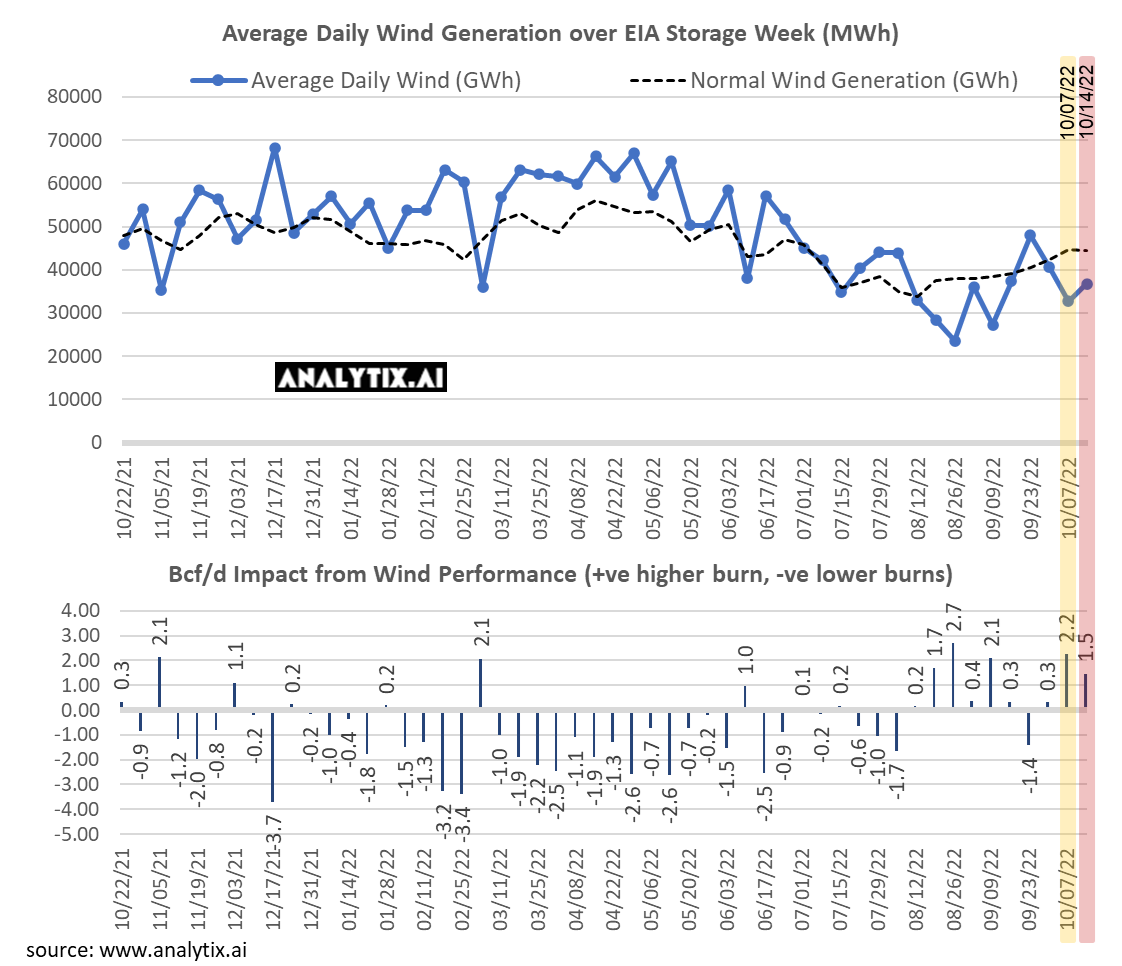
As seen, most of the summer we saw wind generation exceed expected levels. The last two months have been quite different though. For this past week, the lower wind generation added 1.5 Bcf/d or 10.5 Bcf of additional burns. Have a look at the chart and see how the strong burns from March to July helped us keep burns low and help us achieve a decent end-of-season storage level.
NatGas Storage Fundamentals:
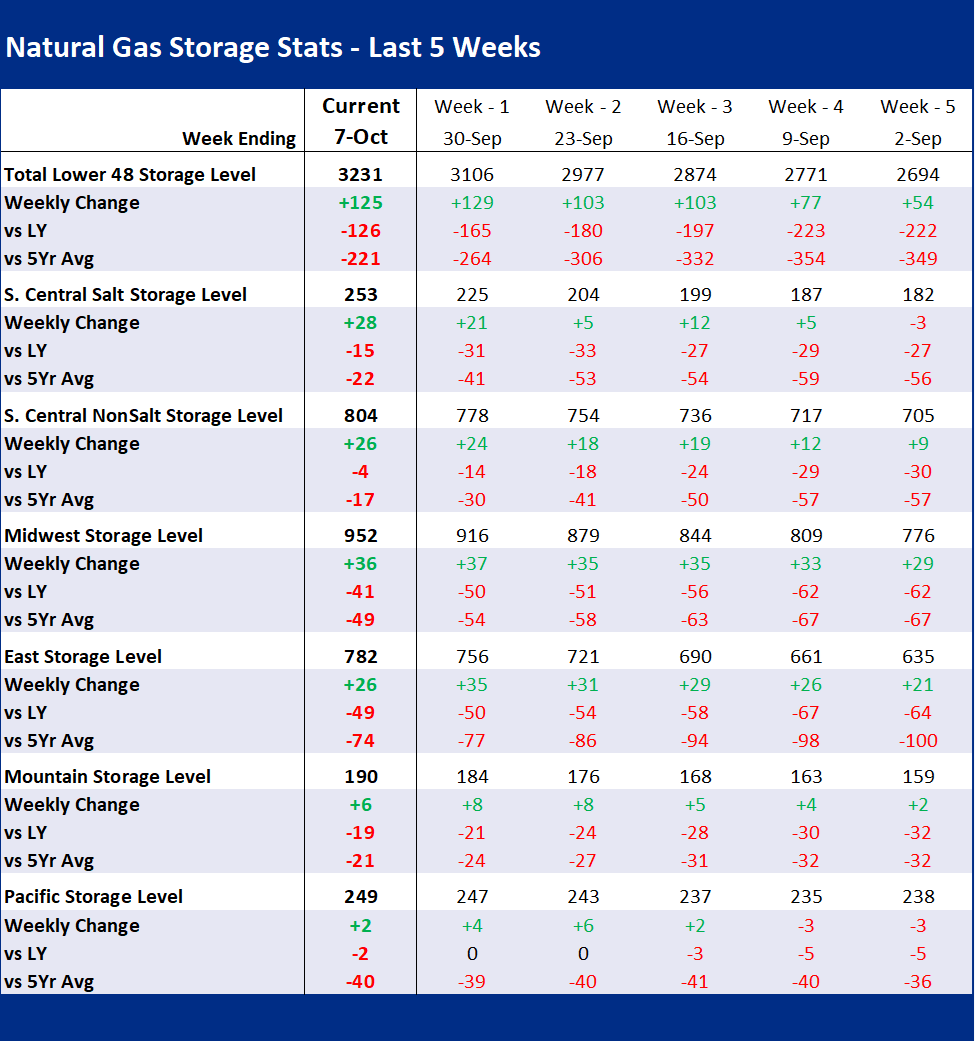
The EIA reported a +125 Bcf injection for the week ending Oct 7th, which came in slightly lower than our estimate of +130. This storage report takes the total level to 3231 Bcf, which is 126 Bcf less than last year at this time and 221 Bcf below the five-year average of 3,452 Bcf. This is the 4th consecutive triple-digit build. Noteworthy in this report was the exceptional build in both Salt and Non-Salt storage. Both storage categories are now very close to historic norms.
The massive injection once again is puzzling as our fundamental storage model has been missing by 0.8-1.3 Bcf/d for the past 4 weeks. With that, we did expect a loose number in the same ballpark as last week, but with a slightly different fundamental make up. Below are some details that somewhat tell the story:
- Total domestic production jumped once again by +0.7 Bcf/d. This is the highest weekly average recorded, and we figure there is more room for upside with the Northeast potentially ramping up as we go into the winter months. The increase in production came particularly from the Texas area this week. Canadian imports did start to weaken this week as well with small drops in volumes across multiple entry points.
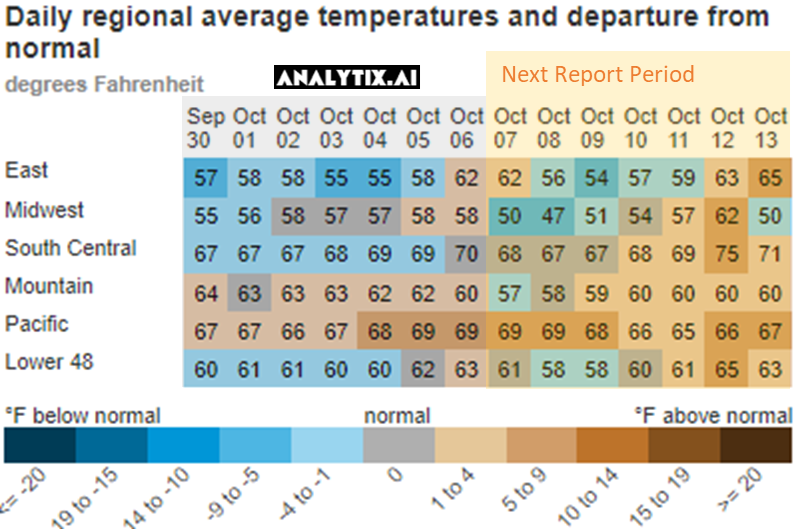
- Gas consumption looks to have hit a seasonal low last week. This week with the cooler temps across much of the country, we see RC gas consumption rise. During the reporting week, CDDs decreased by 1.6F week-on-week while HDD start to slowly march higher by 1.6F. Here is a view of the temps by EIA region.

- As a result of the decline in CDDs, power loads decreased by 21 aGWH or 4.9% from the prior week. Despite power loads dropping, natural gas generation stayed relatively flat as wind, solar, coal, and nukes all dropped. Wind was particularly much lower than we would expect for this time of the year. According to our wind index, we would have expected wind output to be near 45 aGWh for this time of the year but our wind generation only averaged 32.7 aGWh. This misfire of wind added approximately 2.2 Bcf/d of gas burns. If wind did perform as expected then this storage number could have been even looser.
- LNG was another loosening factor with Cove Point starting its annual maintenance last week. The facility typically takes 0.77 Bcf/d, which was redirected into local markets.
We calculate this reported injection to +5.2 Bcf/d loose YoY – (wx adjusted), which is significantly out of range. [We compare this report to LY’s rolling 5-week regression centered around week #39]
As we noted above, wind and solar both underperformed during week ending Oct 7. If those two generation types had operated at expected levels then this storage report would have been even looser. It could have added up to 1.8 Bcf/d of additional looseness, or an extra 12-13 Bcf in storage injections. This would have taken last week’s storage injection to a new one-week record.
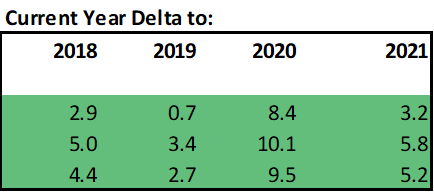
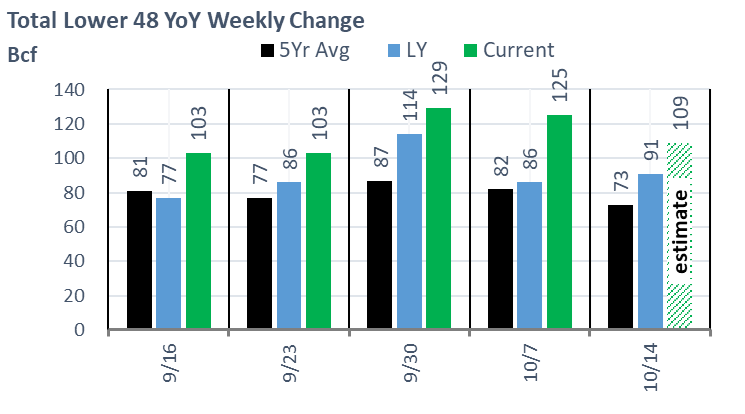
Our estimate for week ending Oct 14th is +109 Bcf. This reporting period will take L48 storage level to 3,340 Bcf (-108 vs LY, -185 vs. 5Yr). The recent string of loose numbers has dramatically decreased the storage deficit. Last year we injected only +91 Bcf during the same week.
Here is the full fundamental picture compared to last week and the same week last year.
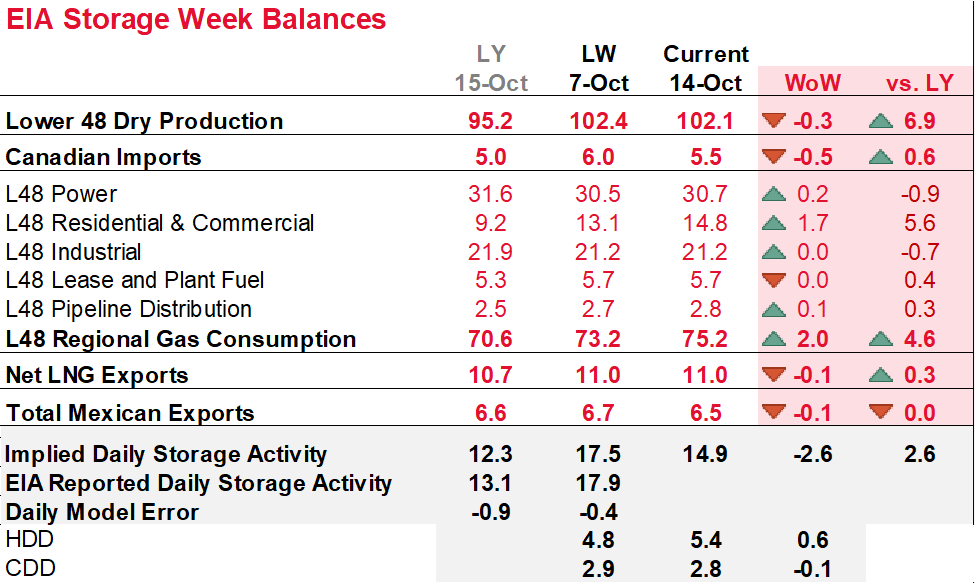
Production: Domestic production remained almost flat week-on-week. We saw stronger production levels at the beginning of the week, with a modest decline on the back end.
Consumption: Temps at the national level were quite flat overall. L48 population wt. CDDs were unchanged, while a small increase in HDDs (with the East continuing to remain cool) led to a small increase in RC consumption. The change to cooler temps has a quick impact on RC consumption, as the spread between daytime highs and nighttime lows widens.
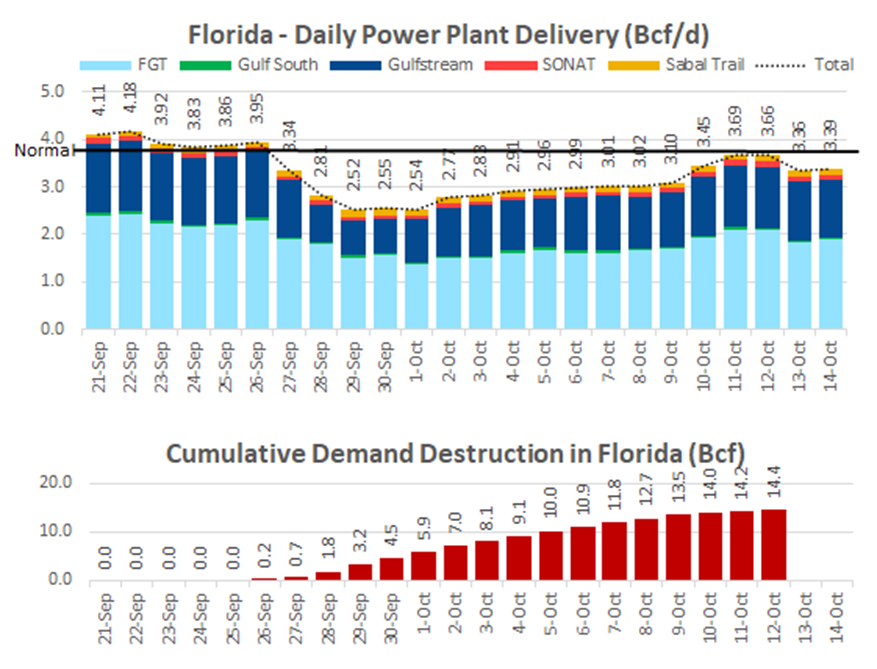
Power: Low power burns continue this week with the drop in CDDs. The overall reduction in power load was off by 19.7 aGWH or 8.2%. Every kind of generation contributed to the overall load decline, except for wind with increased slightly by 4.0 aGWh week-on-week. Also, here is one last note on the Florida power destruction from Hurricane Ian. Based on pipeline data, it appears that FL is back to normal. The total gas demand destruction stands at 14.4 Bcf as of Oct 12th.
LNG: This past week, LNG continues to remain low with Cove Point on its annual three-week maintenance. Cove Point maintenance typically lasts 21-28 days, but this specific episode is meant to last only 17 days.
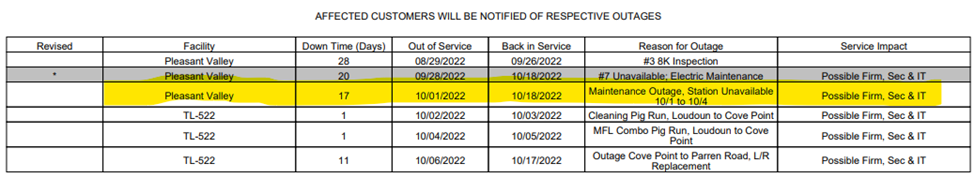
Source: https://dekaflow.bhegts.com/jsp/info_post.jsp?&company=cpl#
Last we mention that Freeport still has two ships headed its way for later this month. The Prism Brilliance and Prism Diversity are set to arrive on October 18th and 27th, respectively. Click these links to track them: PRISM BRILLIANCE PRISM DIVERSITY
This email, any information contained herein and any files transmitted with it (collectively, the Material) are the sole property of OTC Global Holdings LP and its affiliates (OTCGH); are confidential, may be legally privileged and are intended solely for the use of the individual or entity to whom they are addressed. Unauthorized disclosure, copying or distribution of the Material, is strictly prohibited and the recipient shall not redistribute the Material in any form to a third party. Please notify the sender immediately by email if you have received this email by mistake, delete this email from your system and destroy any hard copies. OTCGH waives no privilege or confidentiality due to any mistaken transmission of this email.