This week we start by reviewing some big changes made to the 2021 EIA Natural Gas S/D data. Along with the release of the July S/D data, the EIA “issued extensive revisions to data for 2020, 2021, and year-to-date 2022 because of benchmarking to annual data published in the Natural Gas Annual 2021 (NGA).”
The nature of these changes are quite important, and we will likely see these flow into daily and forward-looking production and demand estimates that use the EIA data as the benchmark soon.
Here is the full story of the changes in three charts:
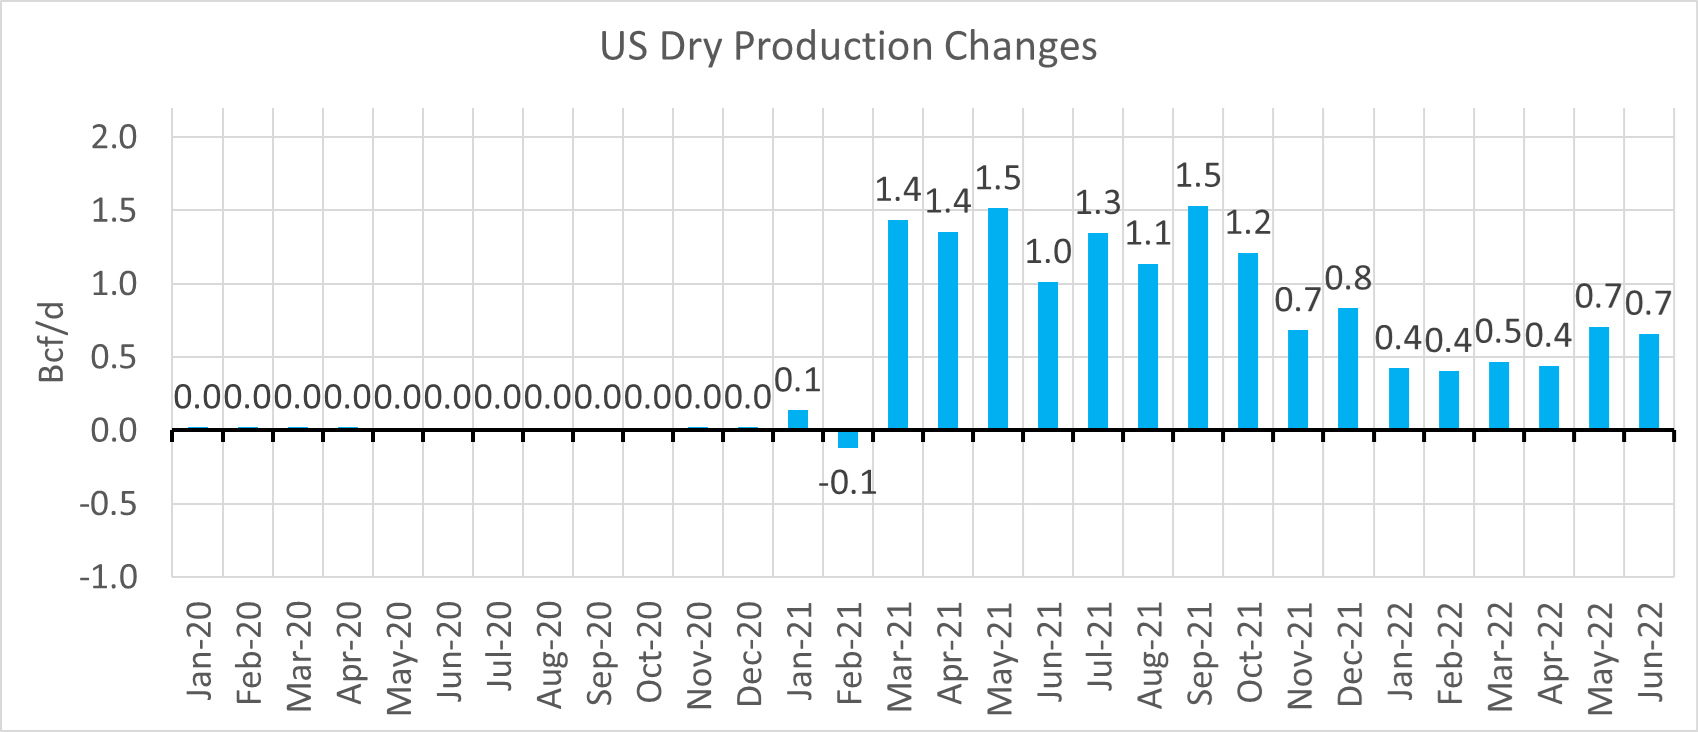
Production
Production levels were unchanged for 2020, but there were massive adjustments made to both 2021 (1.0 Bcf/d on average) and the first half of 2022 (0.6 Bcf/d on average). So all this time when we were saying that production levels were relatively stale – we were misguided.
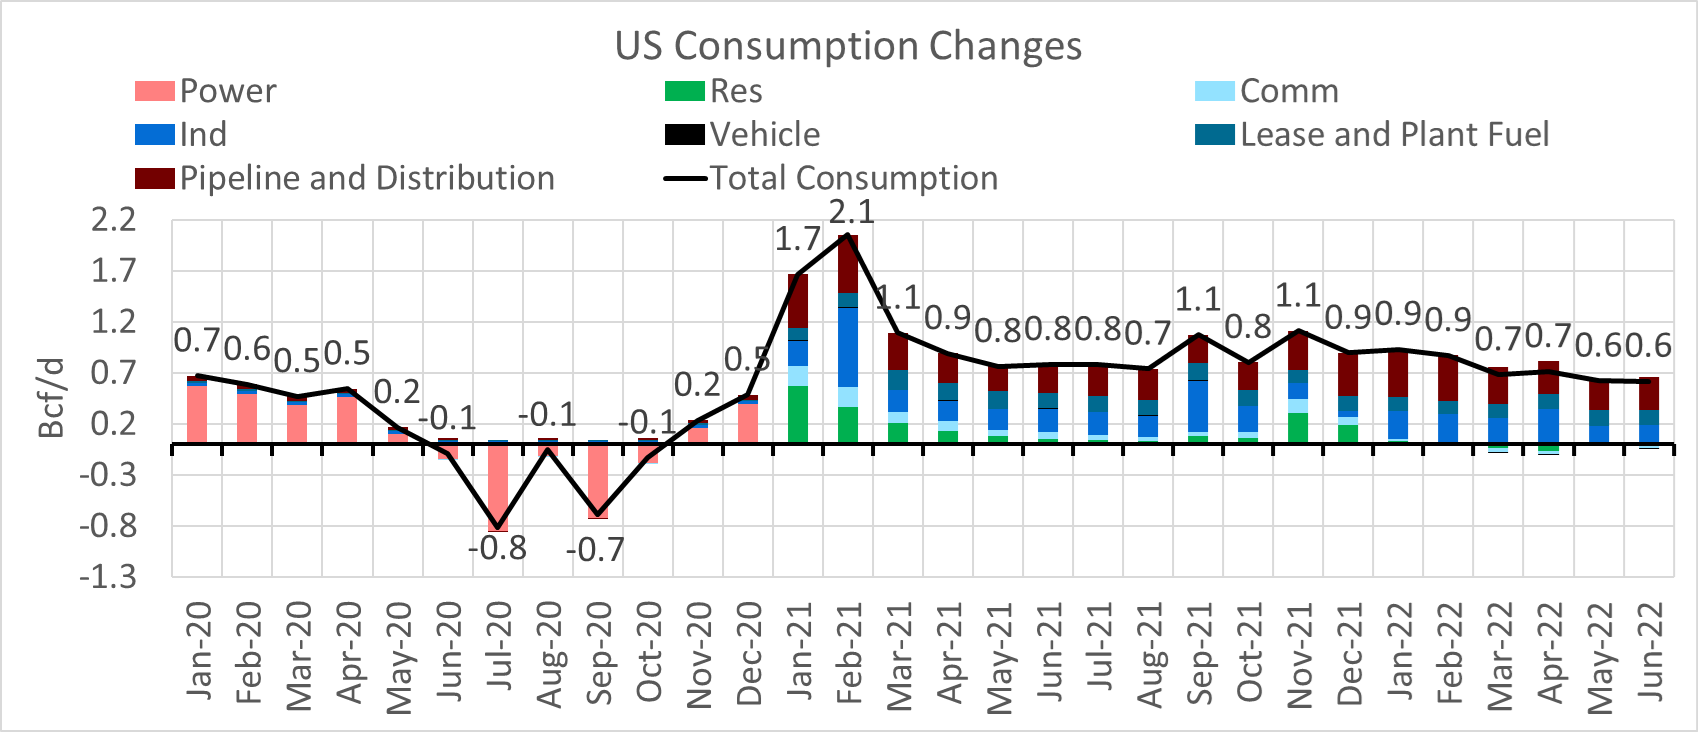
Consumption
The changes to historical consumption are quite drastic. A couple of key things to note:
1) Changes to the power burns were made for 2020, but not really in 2021 and 2022.
2) The changes to consumption in 2021 and 2022 were mainly made to Industrial uses (Industrial + Pipe/Dist + Lease/Plant). This is generally a hard category to track as it is not entirely tied to the weather, and is difficult to follow from the ebb daily pipeline data.
3) The 2021 and 2022 somewhat track the increased production estimates.
My guess is that these changes were an attempt to cancel out the changes of the rapidly increasing supply.
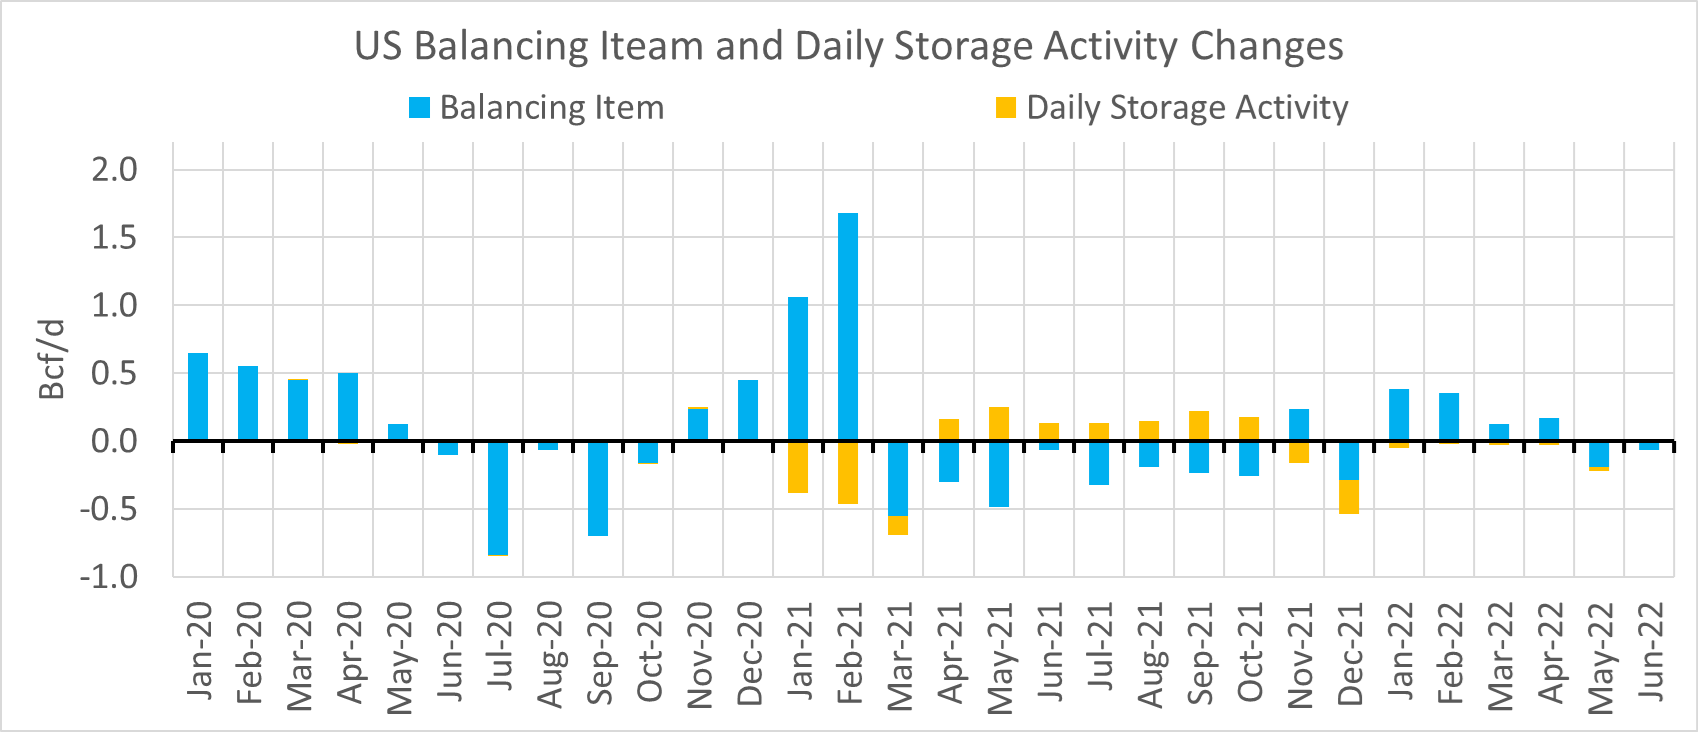
Balancing Item and Daily Storage Activity
The balancing items is usually the catch-all error line item. It typically follows a seasonal pattern where its highest in the winter and falls through the rest of the year. The belief is that RC consumption is precisely tracked as the utility level metering/billing is done on a one-month lagged basis. The changes to the balancing item and daily storage look to be an attempt to get the balancing item to match historical levels.
Our overall takeaway from all these changes is that production levels now better track actual levels. The market had been understating levels, and this increase will now make its way through industry production models as vendors recalibrate higher.
This helps verify what we have been saying for some time. We believe that the loose storage numbers we have had all summer have been due to production levels being 1+ Bcf/d. When the EIA restates 2022 numbers again next year, we will likely see monthly production levels pushed higher.
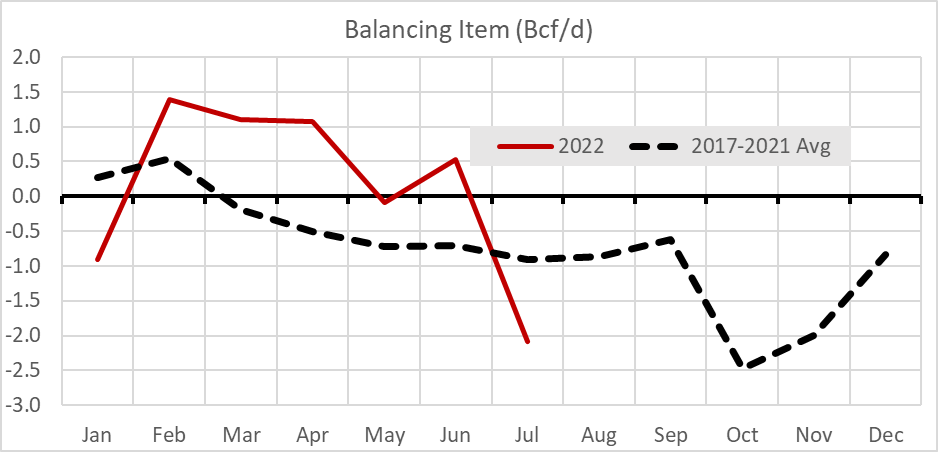
The evidence is seen in how out of whack the 2022 balancing item currently is. If the EIA restates the 2022 balancing item to get back to historical norms then they will likely have it show up in supply to keep things balanced.
NatGas Storage Fundamentals:
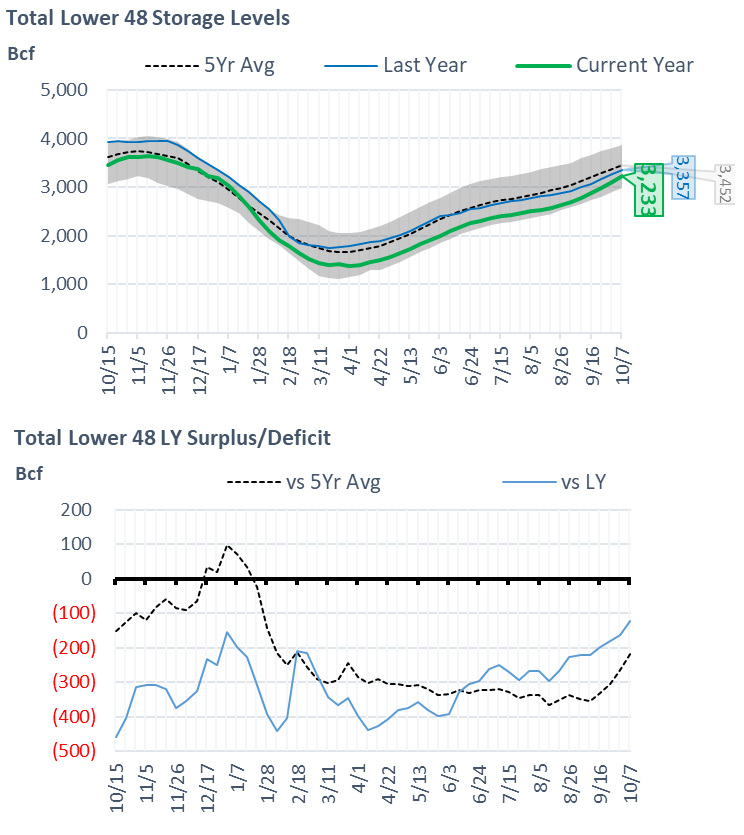
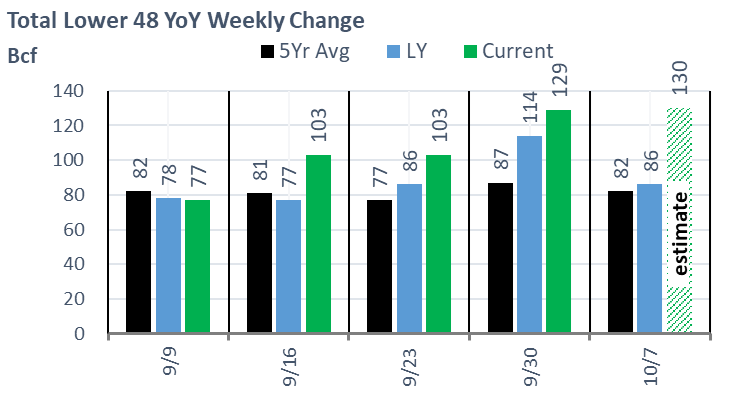
The EIA reported a repeat +129 Bcf injection for the week ending Sept 30th, which came in much higher than our estimate of +121. This storage report takes the total level to 3106 Bcf, which is 165 Bcf less than last year at this time and 264 Bcf below the five-year average of 3,370 Bcf. This is the 3rd triple-digit build in a row, and in fact, this is the 3rd highest of all time. The #1 spot goes back to week ending July 4, 2003 and the #2 spot goes back to week ending May 29, 2015.
With this string of loose builds, we are quickly erasing that year-on-year deficit.
We are still having a hard time explaining the massive injection reported. Below are some details that somewhat tell the story:
- Total supply jumped by almost 1 Bcf/d from domestic sources. Luckily, production out of the GoM was minimally impacted due to Hurricane Ian. That being said, platforms/rigs by some of the major producers were evacuated on a precautionary basis on Sept 27th and 28th ahead of the storm. The BSEE reported a peak of 0.18 Bcf/d being shut-in on Tuesday, but by Thursday all platforms and rigs were once again operational.
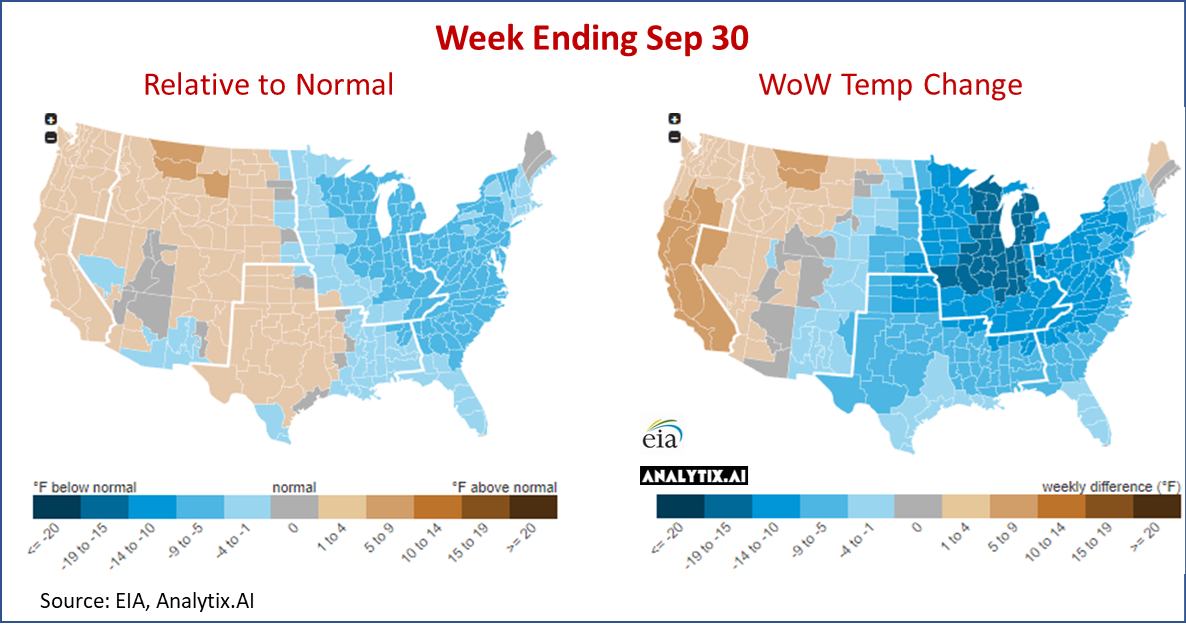
- Week over week, gas use fell significantly. This past week, notably at the end of the week while Hurricanes Ian and Fiona kept the whole East coast chilly, the L48 population weight CDDs declined pretty significantly. In addition, several northern states are already transitioning from CDD- to HDD-dominant temperatures. During the reporting week, CDDs decreased by 3.8F from week to week while HDD increased by 2.7F. Here is a view of the temps by EIA region.
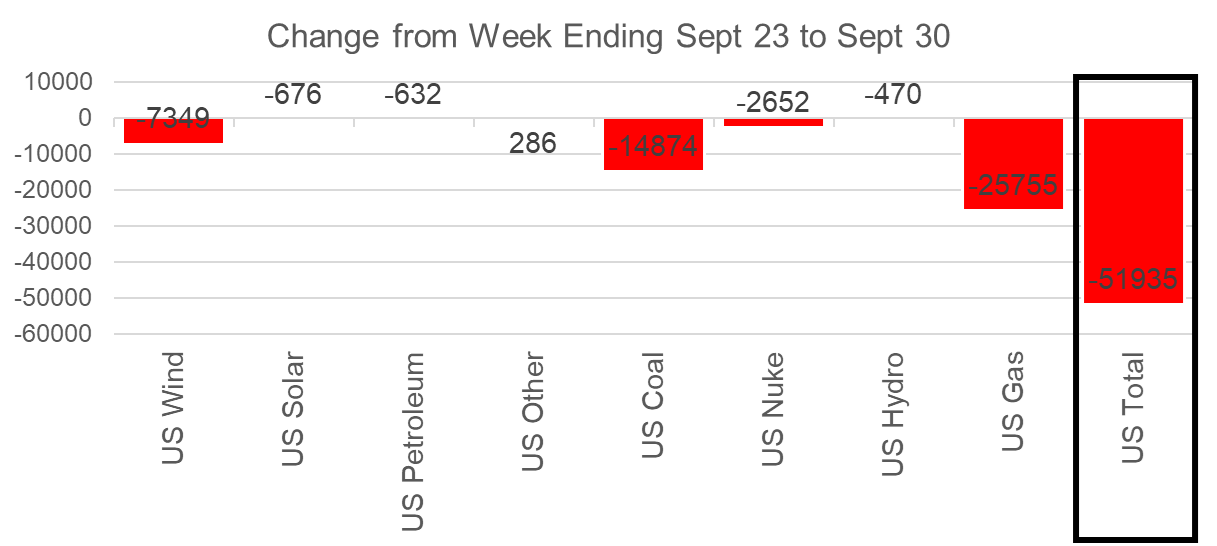
- As a result of the severe decline in CDDs (particularly along the Eastern Seaboard) and the direct storm damage, power loads decreased by 26 aGWH or 10.8% from the prior week. As a result, all forms of generation, including wind and solar, were lower. Natural gas generation was off by 25.8 aGWh, or an equivalent 4.8 Bcf/d in power burns, the greatest of all generation types (assuming the displaced marginal gas plant is a 7.8 HR plant).
- RC demand, Mexican exports, and LNG feedgas levels were the outliers to the loose theme. The rise in HDDs led to additional usage of +3.7 Bcf/d for heating, while Mexican and LNG levels were 0.3-0.4 Bcf/d higher week-on-week.
We still have trouble explaining the +129 Bcf injection despite there being so many loosening factors week-on-week. Hurricane Ian definitely increased the noise, which is something we are thinking about, particularly on the RC and Industrial side. Even if that were the case, it would only have had a significant effect on the final two days of the storage week. We calculate this reported injection to +5.5 Bcf/d loose YoY – (wx adjusted), which is significantly out of range. [We compare this report to LY’s rolling 5-week regression centered around week #39]
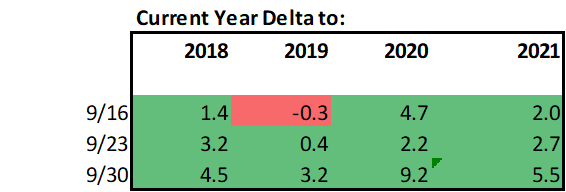
The image below shows the same data in chart format. The lines for 2018-2021 essentially show the resulting injection in those years (during week 38 through 42) if they experienced the same temps as this current summer (historical + the 15-day forecast).
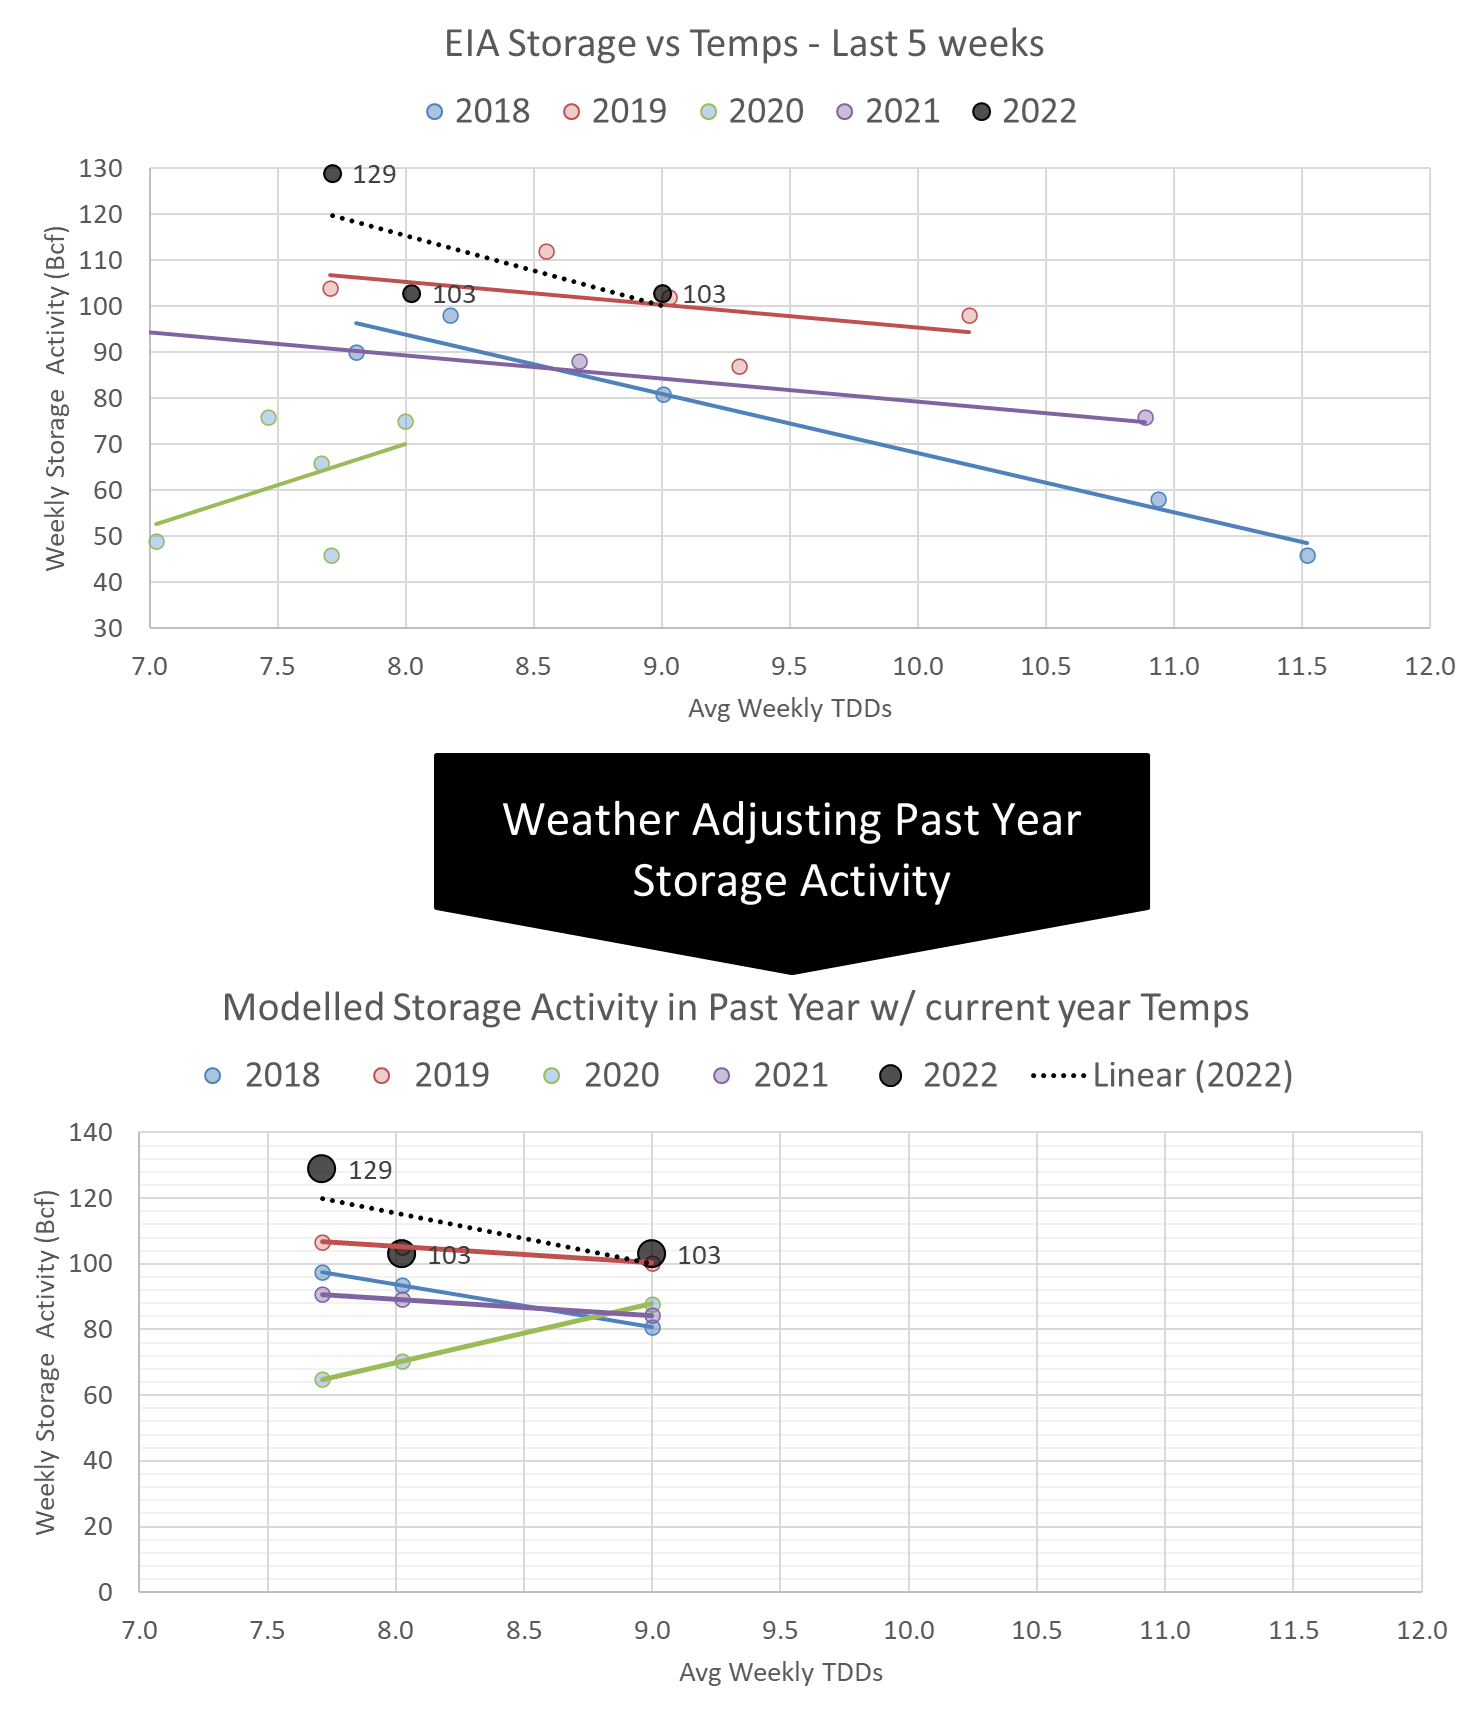
Our estimate for week ending Sept 30th is +130 Bcf. This reporting period will take L48 storage level to 3,236 Bcf (-121 vs LY, -216 vs. 5Yr). This upcoming report once again dramatically decreases the YoY deficit. Last year we injected only +86 Bcf during the same week.
With this week’s continued change to cooler temperatures and the inclusion of Hurricane Ian’s full effects, the same level of injections has a different fundamental makeup. Here is the full fundamental picture compared to last week and the same week last year.
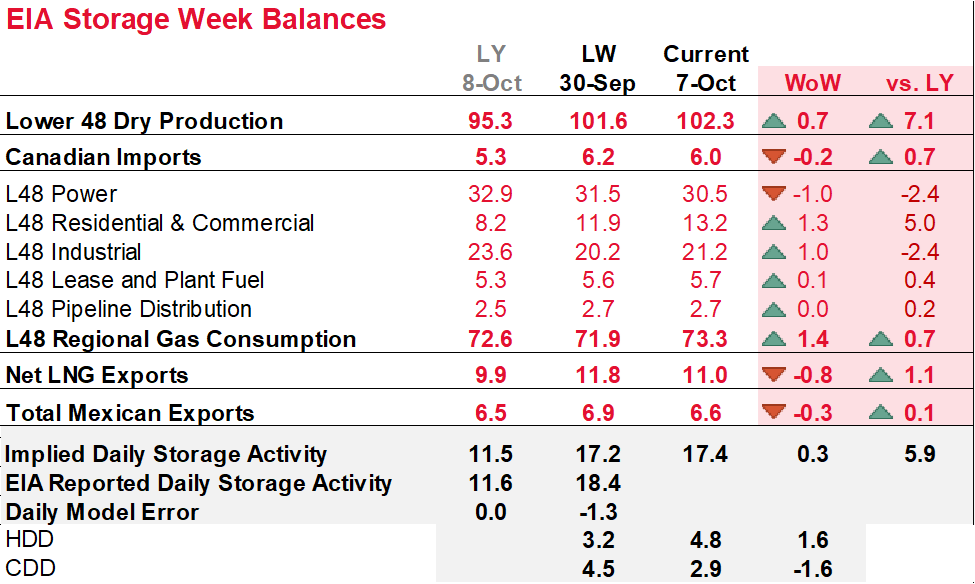
Production: Domestic production saw a massive jump last weekend with the both the SC and Northeast rising. The completion of the TETCO/Nexus outage resulted in strong production out of the App basin, while the SC continues to see strength with the rise in operating rigs. Both the Permian and Haynesville have continued to rise this year.
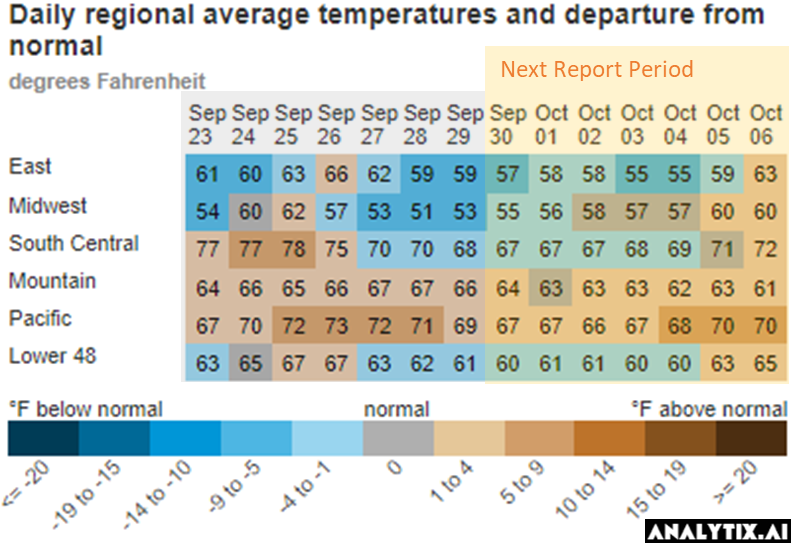
Consumption: The L48 population wt. CDDs continued to fall this past week, specifically along the East coast with cooler weather due to Hurricane Ian. The seasonal transition from CDD dominant temps to HDD dominant resulted in L48 CDDs dropping by 1.6F week-on-week and HDD picking up by 1.6F. Here is a view of the temps by EIA region.
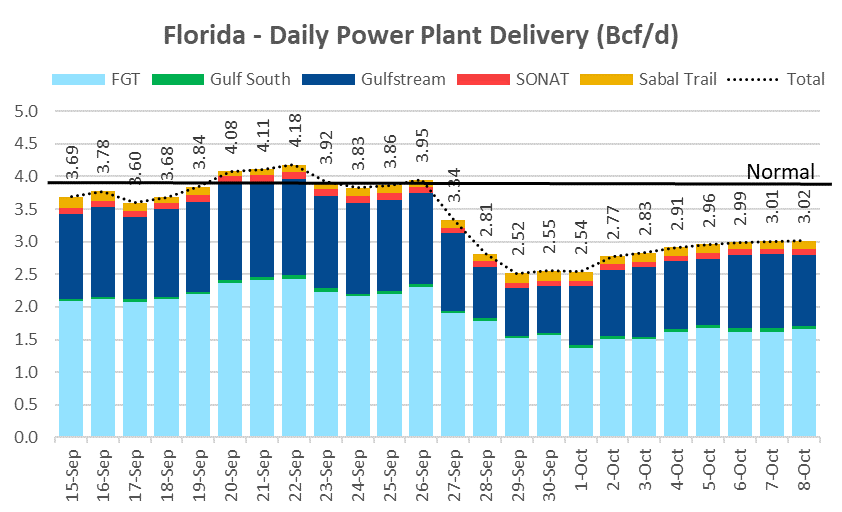
Power: Low power demands were maintained by cooler temperatures and Hurricane Ian damage. The overall reduction in power load was 21.5 aGWH or 5.0%. Every kind of generation contributed to the overall load decline, while wind output fell by the most of 7.8 aGWh week-on-week. Surprisingly, despite our estimation that Florida’s power outage reduced gas demand by an average of 1.1 Bcf/d over the course of the week, gas generation at the national level was almost unchanged.
LNG: This past week, LNG usage dropped significantly as Cove Point began its annual three-week maintenance. The low levels were further exacerbated by lower feedgas levels at Sabine Pass. The reason behind the Sabine decrease is not entirely clear, but as of Friday, the terminal appeared to be ramping up.
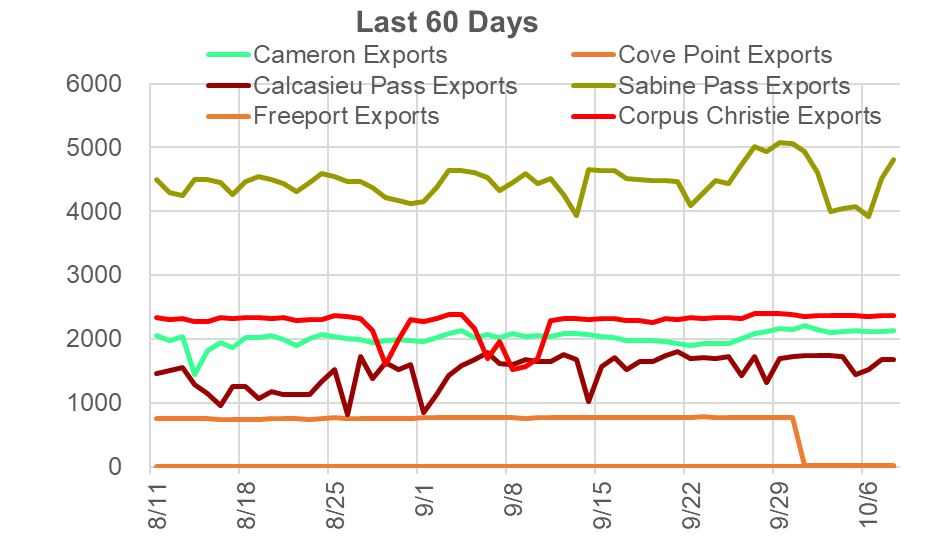
Freeport is back in the news this past week. The LNG ship Prism Brilliance is slated to arrive at the Freeport terminal on October 18th. This has caused some confusion in the market on when the plant will reopen. Here is a link to track the progress of this ship.
This email, any information contained herein and any files transmitted with it (collectively, the Material) are the sole property of OTC Global Holdings LP and its affiliates (OTCGH); are confidential, may be legally privileged and are intended solely for the use of the individual or entity to whom they are addressed. Unauthorized disclosure, copying or distribution of the Material, is strictly prohibited and the recipient shall not redistribute the Material in any form to a third party. Please notify the sender immediately by email if you have received this email by mistake, delete this email from your system and destroy any hard copies. OTCGH waives no privilege or confidentiality due to any mistaken transmission of this email.