This past week came and went with so much stuff happening. Let’s start by covering Hurricane Ian and its impact to natural gas markets. With the path of Ian well known early in the week, the market understood early that this storm was going to be a demand destruction story. That being said, there were some major Gulf producers that did evacuate personnel from platforms and rigs on Sept 27th and 28th. The impact to oil and gas production was minimal though. Here are the details we scrubbed from BSEE:

As the storm made landfall on Wednesday, millions of Florida customers quickly lost power due to the strong winds, storm surge, and heavy rains. The storm quickly passed through Florida and entered the Atlantic where it lost energy and was degraded to a Tropic Storm. On Friday, the storm once again made landfall at a Cat 1 Hurricane into South Carolina. Here is a view of Ian as it re-entered SC on Friday:

We tracked data from PowerOutage.us to get a view of the impact to burns. Here is the approximate story on their outages up until yesterday.
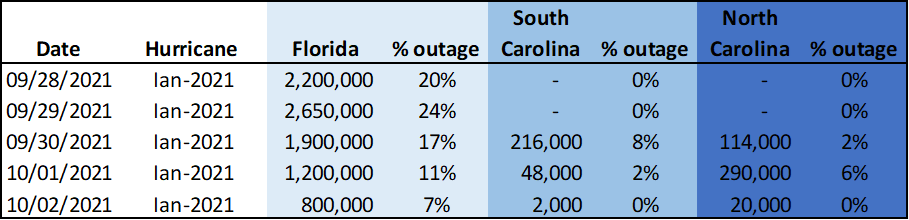
Source: Approximate afternoon outages from PowerOutage.us
We use the estimate of % outage to approximate the demand destruction as result of Hurricane Ian. Looking at historical state-level data for Florida, South Carolina, & North Carolina, we estimate normal power burns for this time of the year to be:
Florida = 4.0 Bcf/d
South Carolina = 1.0 Bcf/d
North Carolina = 0.6 Bcf/d
Using these figures we can now get a decent estimate of demand destruction for the week.
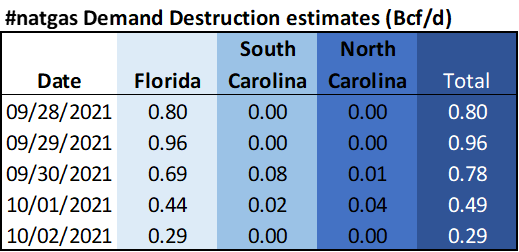
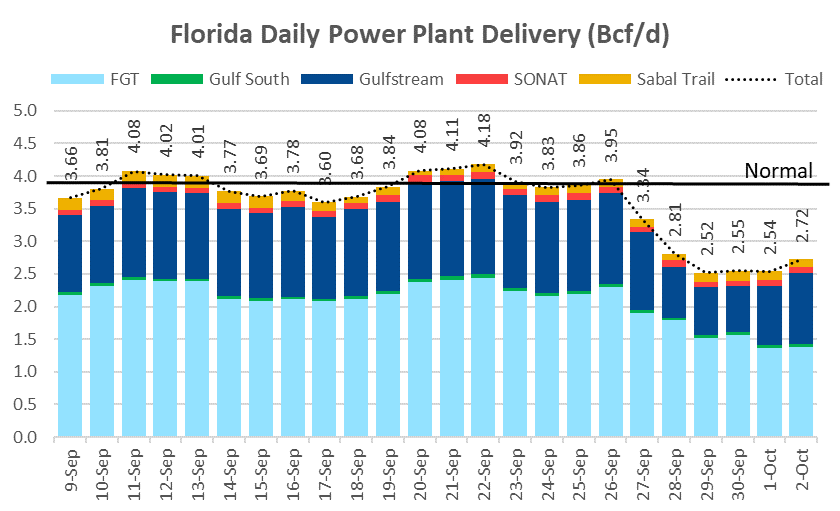
The figures above are slightly lower than the story that is painted from the change in pipeline deliveries. Based on interstate pipeline deliveries in Floria, the peak demand loss was 1.2-1.3 Bcf/d. Here is a chart showing the impact.
For the next two reports, we believe the impact to the storage report to be quite minimal. In fact, the above estimates should be slightly taken lower because the increased HDDs and cloud cover leading to lower solar output in the Carolinas. FL, NC, and SC have a total of 12.6 GW of solar capacity.
NatGas Storage Fundamentals:
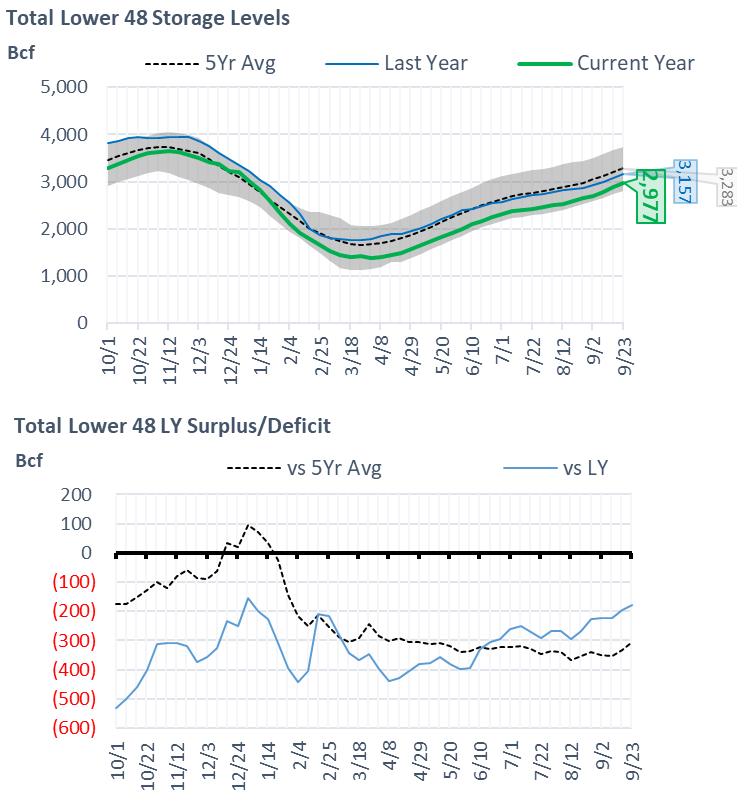
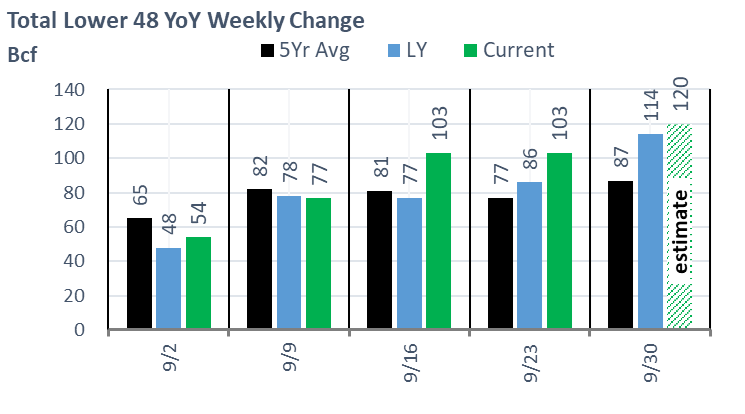
The EIA reported a repeat +103 Bcf injection for the week ending Sept 23rd, which came in line with our estimate of +101. This storage report takes the total level to 2977 Bcf, which is 180 Bcf less than last year at this time and 306 Bcf below the five-year average of 3,283 Bcf. The last time we saw triple-digit builds in September was in 2019, and in fact, the build this month is very much in line with 2019. More to follow on this.
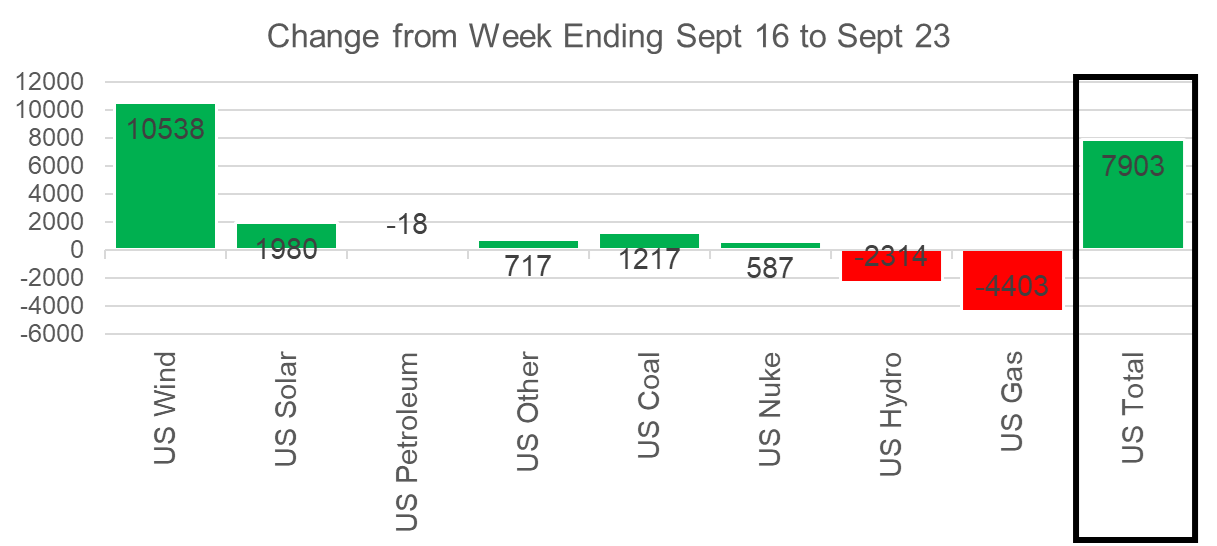
With injection similar week-on-week, below are the details that led to this repeat:
- Total supply continues to remain strong at over 100 Bcf/d, and basically flat week-on-week. Production out of the GoM was minimally impacted due to Hurricane Ian. Ian avoided the GoM production core area as it swung East after entering the Gulf. That being said, platforms/rigs by some of the major producers were evacuated on a precautionary basis on Tuesday ahead of the storm. The overall impact to natgas volumes was minimal, with the BSEE reported a peak of 0.18 Bcf/d being shut-in on Tuesday. By Thursday all platforms and rigs were once again operational. The TETCO/Nexus outage still continues, and that continues to impact Northeast production. Flows are to resume this weekend, as the pipe was excepting nominations for Oct 1.
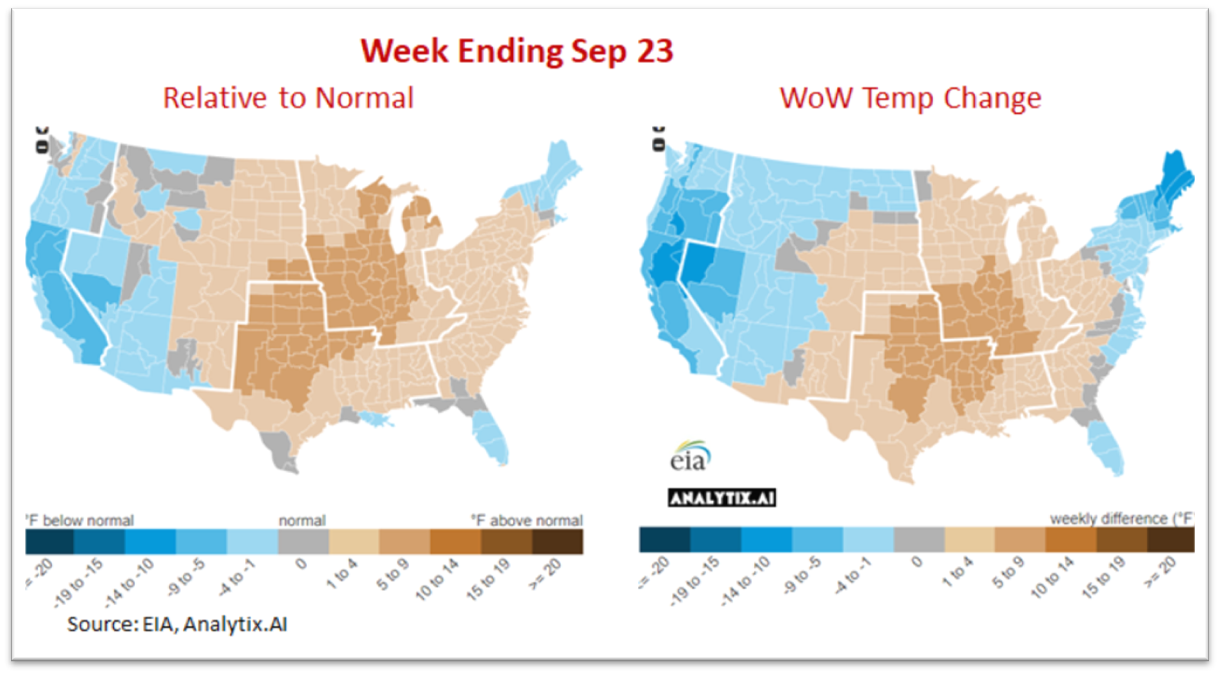
- Overall gas consumption was also flat week-on-week. The lower slightly power burns (-0.9 Bcf/d) were offset by rising RC and Industrial demand. Looking at temps, there were big shifts in temps from one region to the next. The central part of the country got warmer, while the two coasts cooled slightly to even out overall power burns.
- Overall power loads were higher for the reported week, but power burns were off with both wind and solar playing a larger role in the power generation mix. Wind generation averaged 47.94 GWh which was 10.5 GWh higher than the previous week. This rising wind output lowered 1.9 Bcf/d or 13 Bcf/week of power burns. Solar generation rose by 1.9 aGWh to 17.1 aGWH, which knocked out 0.4 Bcf/d of gas generation.
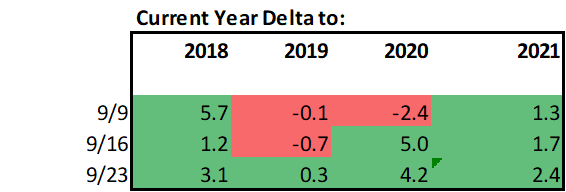
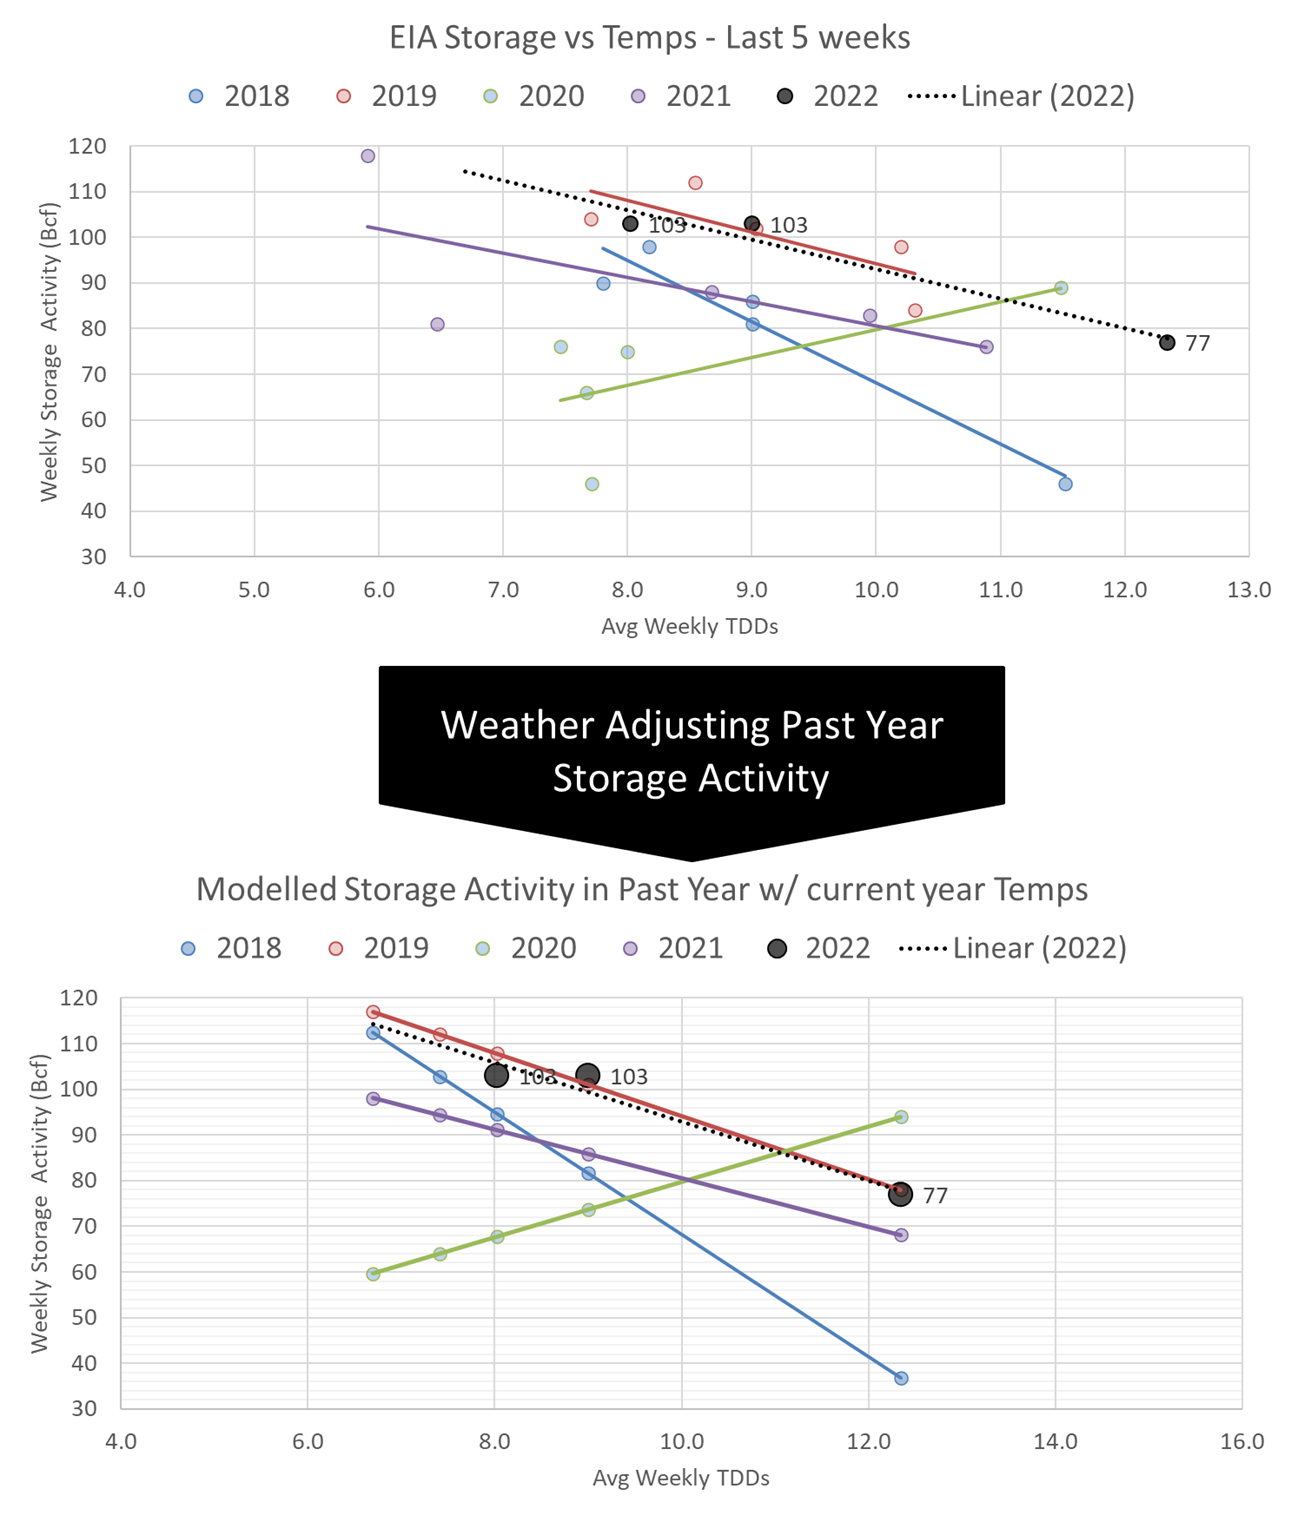
We calculate the +103 Bcf injection being +2.4 Bcf/d loose YoY – (wx adjusted). [We compare this report to LY’s rolling 5-week regression centered around week #39]
The image below shows the same data in chart format. The lines for 2018-2021 essentially show the resulting injection in those years (during week 36 through 40) if they experienced the same temps as this current summer (historical + the 15-day forecast). As we alluded to above, this September’s injections have been very much aligned with September 2019. In 2019, the next 5 injections (to get to end of Oct) totaled 412 Bcf. This year with the continued loose numbers, we are expecting more to be injected in the month of October.
Our estimate for week ending Sept 30th is +120 Bcf. This reporting period will take L48 storage level to 3,097 Bcf (-174 vs LY, -273 vs. 5Yr). This upcoming report once again dramatically decreases the YoY deficit. Last year we injected +114 Bcf during the same week.
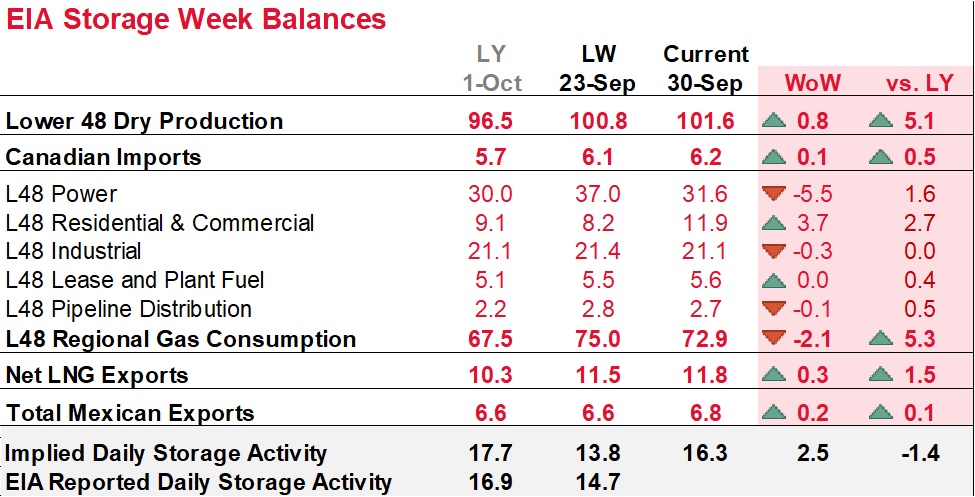
The stronger week-on-week injection comes as a result of more robust production out of Texas, dropping power burns with cooling temps, and some demand destruction related to Hurricane Ian. The drop in power burns was somewhat counterbalanced with increased RC consumption in the upper Midwest and Northeast. Here is the full fundamental picture compared to last week and the same week last year.
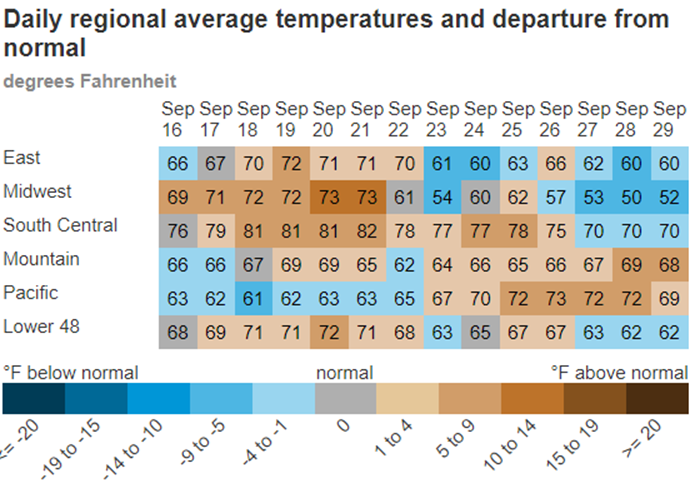
Consumption: The L48 population wt. CDDs fell quite hard this past week, specifically on the backend of the week. We are starting to observe the switch from CDD dominant temps to HDD dominant for many northern states and as a result, we saw CDDs drop by 3.8F week-on-week and HDD pick up by 2.5F. Here is a view of the temps by EIA region.
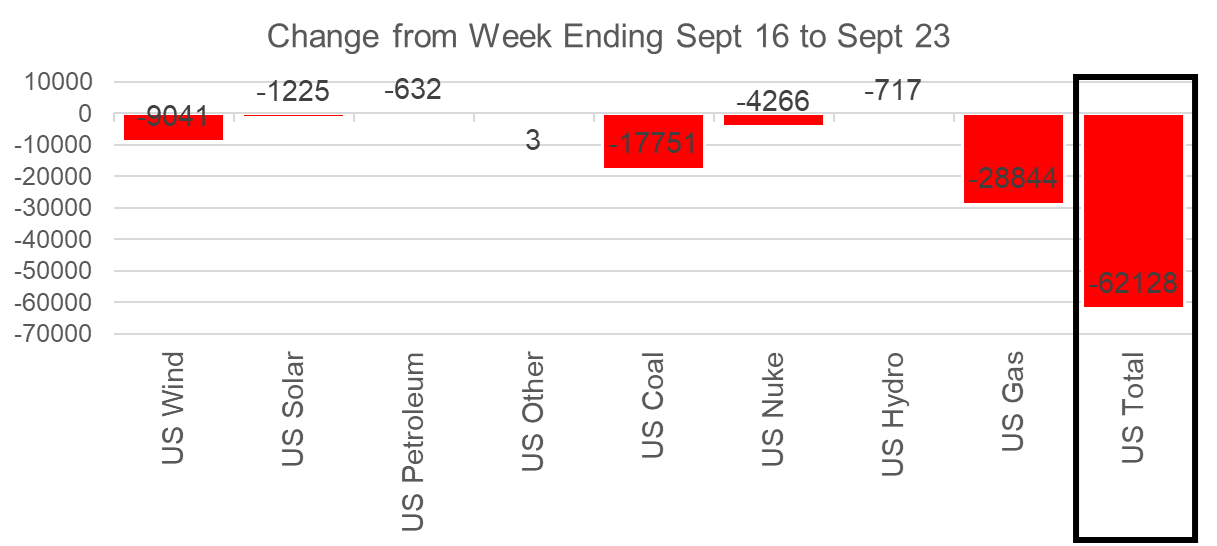
Power: A deeper look at power consumption this week reveals we have officially exited summer. Overall power load dropped by 62 aGWH or 13.0% as a result of cooling temps and the loss of power in. All generation types were off this week, including wind and solar. Natural gas generation was off the most by 28.8 aGWh which converts to 5.4 Bcf/d of power burns (assuming the displaced marginal gas plant is a 7.8 HR plant).
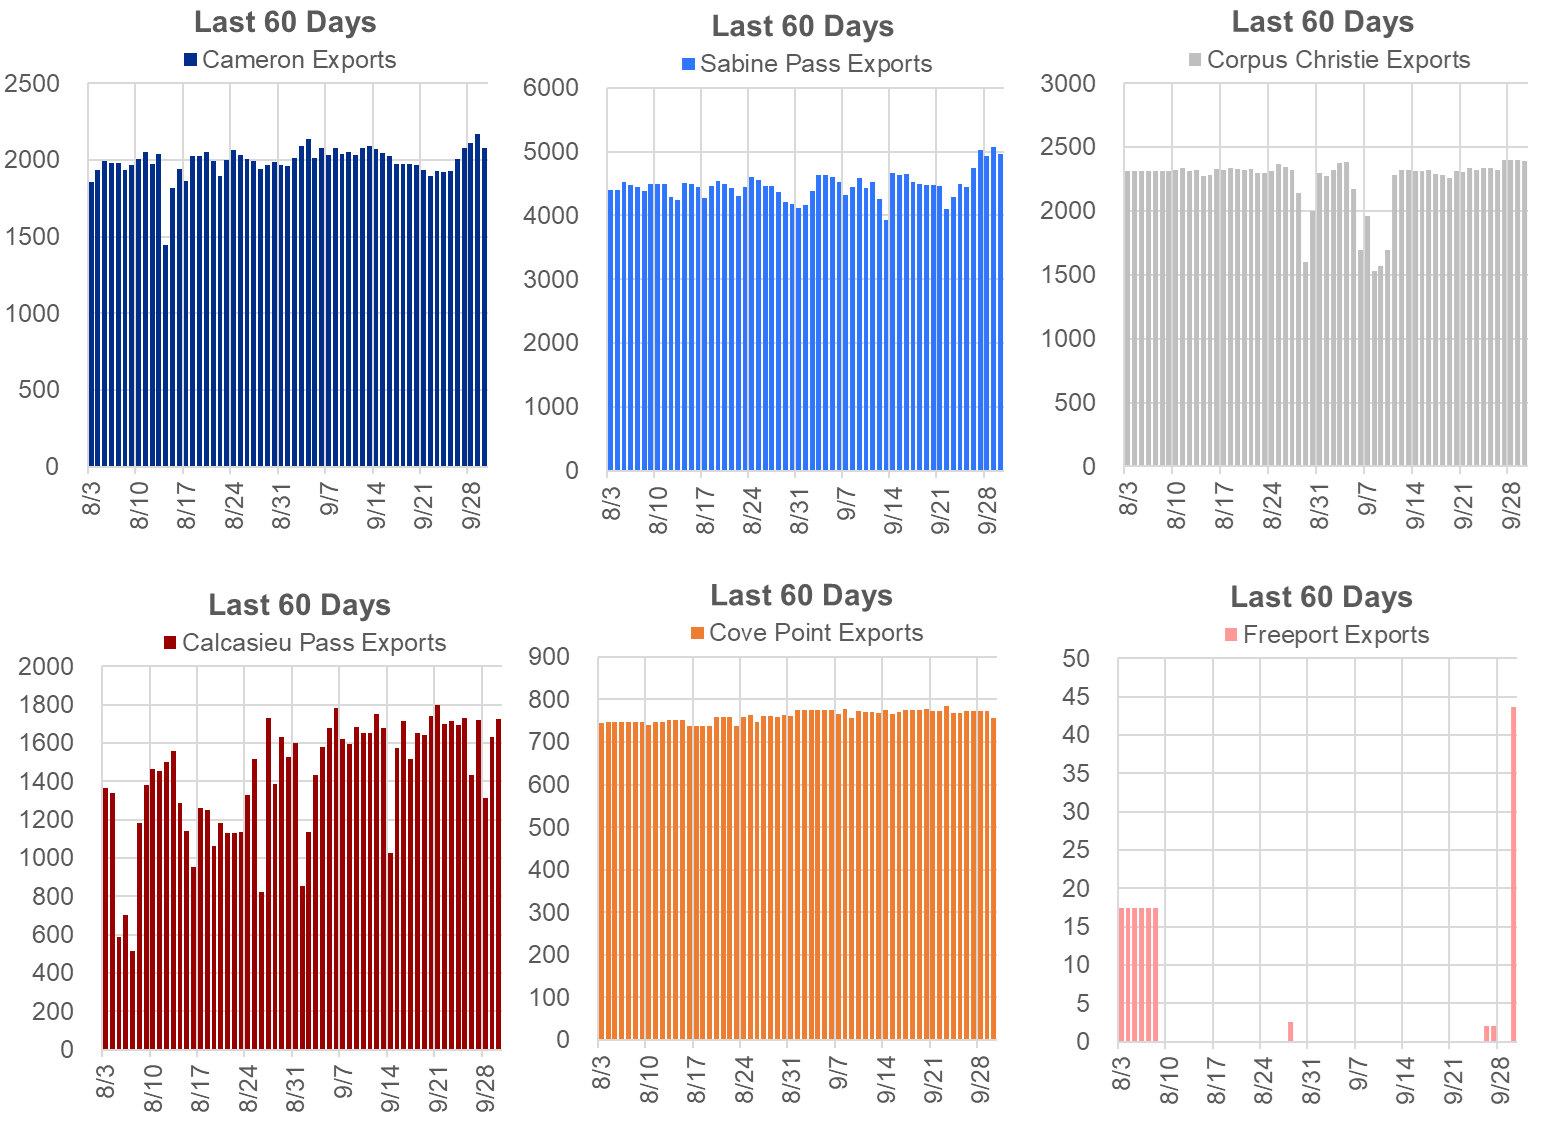
LNG: The last thing we note about this week is the increase in LNG feedgas levels. The tail end of the week saw deliveries crossing 12 Bcf/d without Freeport being available. Many plants have been running at lower utilization levels during the summer heat, and as the heat dissipates in the South we see the plants starting to pick up the pace. For example, Sabine Pass received over 5 Bcf/d for the first time this week since April 26th. We expect LNG feedgas levels to continue to strengthen going into the winter, with the exception of annual maintenance plans hitting some LNG trains. Cove Point is expected to begin a 3-week long maintenance any day. Cove Point typically receives 0.77 Bcf/d.
This email, any information contained herein and any files transmitted with it (collectively, the Material) are the sole property of OTC Global Holdings LP and its affiliates (OTCGH); are confidential, may be legally privileged and are intended solely for the use of the individual or entity to whom they are addressed. Unauthorized disclosure, copying or distribution of the Material, is strictly prohibited and the recipient shall not redistribute the Material in any form to a third party. Please notify the sender immediately by email if you have received this email by mistake, delete this email from your system and destroy any hard copies. OTCGH waives no privilege or confidentiality due to any mistaken transmission of this email.