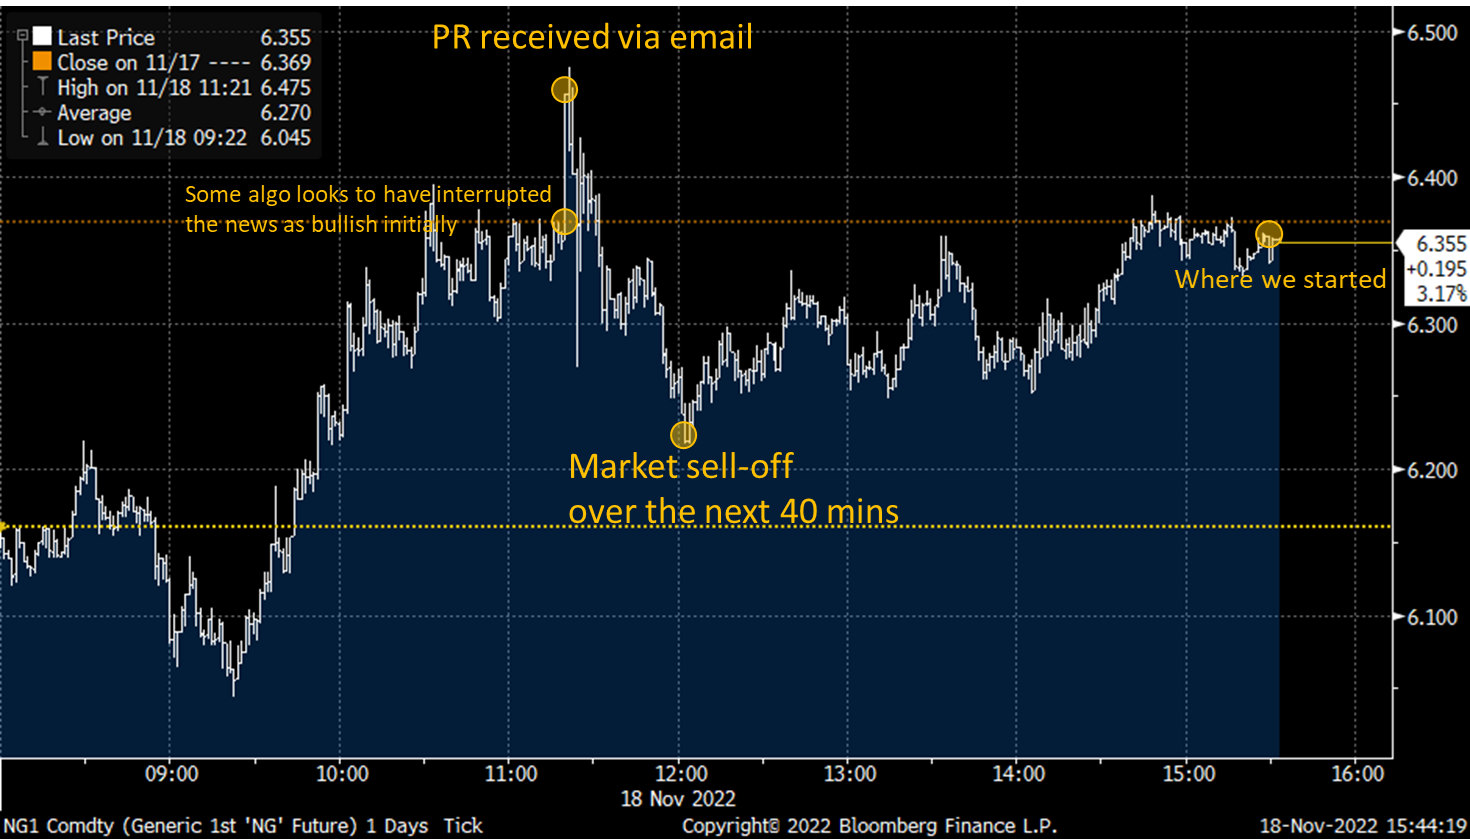
Another week, another Freeport story on Friday. At least this time it didn’t start as a rumor and end with a PR release near the end of the day. The latest release from Freeport gives some sort of timeline, but nothing definitive. The press release came mid-day and as expected the price moved with another Freeport headline.
Let’s dive into the PR and interpret the key lines:
1) “Subject to Freeport LNG meeting its regulatory requirements, it is targeting initial production at the facility in mid-December. ”
Reconstruction is still not complete (end of Nov) and the start is still subject to Freeport LNG meeting all its regulatory requirements. Let’s assume this means a Dec 19th start-up, which is approximately 30 days out.
2) “Each of Freeport LNG’s three liquefaction trains will be restarted and ramped up safely, in a slow and deliberate manner, with each train starting separately before restarting a subsequent train”
The nameplate capacity for each train before the July authorized FERC expansion was 0.714 Bcf/d. Let’s assume one train at the old capacity level comes on every 10 days.
1st train Dec 19th, 2nd train on Dec 29th, and 3rd train on Jan 8th
3) It is expected that approximately 2 BCF per day of production will be achieved in January 2023. Full production utilizing both docks remains anticipated to commence in March 2023.
My assumptions:
The time to load an LNG tanker is approximately 20 hours, so technically the terminal should be able to operate at ~2 Bcf/d with one dock operational. This would require tankers to be scheduled every 1-2 days which might not be logistically possible.
Also to note is that Freeport traditionally operates at 95-98% of design capacity.
Sometime in January = three trains @ 0.714 Bcf/d feedgas level w/ 95% utilization = 2.03 Bcf/d
Sometime in March = three trains at 0.795 Bcf/d feedgas level w/ 95% utilization = 2.26 Bcf/d
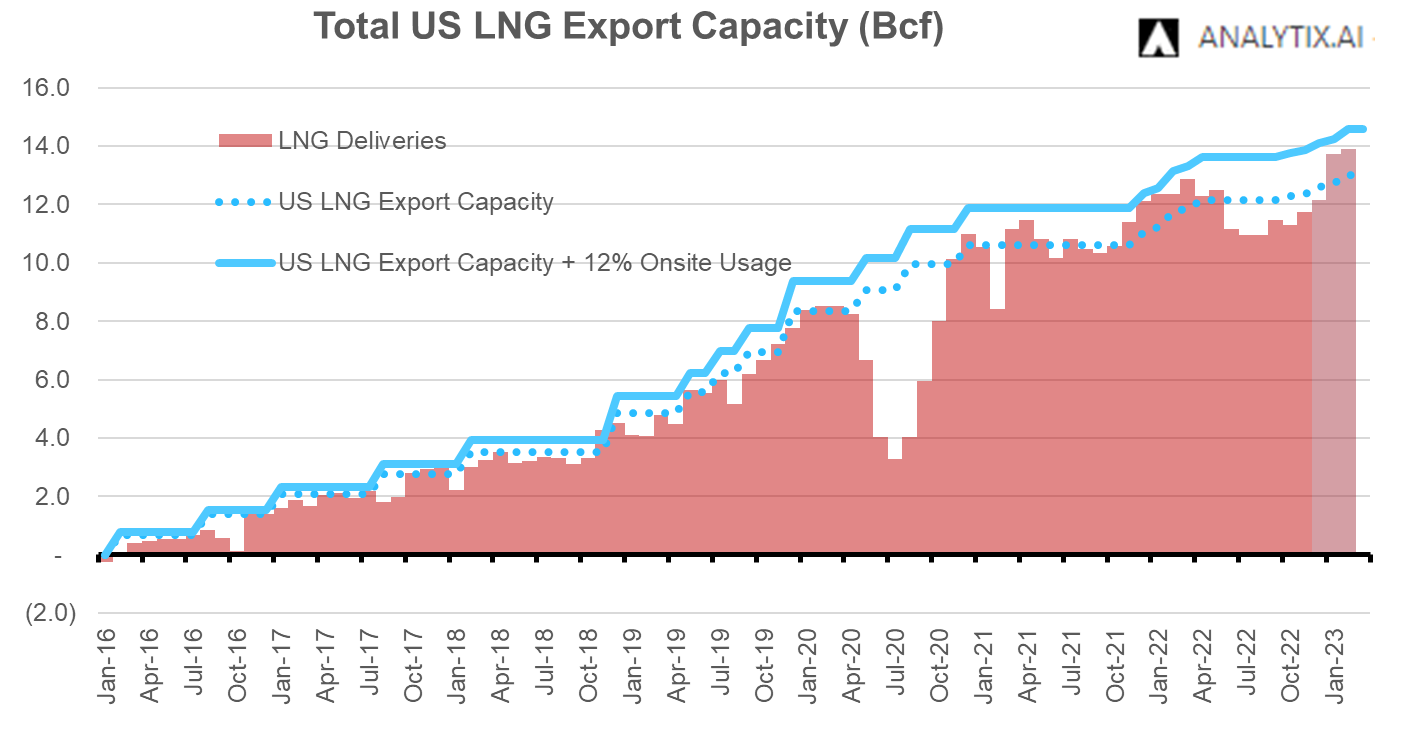
So if all goes as planned, we should see LNG feedgas levels reach 14+ Bcf by mid-Jan.
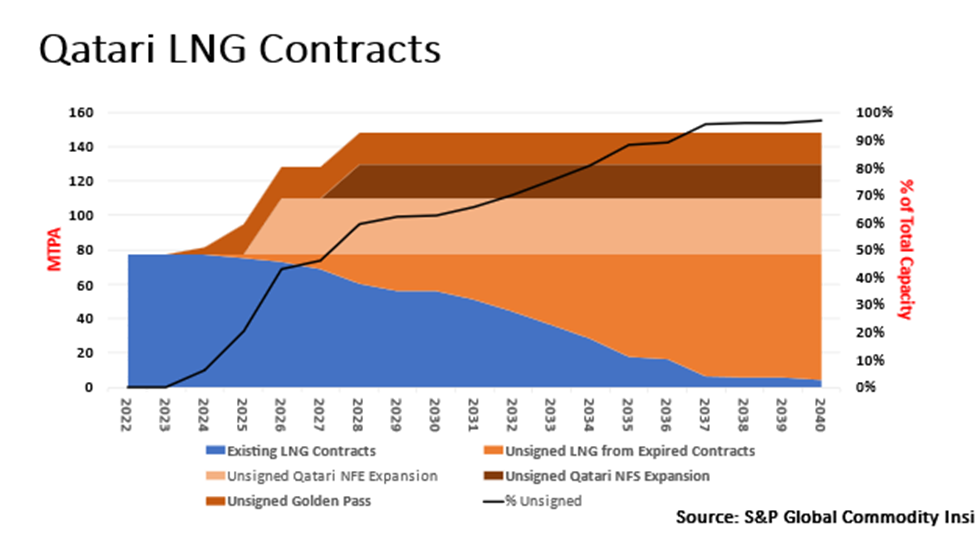
The last thing we wanted to note on LNG is from a tweet posted @ira_joseph of Platts. It’s an interesting developing story, specifically for Europe as they move away from Russian natgas.
Tweet Link: https://twitter.com/ira_joseph/status/1593005204018180096
For sale: tons of #LNG. Tons. Motivated sellers want long-term deals. Existing contracts are expiring & new capacity is under construction. Oil indexaton preferred, but sellers are flexible if the price is high enough. Having trouble contracting your LNG? Maybe this is why. #ONGT
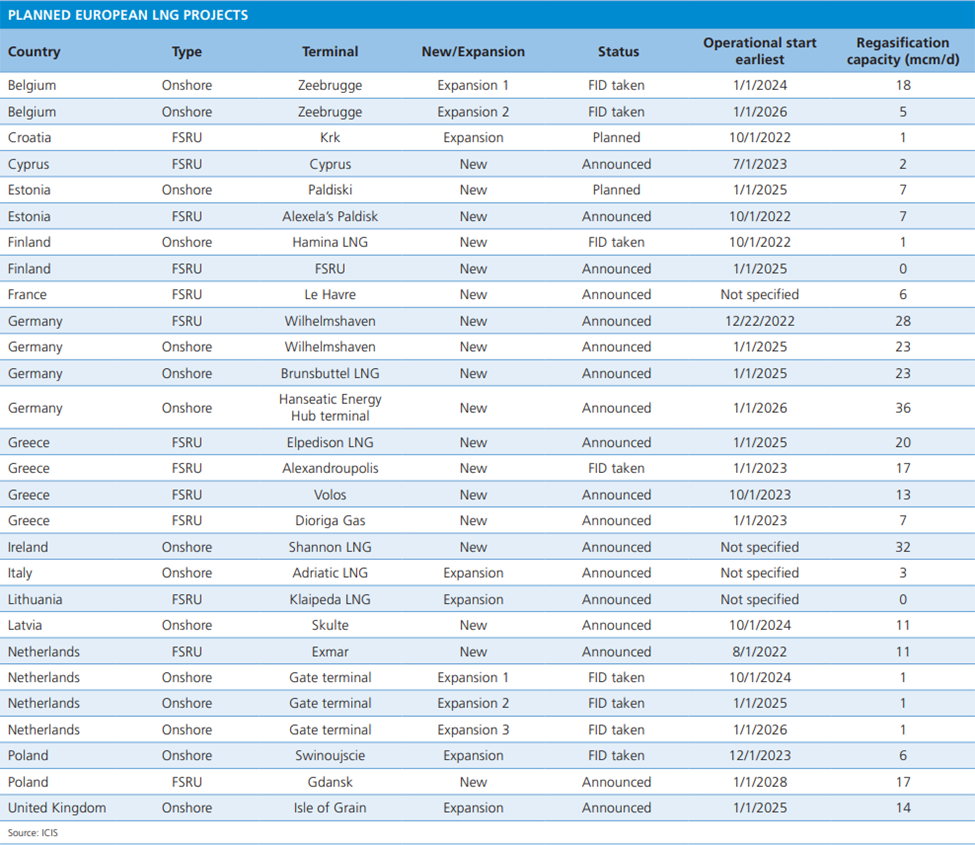
This available capacity paired with increased LNG regas capacity coming online should get things back to steady. The surge of new LNG regasification capacity in northwest Europe could lead to a 37% increase in LNG terminal daily sendout over the coming few years, according to ICIS. Here is a table of all the potential regas capacity coming online.
NatGas Storage Fundamentals:
The EIA reported a +64 Bcf injection for the week ending November 11th, which came in very close to the market expectations of ~+66 and right on our estimate of +64. Our estimate was the midpoint of our S/D model and flow model, which have both been performing well. This storage report takes the total level to 3644 Bcf, which is +4 Bcf over last year at this time and -7 Bcf below the five-year average of 3,651 Bcf. This is officially the last injection of the season. We pinged Nov 11th as the last daily net injection, with heavy daily draws hitting right after.
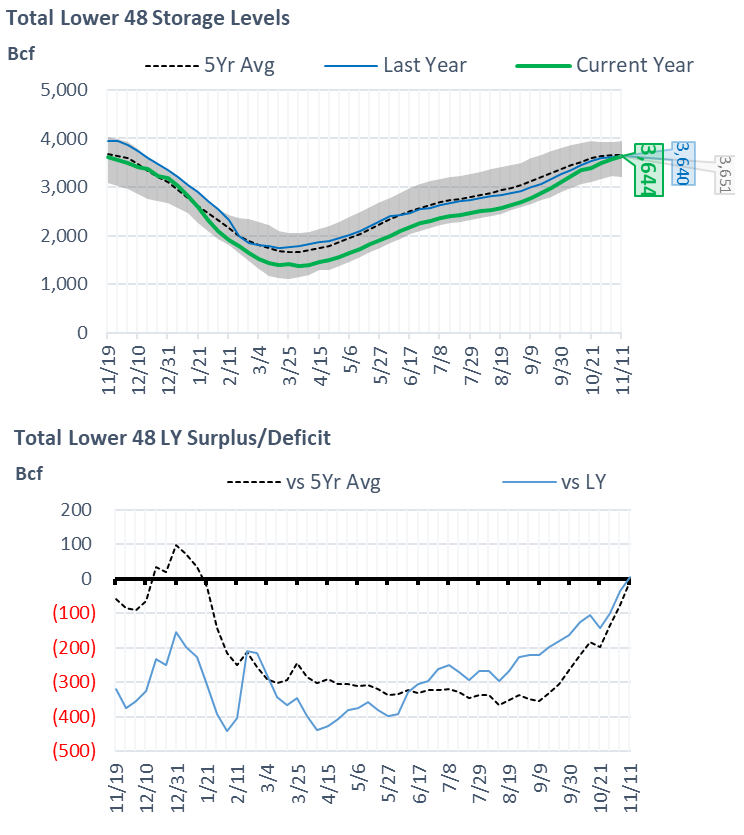
This past report continues to be loose relative to LY. We peg this report at being +2.5 Bcf/d loose (wx-adjusted).
Our fundamental storage model performed well this week, with the actual storage report coming in only a couple of Bcf lower than our S/D-based estimate. Here are the details we gather from the fundamentals:
- Total L48 production was lower for the reporting period with lower Canadian supply adding to the overall tighter supply condition. The total supply was 1.4 Bcf lower than the previous week. We anticipate Marcellus and Utica production to start its ramp higher with stronger regional cash prices.
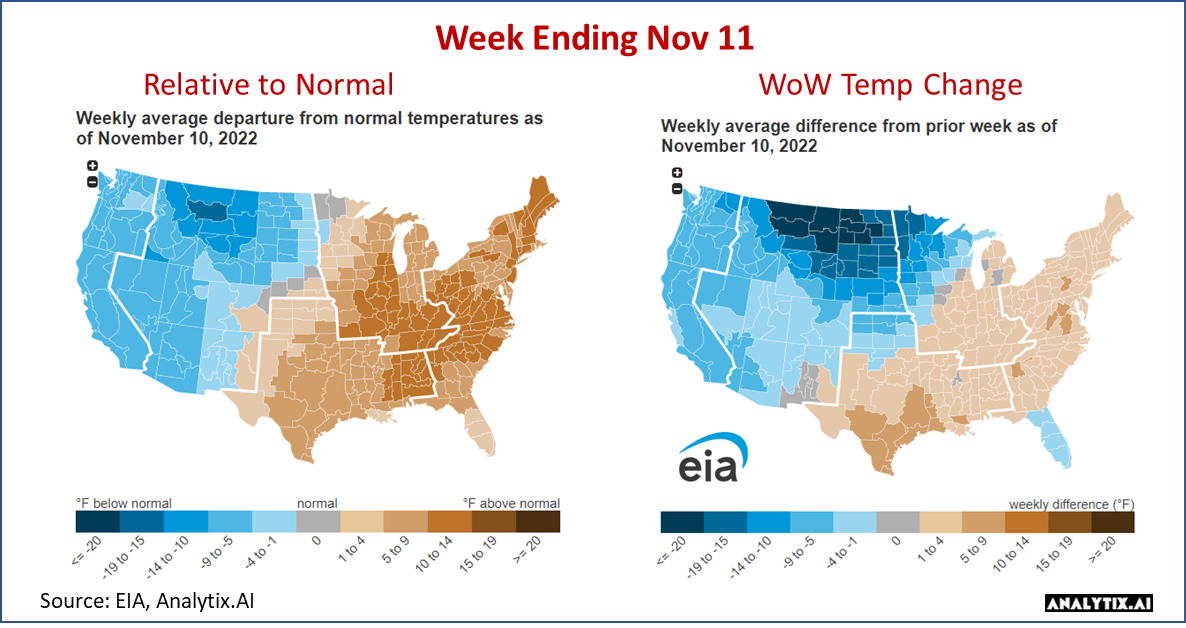
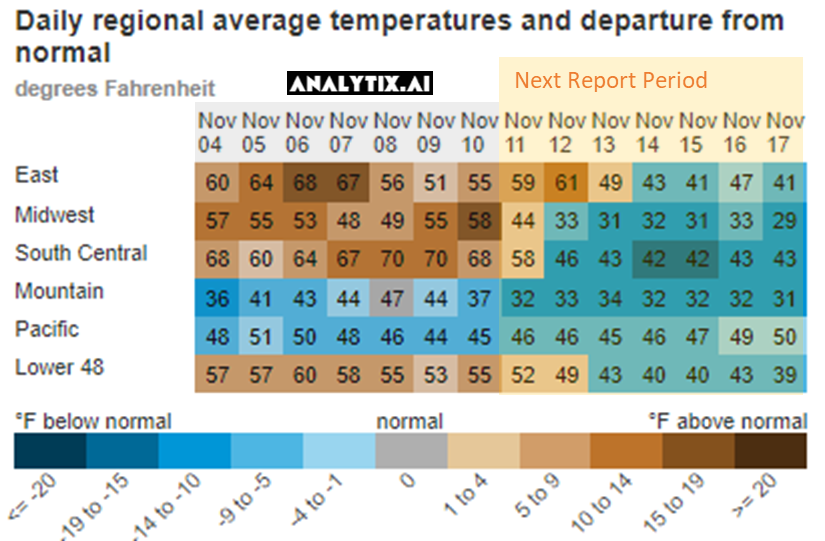
- National temps were mixed week-on-week. The Midwest, East, and SC all warmed from the previous week, but the Mountain and Pacific zone cooled significantly. Overall the two sides of the country canceled each other out. At the national level, our HDDs increased by 0.3F which translated into no real change in RC demand week-on-week. Here is a view of the temps by EIA region.
- Power burns were off this past week with wind generation rising well above seasonal expected levels. Below are the average MWh by generation type for the past 12 storage weeks
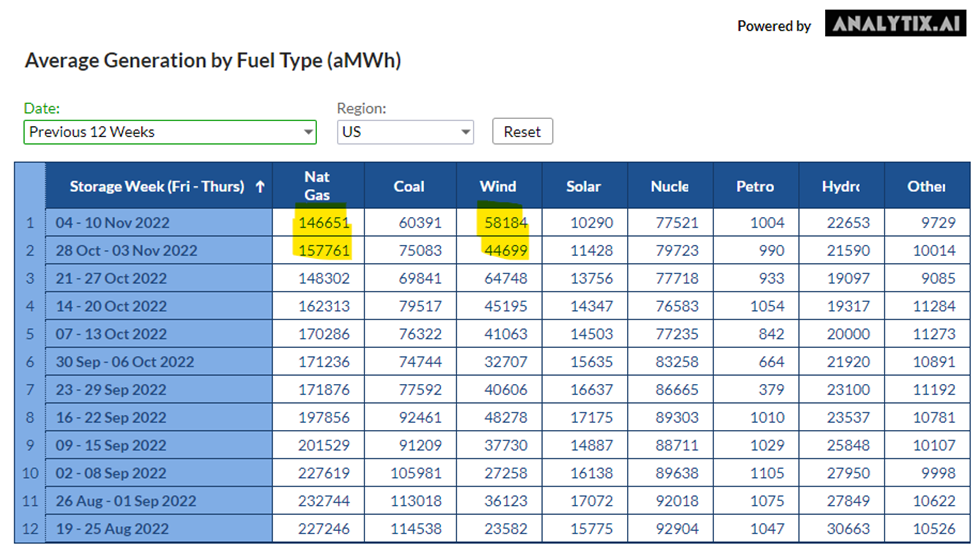
Source: http://www.analytix.ai/generation-by-fuel-type.html
- LNG volumes were lower by 0.5 Bcf/d with Sabine Pass having lower feedgas levels due to continued operational volatility following the 4-day pipeline maintenance on NGPL at the beginning of the month. That being said, we see Sabine ramping up to levels above 5 Bcf/d.
Our estimate for week ending Nov 18th is -79 Bcf. This reporting period will take L48 storage level to 3,565 Bcf (-61 vs LY, -38 vs. 5Yr). Last year we drew -14 Bcf during the same week. The cold blast we had this past week quickly turned the injections into draws.
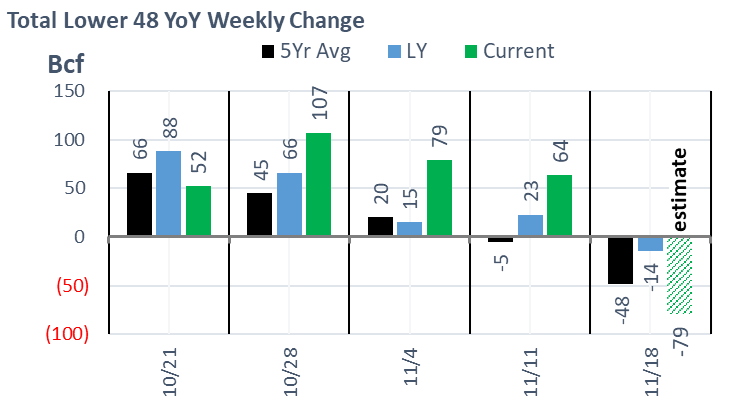
Here is the full fundamental picture compared to last week and the same week last year. As can be seen, the higher demand associated with the jump in HDDs across the country was the lead factor to the heavy storage draws.
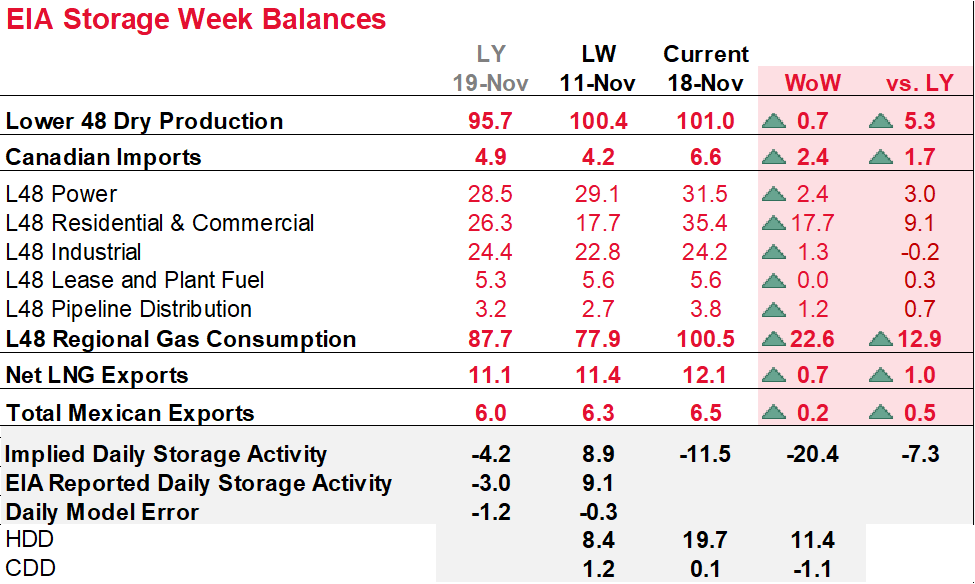
Production: Domestic production was higher week-on-week with the Northeast providing the biggest change. The cooler temps in the region look to be incenting NE producers to open up the well valves.
RC Consumption: The cooler temps double RC demand from the low levels seen the previous week. With HDDs jumping by 11.4 F at the national level, we saw total natural gas rescomm consumption averaging 35.4 Bcf/d or +17.7 WoW. See the heat chart below to show just how quickly temps flipped across most of the country.
See the 6-10 and 8-14 day forecast here: https://www.analytix.ai/noaa-cpc-outlook.html
Power Burns: Power burns rose this past week with wind generation falling below expected normal levels. Below are views of the ERCOT and SWPP over the past couple of weeks. As seen, natgas is the backstop for wind. This past week as wind came off, we see natgas gen rise to meet the total load.
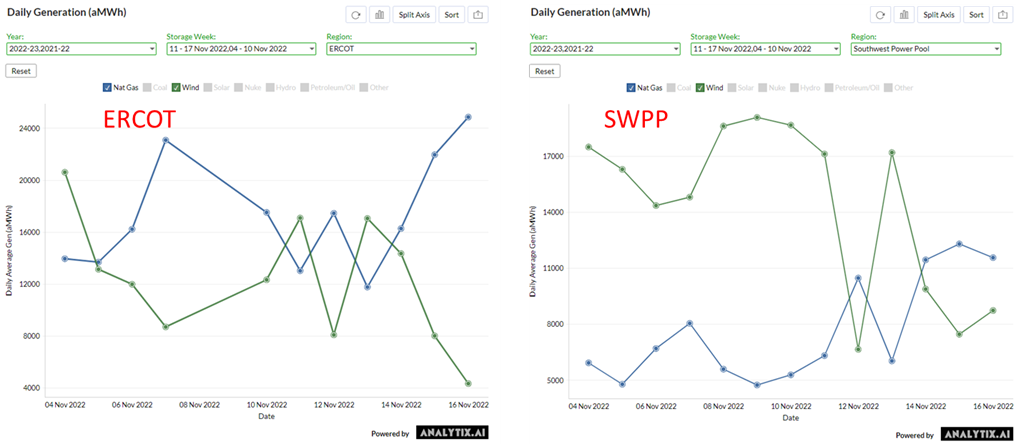
Source: http://www.analytix.ai/generation-by-fuel-type.html
LNG: LNG is stronger this week with Sabine starting to scale higher. There were a few days when Sabine received over 5 Bcf/d. The peak Sabine feedgas level is 5.2 Bcf/d. Overall we expect LNG volumes to hang around the 12 Bcf/d mark with cooler temps and no Freeport.
This email, any information contained herein and any files transmitted with it (collectively, the Material) are the sole property of OTC Global Holdings LP and its affiliates (OTCGH); are confidential, may be legally privileged and are intended solely for the use of the individual or entity to whom they are addressed. Unauthorized disclosure, copying or distribution of the Material, is strictly prohibited and the recipient shall not redistribute the Material in any form to a third party. Please notify the sender immediately by email if you have received this email by mistake, delete this email from your system and destroy any hard copies. OTCGH waives no privilege or confidentiality due to any mistaken transmission of this email.