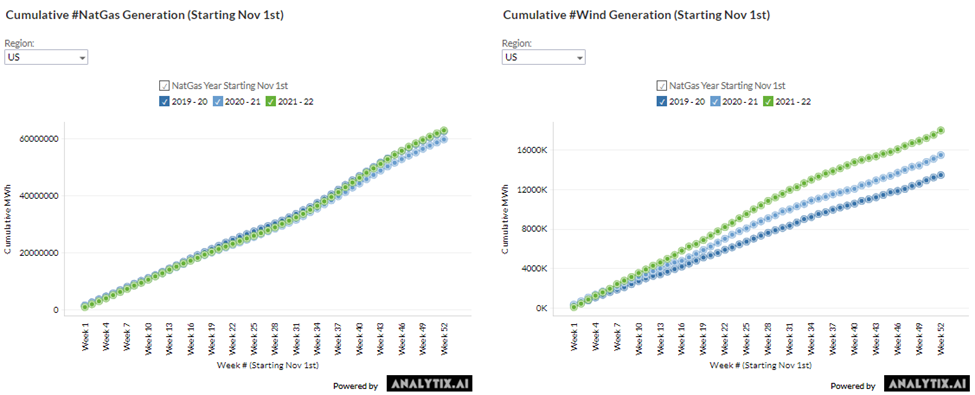
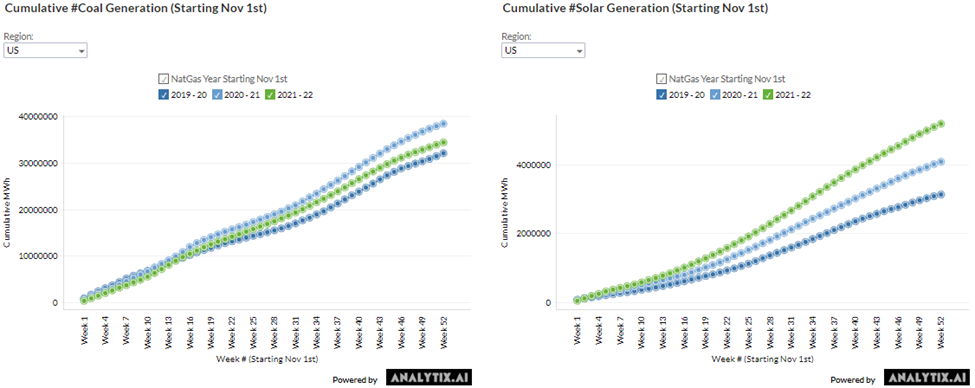
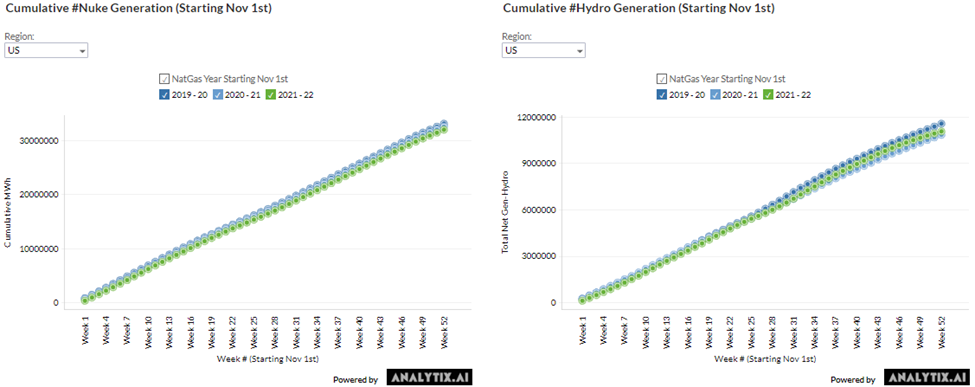
This week we start with a few charts on generation performances over the last year. The power mix story has been an important one, especially with natural gas generation being the balancing factor in almost all power jurisdictions.
With changes in total power demand increasing by only 1.5% over the last 12 months, it’s very interesting to see how each generation type changed. The net change to natural gas generation was minimal, with the increased wind and solar helping offset the big drop in coal generation.
YoY % change in Gen from Nov to Nov
- Wind +16% YoY
- Solar + 27% YoY
- NatGas +0.5%
- Hydro +2%
- Coal -10.4%
- Nuke -1.8%
All the charts below can be viewed by power region here: http://www.analytix.ai/cumulative-generation-by-type.html
NatGas Storage Fundamentals:
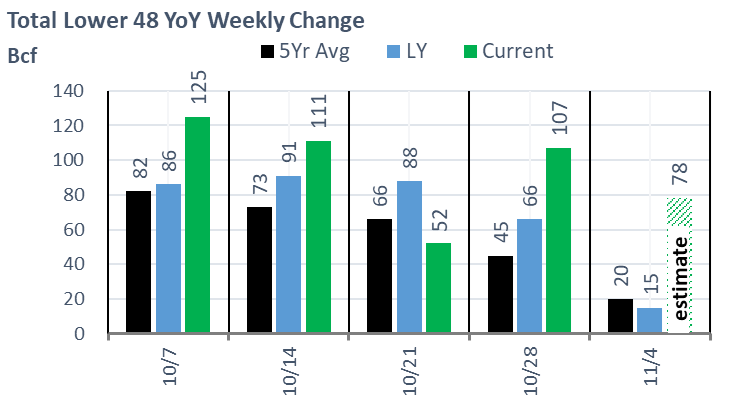
The EIA reported a +107 Bcf injection for the week ending Oct 28th, which came in higher than market expectations of ~100-102 and our estimate of +98. This storage report takes the total level to 3501 Bcf, which is 101 Bcf less than last year at this time and 135 Bcf below the five-year average of 3,636 Bcf. This is the 6th triple-digit build in Q4.
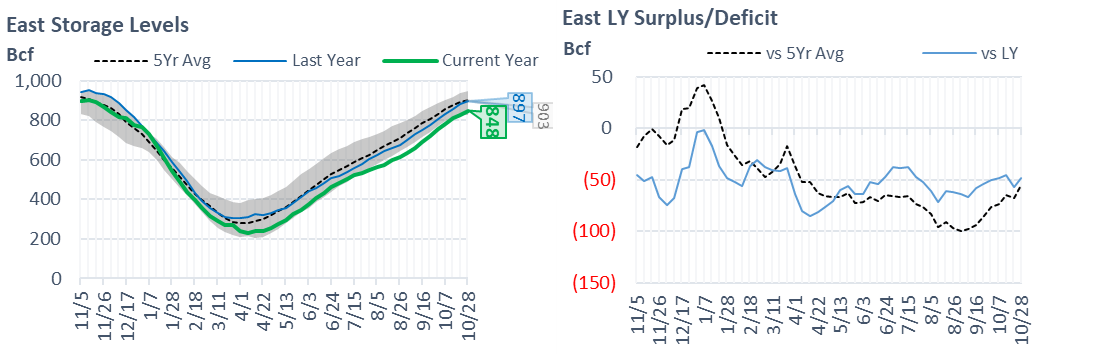
The East is the one storage area that did not build sufficient inventories relative to past years. The East storage level finished last week with 848 Bcf in the ground, which is 49 less than LY.
Our fundamental storage model underestimated injections for the reporting period by almost 1.5 Bcf/d. Here are the details we gather from the fundamentals:
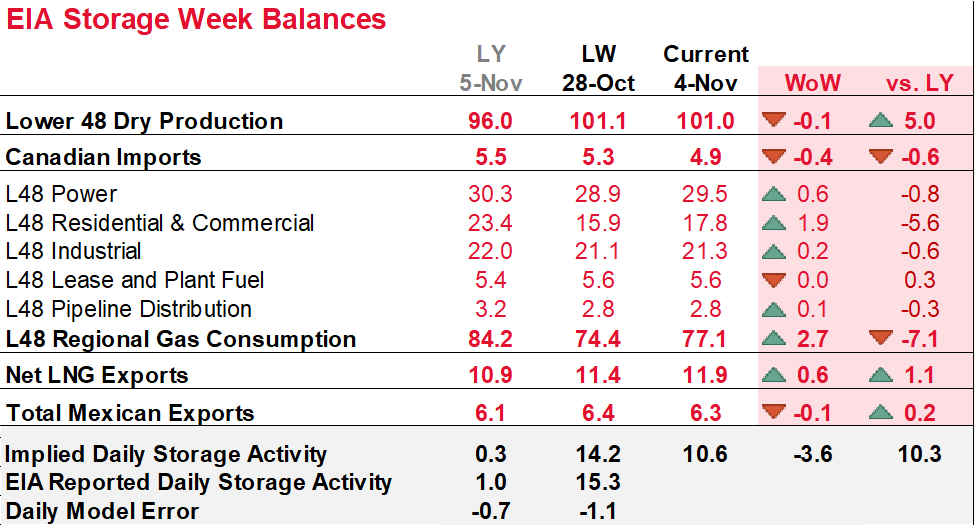
- Total domestic production grew by 0.7 Bcf/d week-on-week. The growth in Midcon and Northeast production zones were the two standout regions.
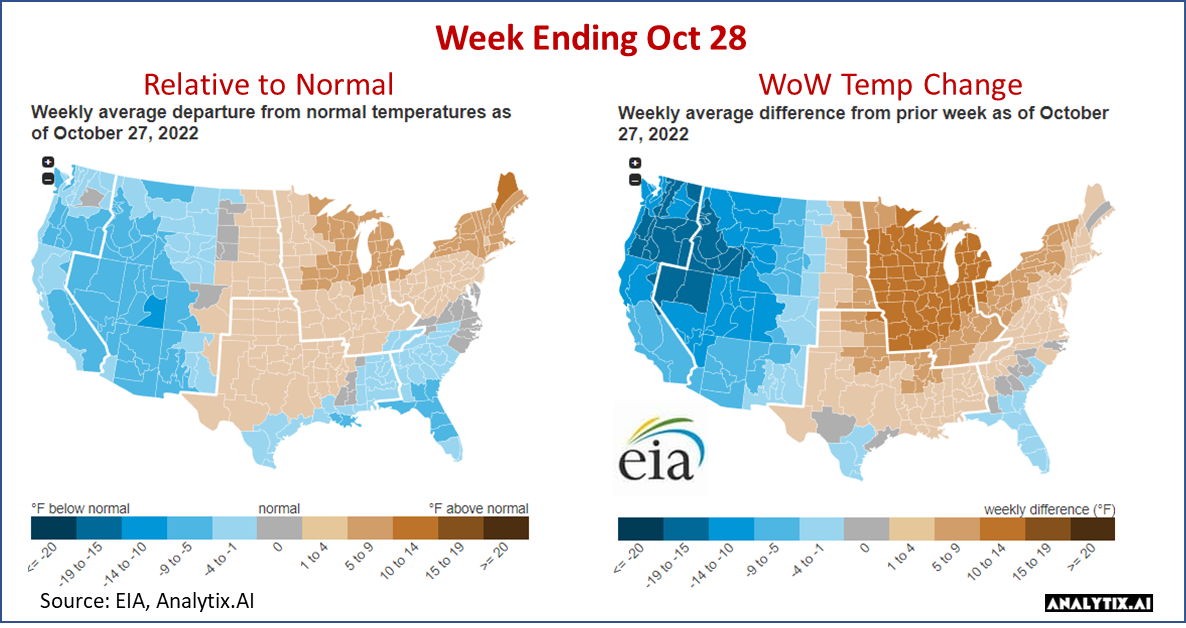
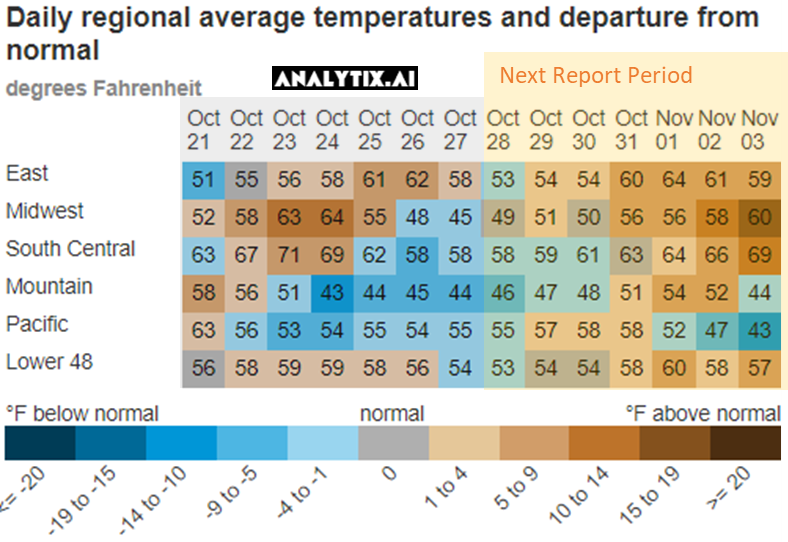
- Cooling at the national level took a pause this past week, with the East and Midwest finishing warmer than normal. At the national level, we saw HDDs drop by 2.7F which translated into -5.0 Bcf/d of RC demand. Here is a view of the temps by EIA region.
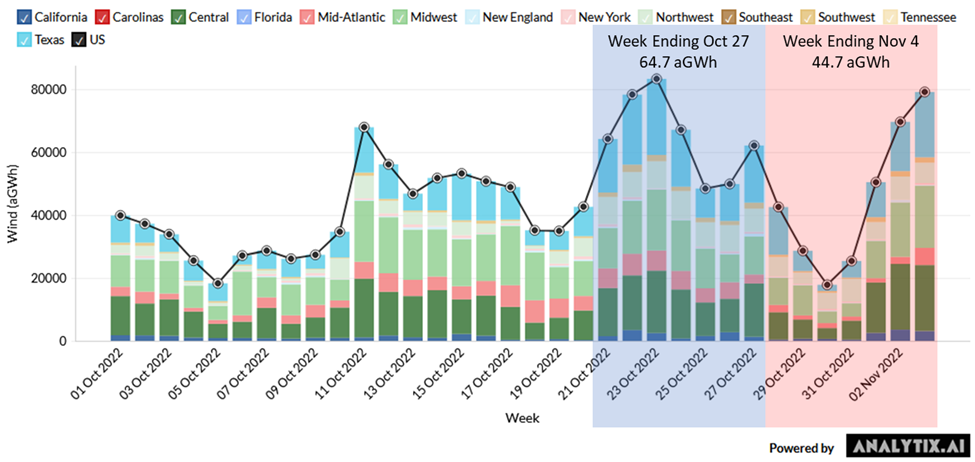
- With CDDs fading away, so is power loads. The power load dropped by 1.7%, but the real story was the monstrous #wind levels. Wind jumped by 43% week-on-week to an average of 64.7 aGWh. This exception wind level drop nat gas generation lower by 14.4 aGWh leading to 2+ Bcf/d of lower power burns.
Click here to see the last 4 years of daily history: http://www.analytix.ai/wind-and-solar-generation.html
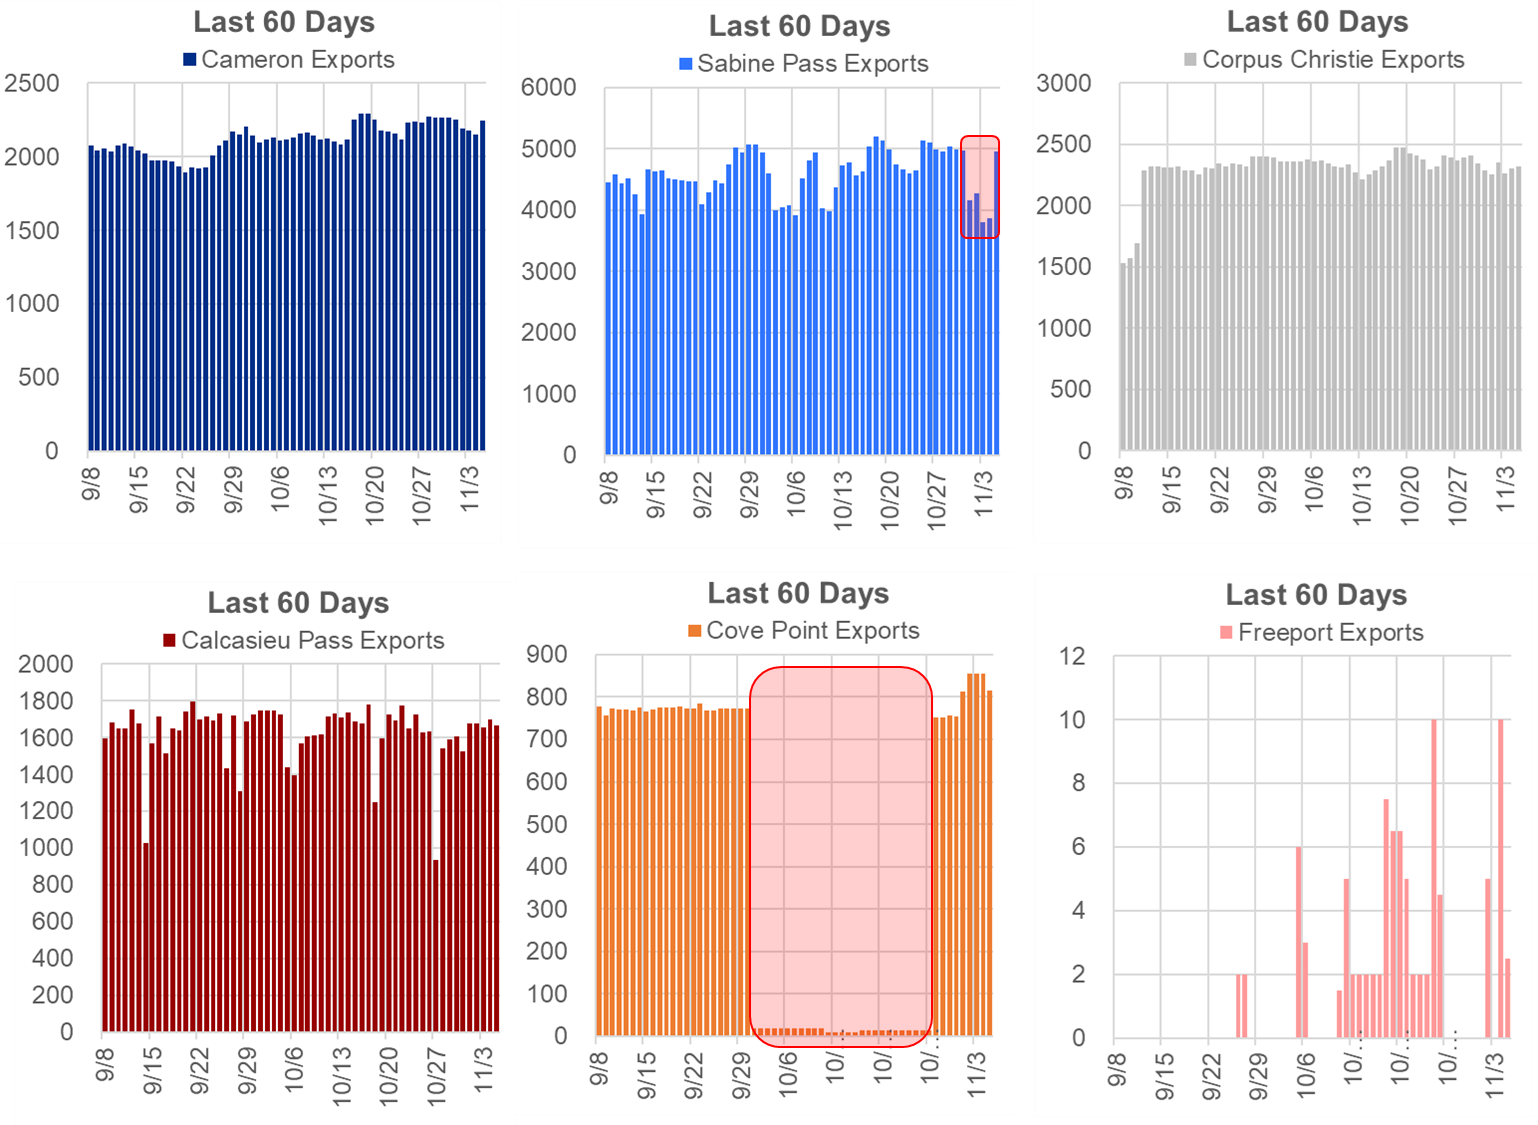
- LNG feedgas was flat week-on-week. Cove Point returned on Oct 29th, and its increased feedgas level will show up in next week’s report.
Our estimate for week ending Nov 4th is +78 Bcf. This reporting period will take L48 storage level to 3,579 Bcf (-38 vs LY, -77 vs. 5Yr). Last year we injected only +15 Bcf during the same week. With injection expected til mid-Nov, it looks like we will get to a surplus to LY.
Here is the full fundamental picture compared to last week and the same week last year. As can be seen, the higher demand associated with increasing HDDs and the return of Cover Point was the lead factors to a lower storage injection week-on-week.
Production: Domestic production was relatively flat from each major region week-on-week, except for the Northeast. The Northeast continues to suffer from a lack of drilling activity and an all-time low level of DUCs to rely on. Current rig counts in the Northeast sit at 106, which is 32 higher than where we were last year. The total count is relatively lower compared to other oil and gas shale regions that have seen a massive rig count boost YoY.
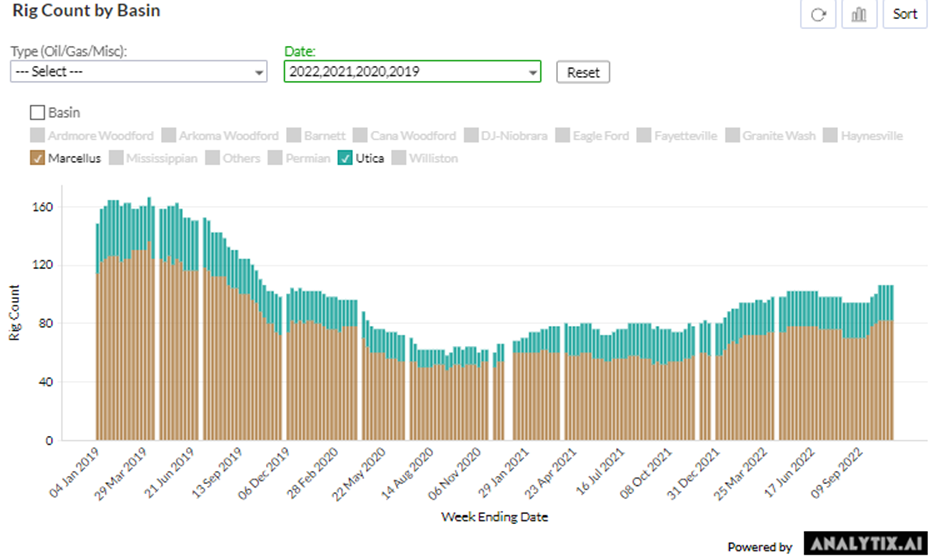
Source: http://www.analytix.ai/rig-counts.html
RC Consumption: At the national level, we saw HDDs pick up by 1.4F which translated into an additional 1.9 Bcf/d of RC demand. Even with seasonal HDDs picking up, most of the country experienced above normal temps that are helping push more has into storage.
Power Burns: Power burns increased this week, with wind and solar generation pulling back. Below are the average MWh by generation type for the past 12 storage weeks.
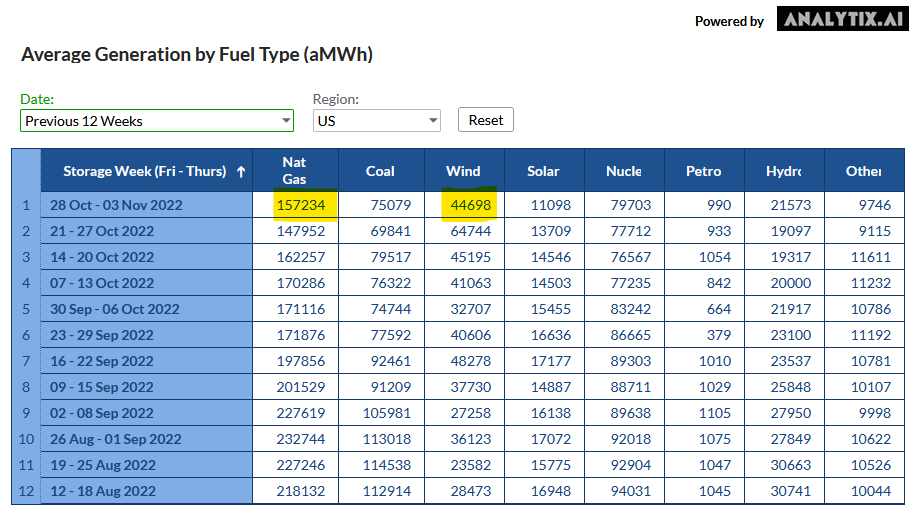
Source: http://www.analytix.ai/generation-by-fuel-type.html
LNG: LNG volumes were higher by 0.6 Bcf/d with the return of Cove Point from 4-week annual maintenance. LNG volumes would have been higher, but 4-day pipeline maintenance on NGPL reduced feedgas levels to Sabine. This has been resolved as of yesterday.
This email, any information contained herein and any files transmitted with it (collectively, the Material) are the sole property of OTC Global Holdings LP and its affiliates (OTCGH); are confidential, may be legally privileged and are intended solely for the use of the individual or entity to whom they are addressed. Unauthorized disclosure, copying or distribution of the Material, is strictly prohibited and the recipient shall not redistribute the Material in any form to a third party. Please notify the sender immediately by email if you have received this email by mistake, delete this email from your system and destroy any hard copies. OTCGH waives no privilege or confidentiality due to any mistaken transmission of this email.