This week we start with how the “Hot/dry leads to more hot/dry”. The folks at AtmosphericG2 (formerly WSI) put some great content up on enelyst.
Here is a link to the full script from James Caron and Ed Vallee: https://chat.enelyst.com/enelyst/pl/zqnwtnczrb8o7mgdxfk4fe3k6o
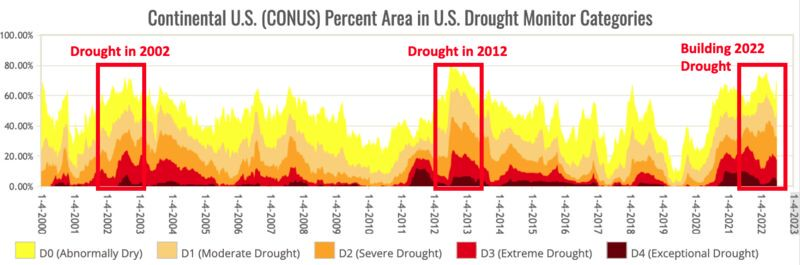
Summer 2022 being hotter and drier than normal for much of the USA seems unprecedented, but similar conditions tend to occur during the negative phase of the Pacific Decadal Oscillation (PDO). In fact, summers of 2002 and 2012 were both anomalously hotter AND drier than normal across most of the USA under similar negative PDO phase when comparing to summer of 2022.
Summers of 2002 and 2012 were plagued by widespread drought conditions. As summers 2002 and 2012 progressed drought conditions worsened.
A positive feedback loop is likely setting up in 2022 where heat is feeding off of drought and vice versa.
…given the ongoing issues with dryness and heat, Dr. Crawford has found significant correlation between JUL and AUG CDD. With this, our Aug CDD forecast is at 359 with upside risk….that is good enough for top 10 hottest on record…
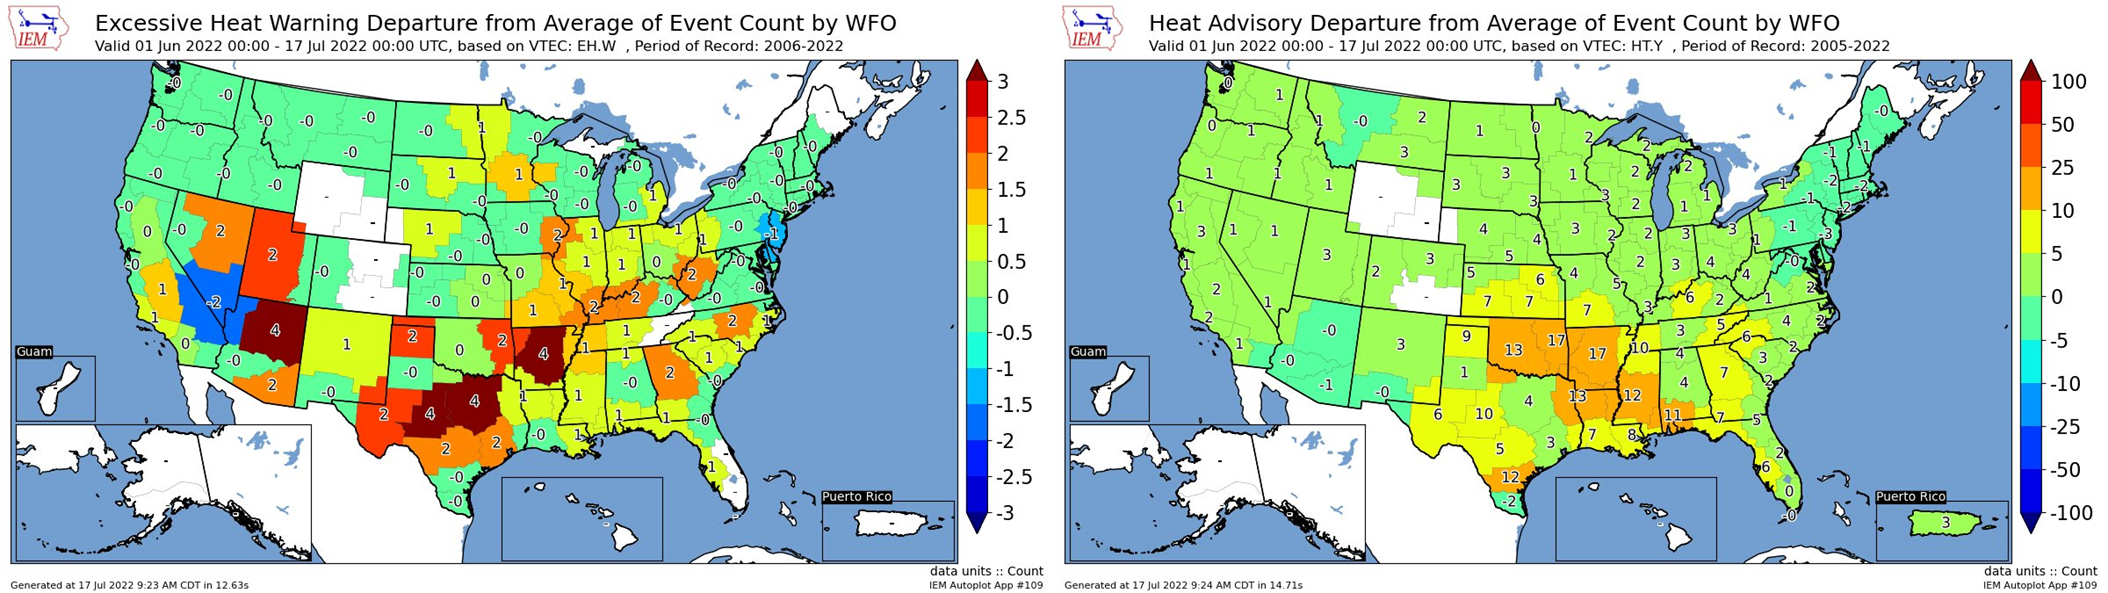
Continuing on with good weather intel, the National Weather Services Prediction Center put a great series of tweets earlier this week. The premises of the tweets also revolve around the intense heat that we have observed in the Southern Plains.
It is no secret that the Southern Plains have been anomalously hot during the first half of summer, with sustained heat and lack of precipitation leading to significantly more Excessive Heat Warning and Heat Advisory product issuances than average.
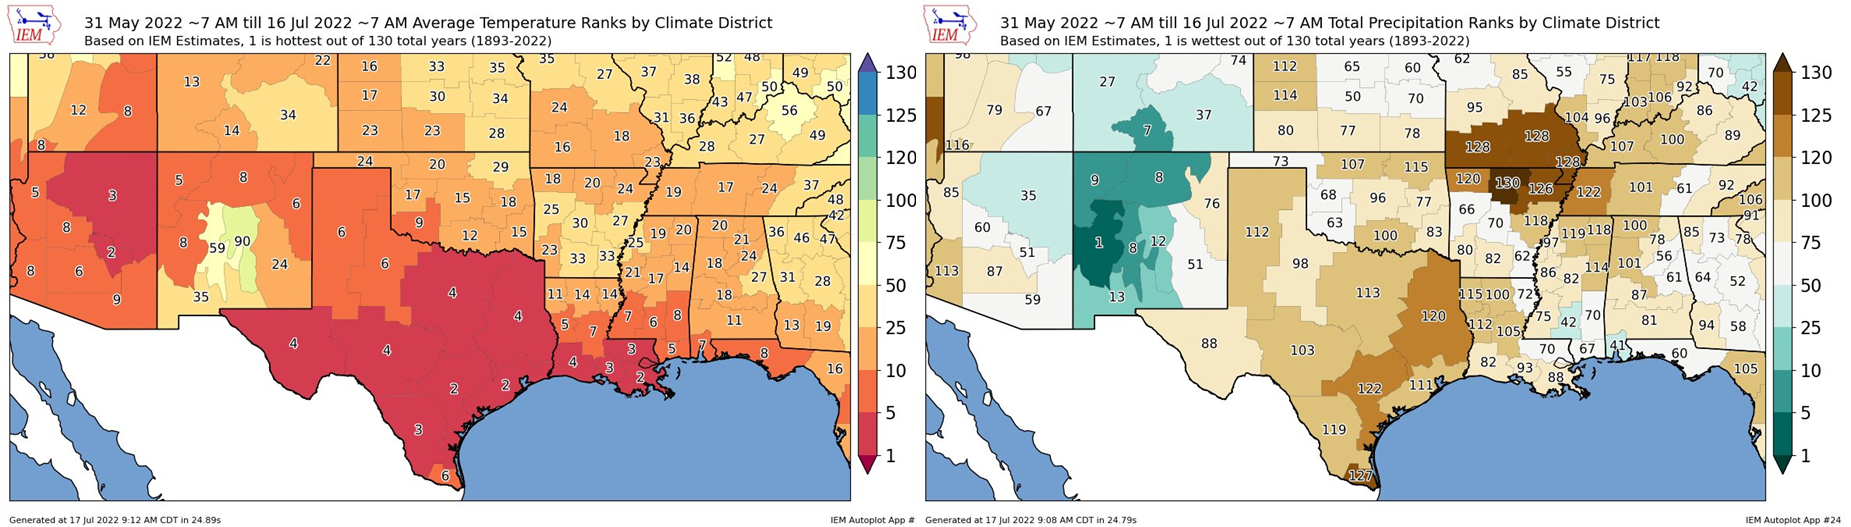
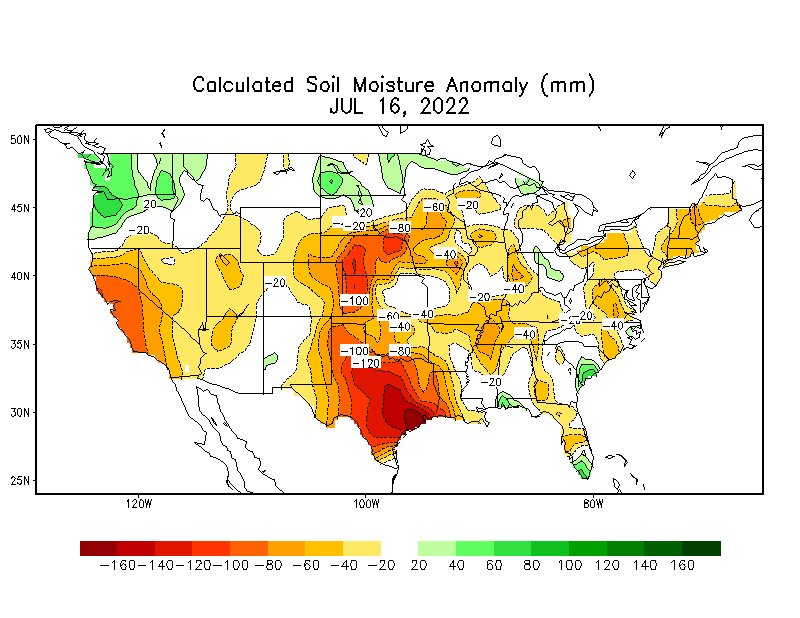
To put the current heat and dry conditions in perspective, much of the Southern Plains have experienced a top 15 driest AND hottest Jun 1 – Jul 16 period since 1893, leading to widespread drought and well-below average soil moisture values across the region.
Unfortunately for this region, these prolonged conditions exacerbate the heat situation, as drier air leads to less evaporative cooling & a drier ground cannot absorb as much radiative heat from the sun causing the surface to heat up faster and reach higher temperatures.
So what is causing this? We are currently experiencing a La Nina ENSO phase, which supports an overall drier pattern for the Southern Plains due to upper-level ridging in the western CONUS. However, every La Nina year is not alike.
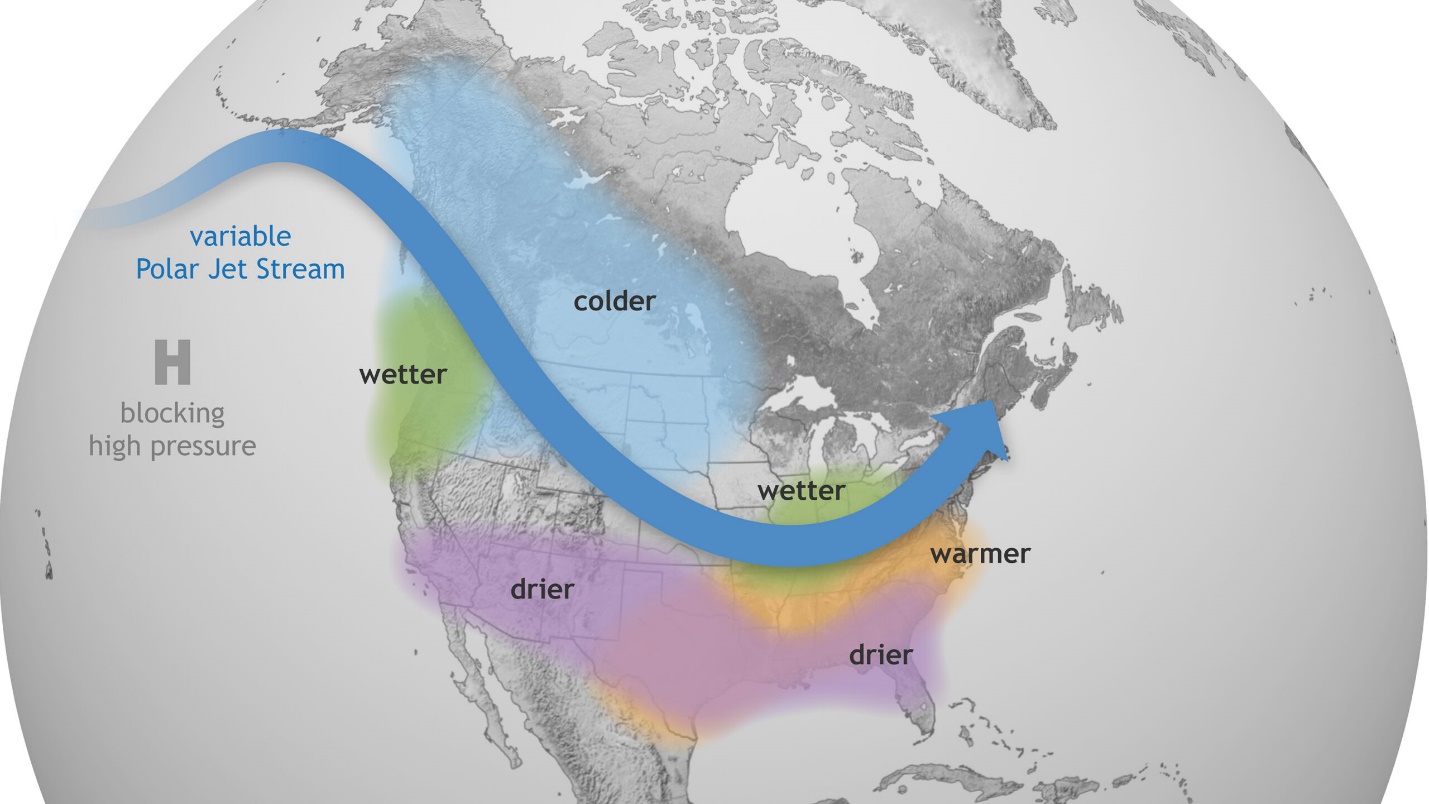
This summer, the upper-level pattern since June 1 has produced prolonged ridging more focused in the central U.S., leading the Jet Stream to remain far north of the region and subsequently much of the precipitation.
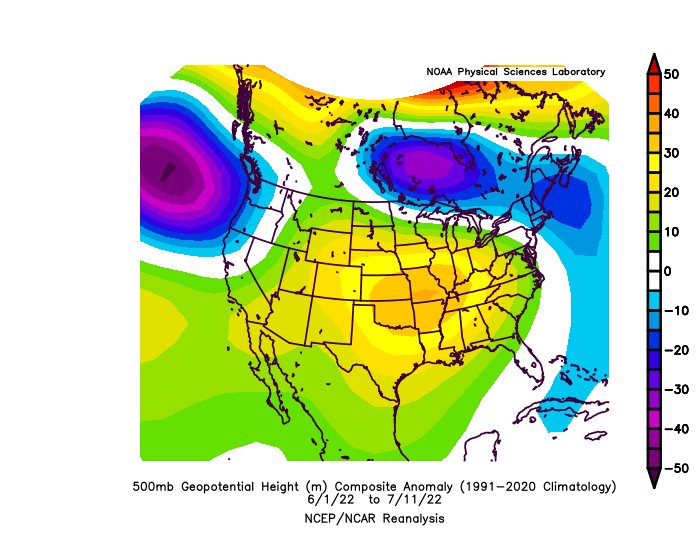
This pattern leads to a “heat dome” where higher pressure in the upper levels of the atmosphere promotes sinking air, stifling convection & trapping heat at the surface. This “dome” has barely budged this summer, causing sustained heat and dry conditions in the region.
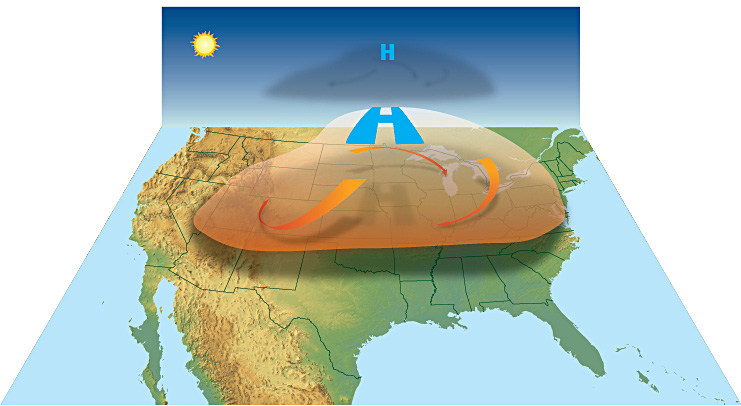
Unfortunately, for those in the Southern Plains, @NWS continues to forecast sustained above-average temperatures and below-average precipitation through the end of the summer, and while there may be relief at times, the overall pattern favors continued anomalous warmth.
[Note: We switched the graphic from their tweet to the latest NOAA CPC outlook released on July 21]
Bookmark this link: https://www.cpc.ncep.noaa.gov/products/predictions/multi_season/13_seasonal_outlooks/color/page2.gif
NatGas Storage Fundamentals:
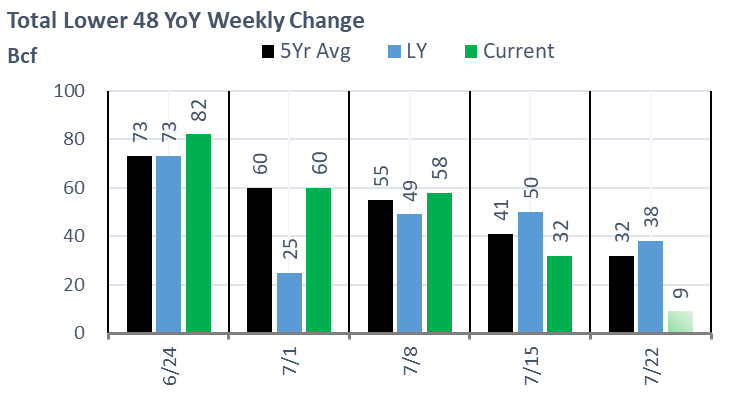
The EIA reported a +32 Bcf injection for the week ending July 15th, which came in much lower than the market consensus and our final estimate of +43. This number caught most of the market off guard, as most were expecting a low-40s build. Our flow model has typically done quite well, but even that missed by 10 Bcf. So after a very loose number, the market flips to an extremely tight number that took bal summer and the winter strip much higher.
This storage report takes the total level to 2401 Bcf, which is 270 Bcf less than last year at this time and 328 Bcf below the five-year average of 2,729 Bcf.
The weather looked to play a key role in this report. The low injection week-on-week comes despite average temps being in the same ballpark as the previous week. The difference this week
1) not a major holiday week
2) Wind averaged 34 GWh, which was lower by 8.4 GWh WoW. This effectively resulted in 1.5 Bcf/d of stronger burns.
3) more intense heat in key pockets leading to higher power loads, and potentially lower production (gathering system compressors could be impacted heat even though equipment in the South is designed to handle high levels of heat)
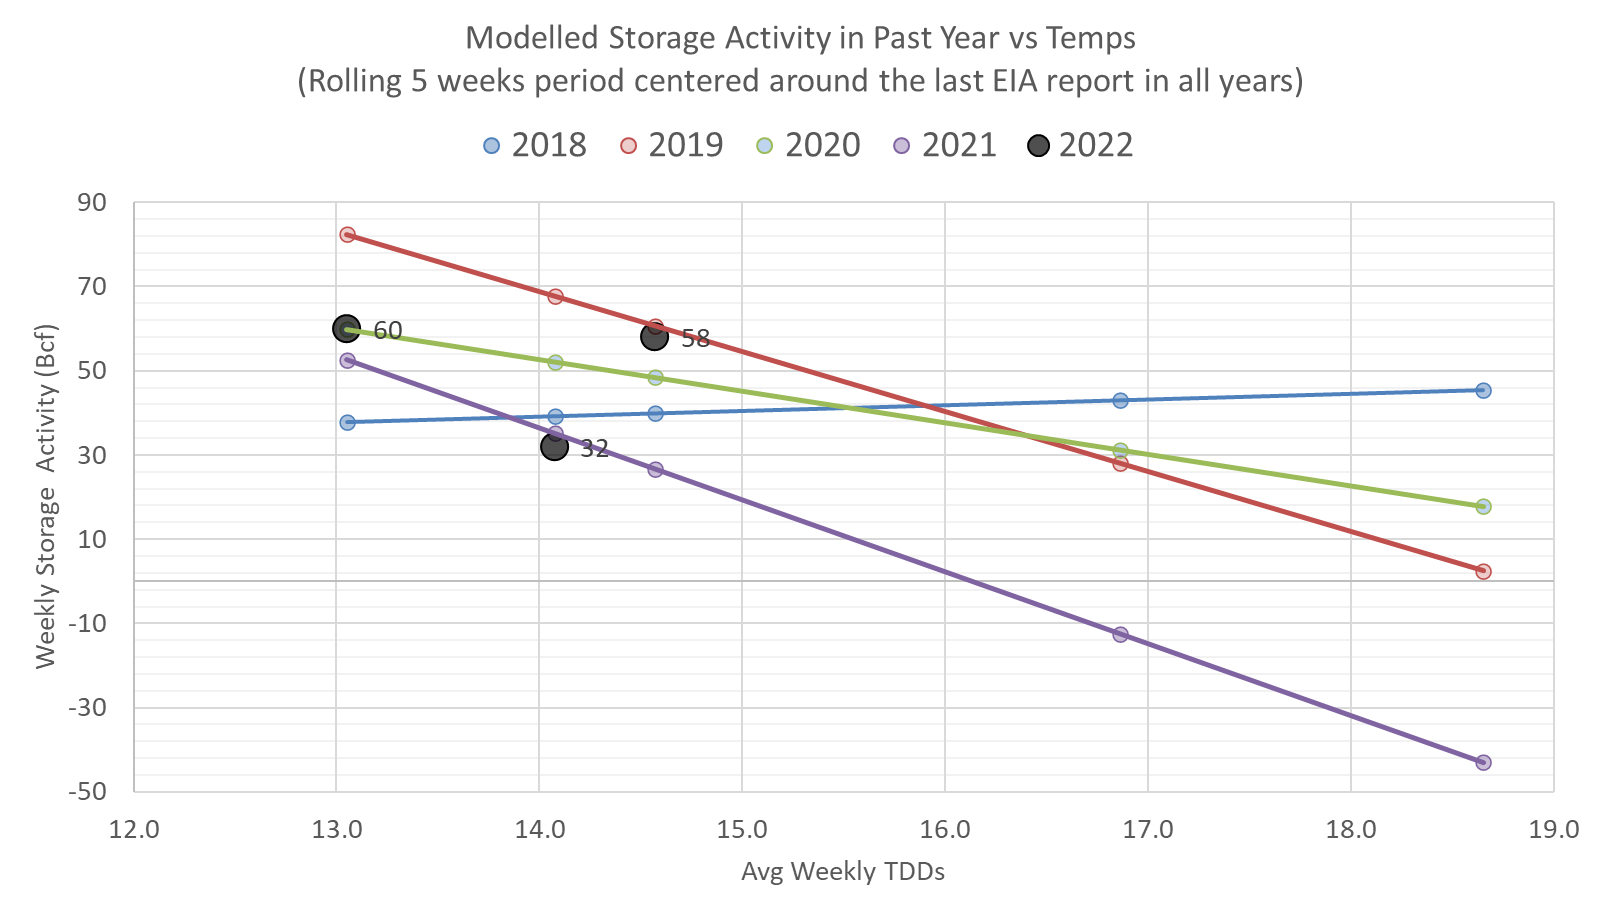
Overall, we see this +32 Bcf injection being -0.4 Bcf/d tight vs the historical rolling 5-week period (wx adjusted). The chart below builds in a rolling 5-week regression centered around the last EIA report – week #29 or week ending July 15th. The lines for 2018-2021 essentially show the resulting injection in those years (during week 26 through 30) if they experienced the same temps as this current summer (historicals + the 15-day forecast).
So the -0.4 Bcf/d tight number is even more remarkable given that Freeport outage. If Freeport were available, this report would have been approximately ~1.4 Bcf/d tighter. [This considers that the Freeport outage has led to (slightly) lower prices and higher power burns, therefore providing additional demand that might not have been there otherwise].
This report alone should not be used to calculate the trajectory to the end of season. The tight nature of this report would take down end of season estimates drastically by ~150 Bcf. We will wait for the next 2 reports to make any bold calls.
For the week ending July 22th, our early view is +15 Bcf. This reporting period will take L48 storage level to 2,415 Bcf (-294 vs LY, -346 vs. 5Yr). This upcoming report once again does not help reduce the deficit vs last year. Last year we injected +38 Bcf during the same week.
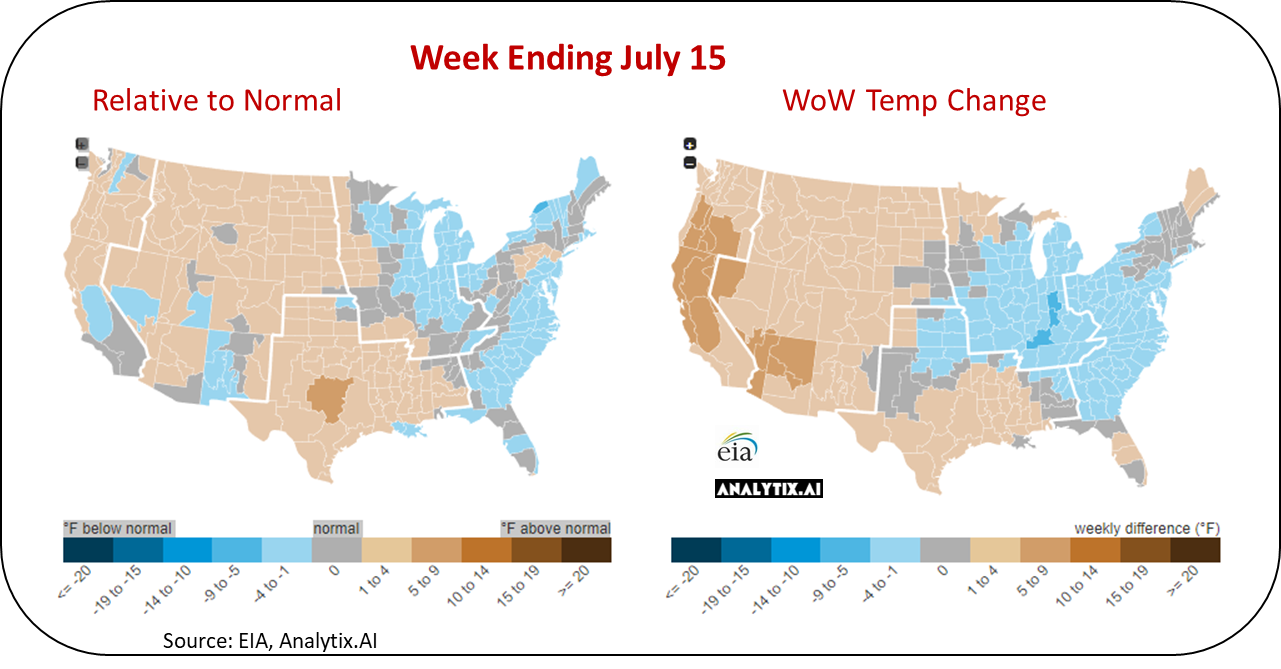
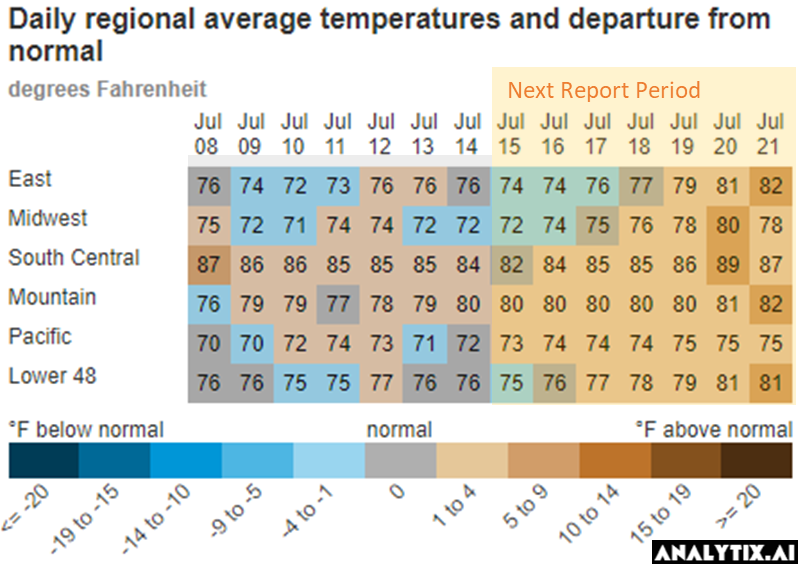
During the past week, most regions trended above normal. This seems to be the Summer 2022 theme. The net result was the L48 population wt. CDDs were on 2.1F higher versus the previous week.
With the loss of the EIA 930 data, we have been a bit blind to the impact of wind generation over the past few weeks. [I have heard from someone at the EIA that we should received partial recovery of the data set next week.] This week we once again pull data from Genscape this week to fill in some gaps and give a better understanding of the impact of wind on this upcoming storage number. Below is the average daily wind gen performance over the last 6 storage weeks. Fortunately wind was stronger by 7.5 GWh after 6 straight weekly declines. This helped relieve gas burns.
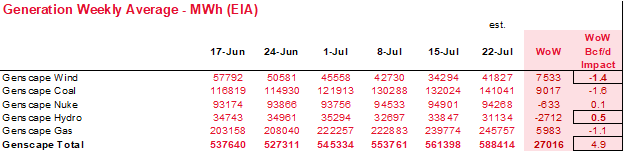
source: Genscape
Overall, the weather changes resulted in power burns averaging 45.4 Bcf/d over the week and a new peak level of 48.4 Bcf/d on July 20th. The modelled gas burns from the flow data points to burns being were higher by 2.6 Bcf/d.
Domestic dry gas production was slightly higher week-on-week with the rise coming mainly from the Permian, East Texas, and App basins. We believe the intense heat has been leading to lower utilization of gathering pipeline compressors, and ultimately lower production levels. With the slight pause in heat over the weekend, we saw production reach the highs last seen in Dec 2021. This past week averaged 97.2 Bcf/d, or higher by 0.9 Bcf/d.
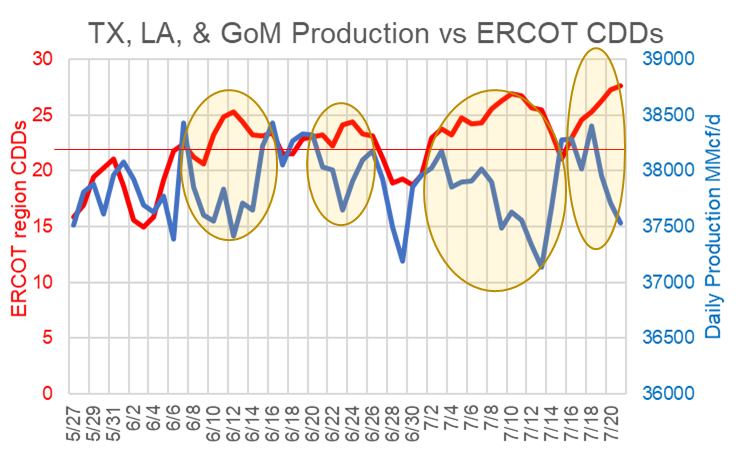
Here are some charts that prove out the heat/production story. I charted Daily SC production with ERCOT CDDs. This exercise can definitely be done more accurately with basin-level production and more localized temps. That being said, the relationship is pretty clear.
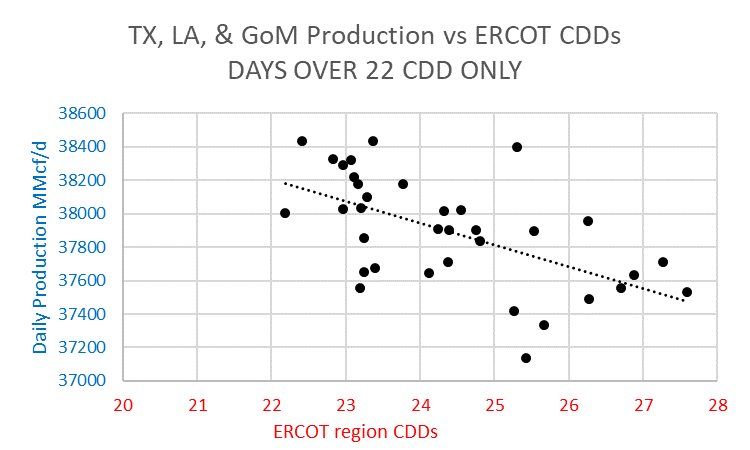
If we take just the days that crossed an average of 22 CCDs and plot that against daily production, then we see the relationship with each CDD over 22 results in an average drop of 0.15 Bcf/d of production for the entire region.
So with all the heat still expected to come, we could see production under pressure. The same phenomenon can very well play out in the Northeast. With all that said, the takeaway should be that s summer heat dissipates we could see production stabilize at or above 98 Bcf/d.
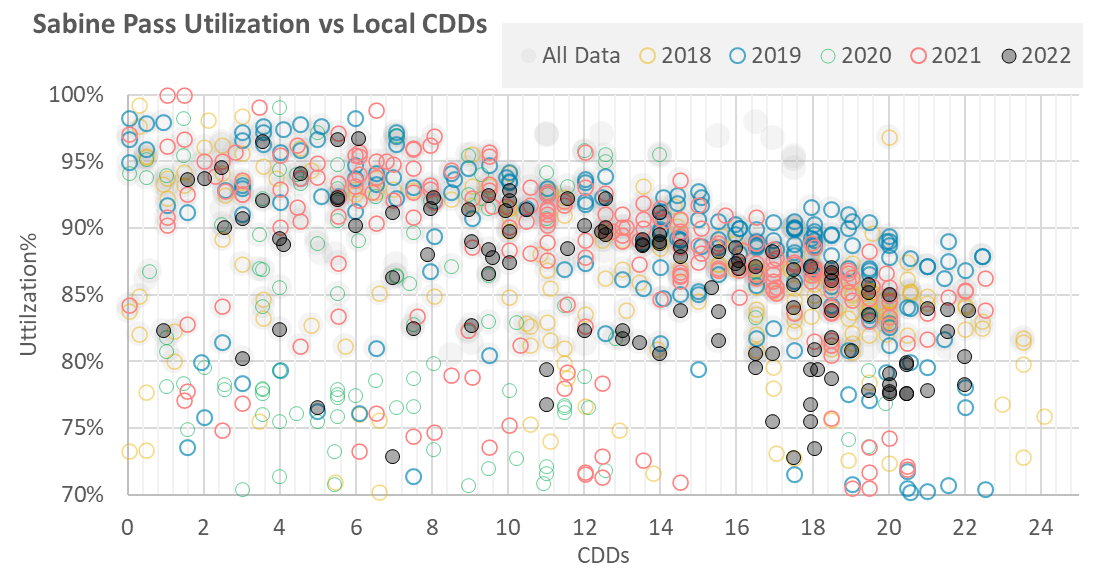
Deliveries to LNG facilities averaged 10.8 Bcf/d last week, which is 0.3 Bcf/d lower than the previous week. As with the production, LNG facilities are immensely impacted by extreme heat. Below is a chart we have shown before on how Sabine’s operation change as the heat increases. [Shoot me a note at het@analytix.ai, if you’d like to see a similar chart for all other LNG facilities.]
In other LNG news, Freeport LNG showed small receipts this past week. The company reported that it was flowing the gas into the facility to run a 50 MW gas-turbine generator that it is selling back to the power grid.
The net balance was -1.4 Bcf/d tighter week-on-week.
This email, any information contained herein and any files transmitted with it (collectively, the Material) are the sole property of OTC Global Holdings LP and its affiliates (OTCGH); are confidential, may be legally privileged and are intended solely for the use of the individual or entity to whom they are addressed. Unauthorized disclosure, copying or distribution of the Material, is strictly prohibited and the recipient shall not redistribute the Material in any form to a third party. Please notify the sender immediately by email if you have received this email by mistake, delete this email from your system and destroy any hard copies. OTCGH waives no privilege or confidentiality due to any mistaken transmission of this email.