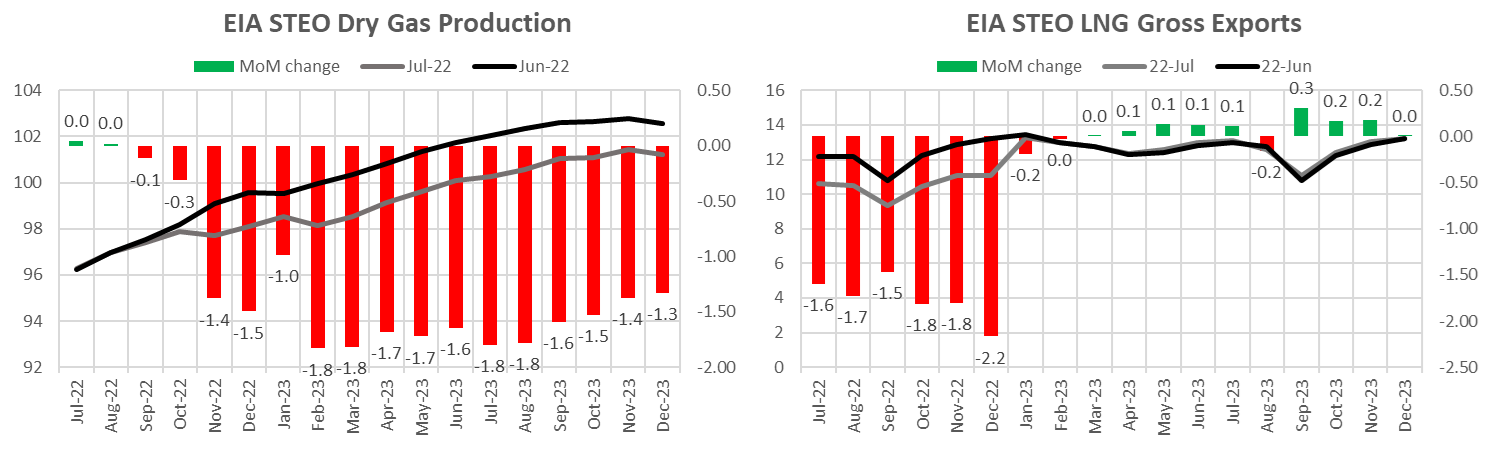
Let’s start with a glance at the EIA STEO. Although the STEO is not entirely accurate or important, it’s always good to see what the rest of the market has in front of them. As with most forward-looking balances, the STEO made big adjustments from July through December due to the Freeport outage. Here is a quick summary for H2 2022.
H2 2022
- Avg price $6.20 (-2.72)
- Dry Gas Prod 97.39 (-0.54) [Cal 23 is lower by 1.59 Bcf/d due to the price response]
- LNG export 10.49 (-1.76)
- Res/Comm 17.60 (+0.02)
- Ind 22.78 (+0.77)
- PB 33.93 (+0.19)
- End of Summer 3,468 (+129)
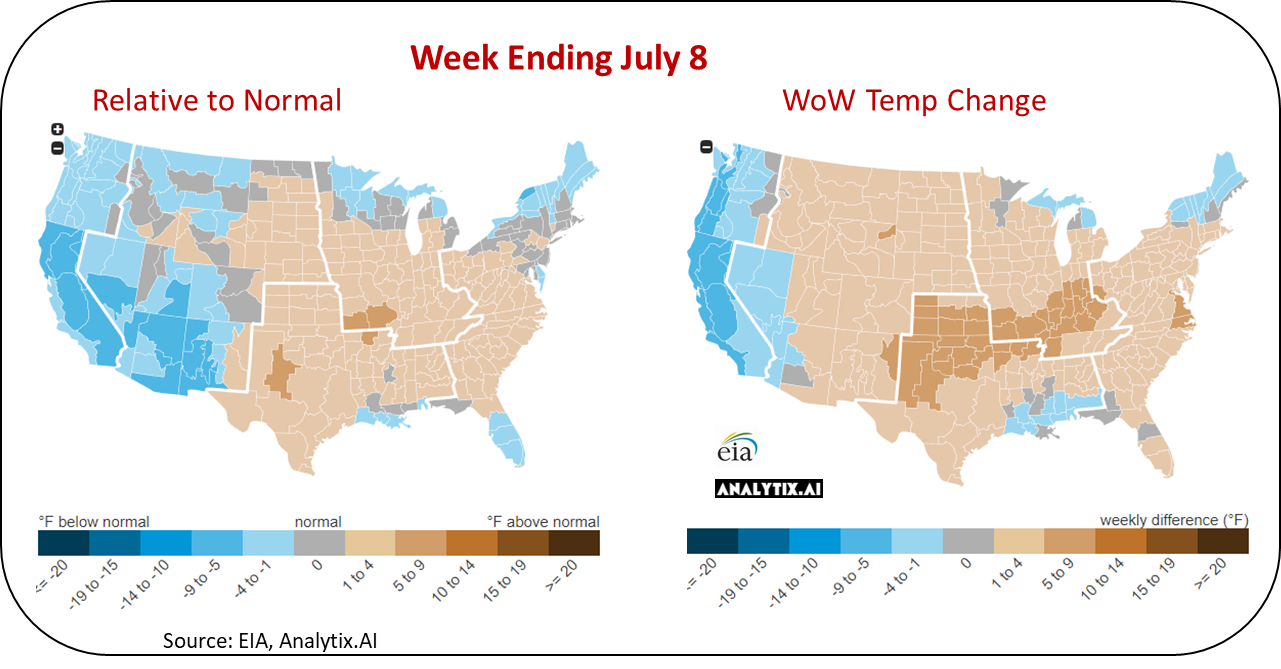
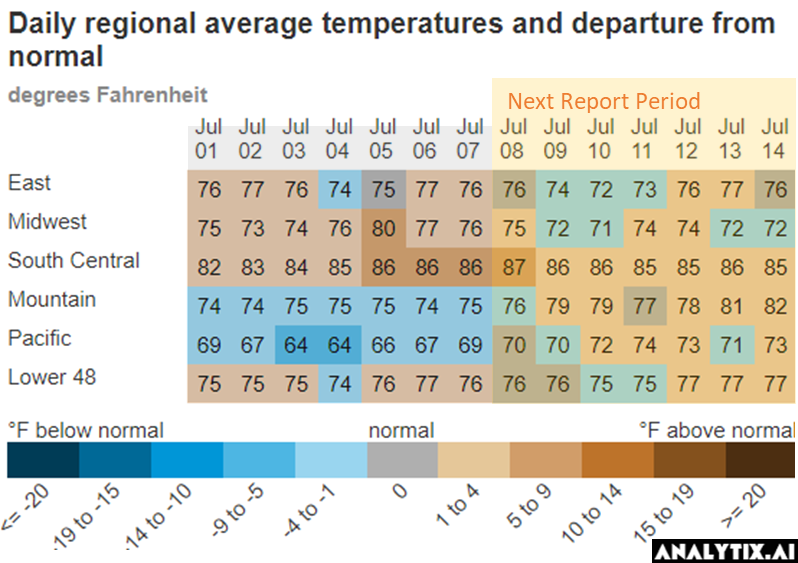
Let’s move on to the big heat complex that once again hit the south part of the country. July 8 through 13 were record-setting temps, where temperatures were above 100 degrees Fahrenheit in key cities across Texas. During all those days, except July 13, the ERCOT grid was stretched but operational. Below you can see how hot Texas temp looked relative to last year and normals. The cumulative CDDs this summer have outpaced the 10Y normal by 27%, and LY by 37%.
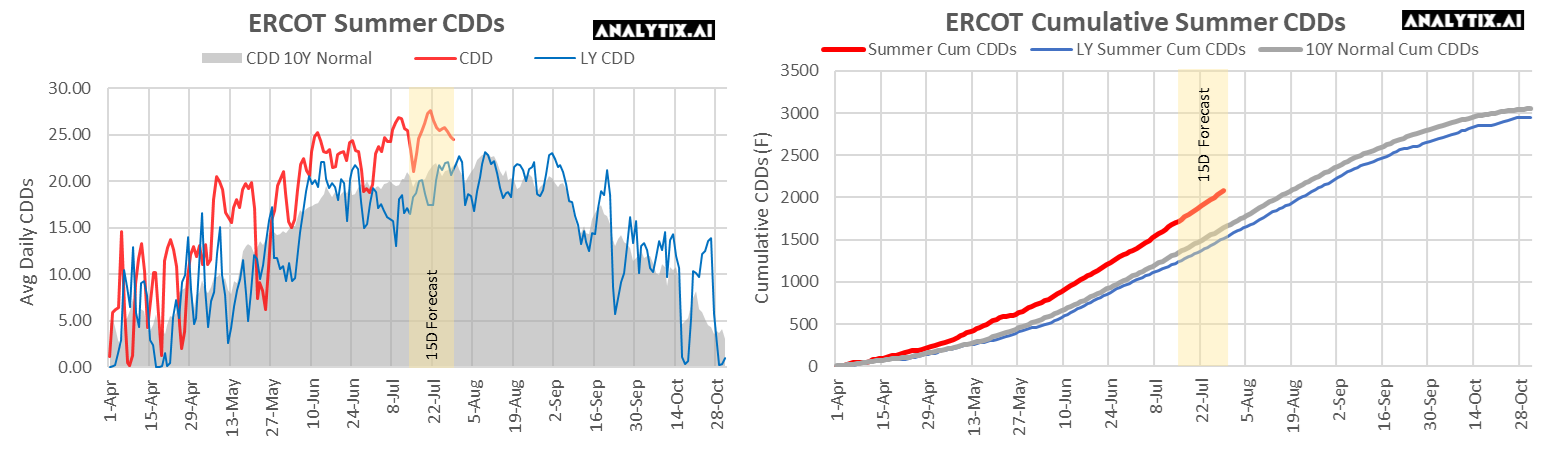
For July 13th, ERCOT took emergency measures as supply did not look adequate to keep up with soaring electricity demand. ERCOT blamed forced outages at coal and natural gas plants, cloud cover over West TX resulting in lower solar output, and low wind power generation – a perfect storm. ERCOT urged residents to cut power use during the hottest hours of the day to avoid rolling blackouts. It was the third time this year that ERCOT has called on residents to cut power usage and the second time it has warned of the potential for rolling blackouts. At the time of emergency notice to residents, ERCOT began paying suppliers almost $5,000/MWh to keep generators running. That price is the highest the grid operator pays.
We likely have another episode like this in the coming weeks. The current forecast for the region shows extreme levels of heat continuing over the 15-day forecast window; hence we are likely to hear more about record-breaking power demand.
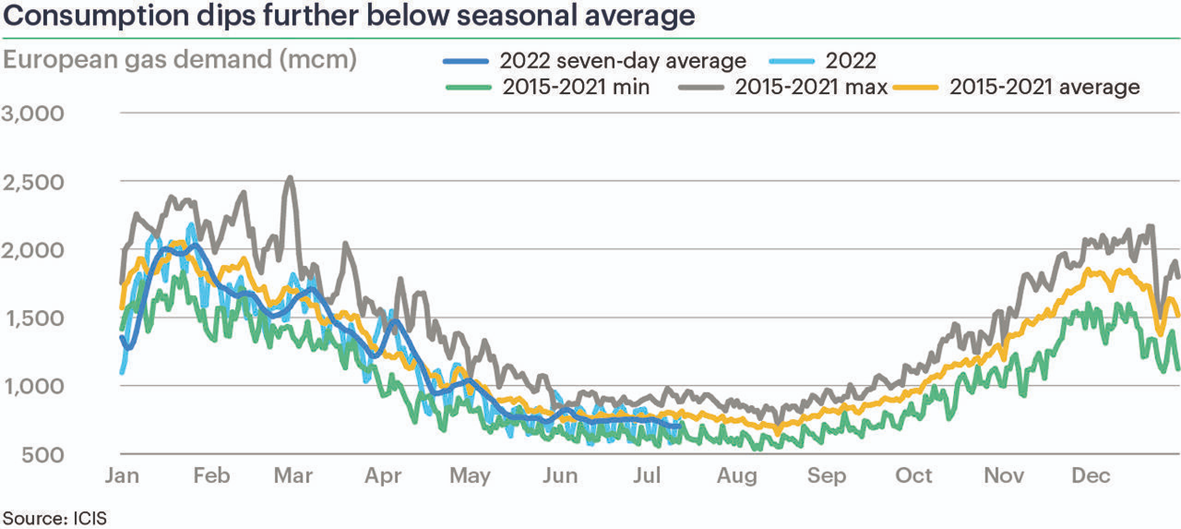
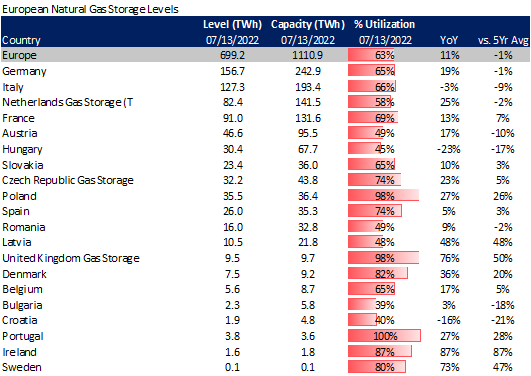
Across the pond, European customers are being asked to reduce their energy consumption as well. Not total due to soaring temperatures though, but more related to soaring prices. Data clearly shows that European natgas consumption has been lower this summer, with the latest July data coming in much lower than average. Summer-to-date (April up to now) demand is down 3.7% on average and down 15.3% on 2021. Here is a great chart from ICIS:
Germany is particularly in a tough spot and is racing to save gas after Russia cut supplies on Nord Stream pipeline (NS1) by more than half in late-June ahead of the typical July maintenance period. The pipeline is now down for its maintenance and Gazprom issued a statement claiming it will not have the proper documents to receive the equipment from the maintenance provider Siemens Canada. This conflicts with statements from the Canadian govt that they have made an exception in releasing the equipment despite the ongoing sanctions. Seems like Russia is using all excuses to stall.
Germany has encouraged industry and energy providers to save natural gas by offering incentives ahead of winter. German industrial+power output finally falling outside its normal range which is helping direct more gas to domestic storage ahead of winter.
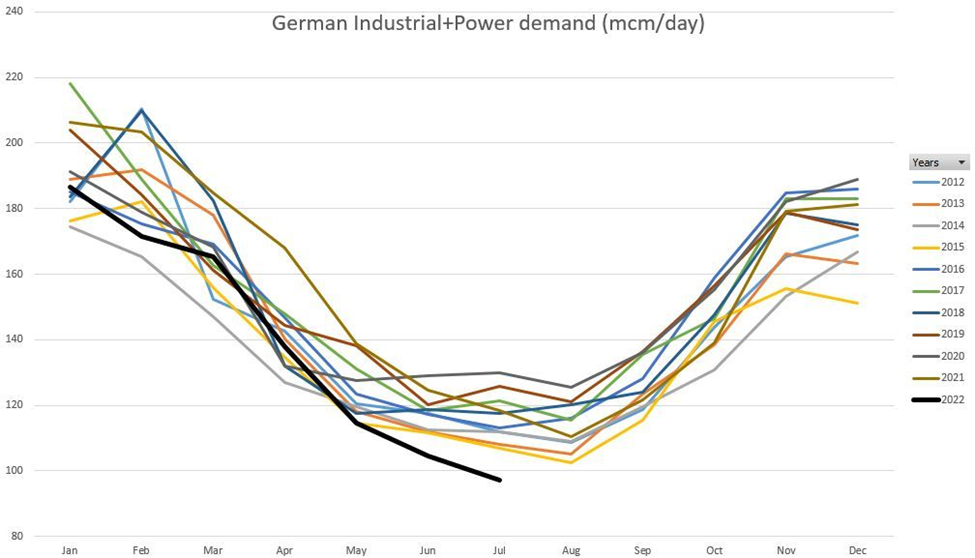
Germany would like to have storage sites 90% full by November from about 65% now, but this might be difficult with no clear timeline on the return of NS1.
https://twitter.com/GazpromEN/status/1547224254520999938?s=20&t=JvrP-5DDrMDX4LehnnydOQ
NatGas Storage Fundamentals:
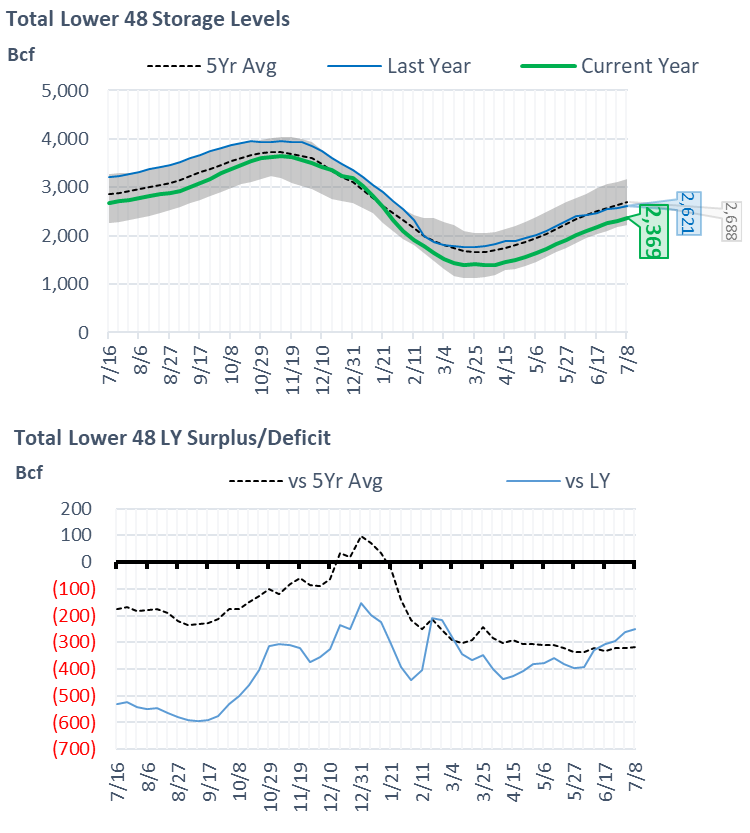
The EIA reported a +58 Bcf injection for the week ending July 8th, which came in line with the market consensus and our final estimate of +57. This was a difficult week to nail after the +60 Bcf injection the previous week. With the two reports being at a similar injection level, the path to get there was quite different. In simple terms, it appears the warmer temps this week (+2F nationally) were canceled out by the lower demand due to the holiday week.
This storage report takes the total level to 2369 Bcf, which is 252 Bcf less than last year at this time and 319 Bcf below the five-year average of 2,688 Bcf.
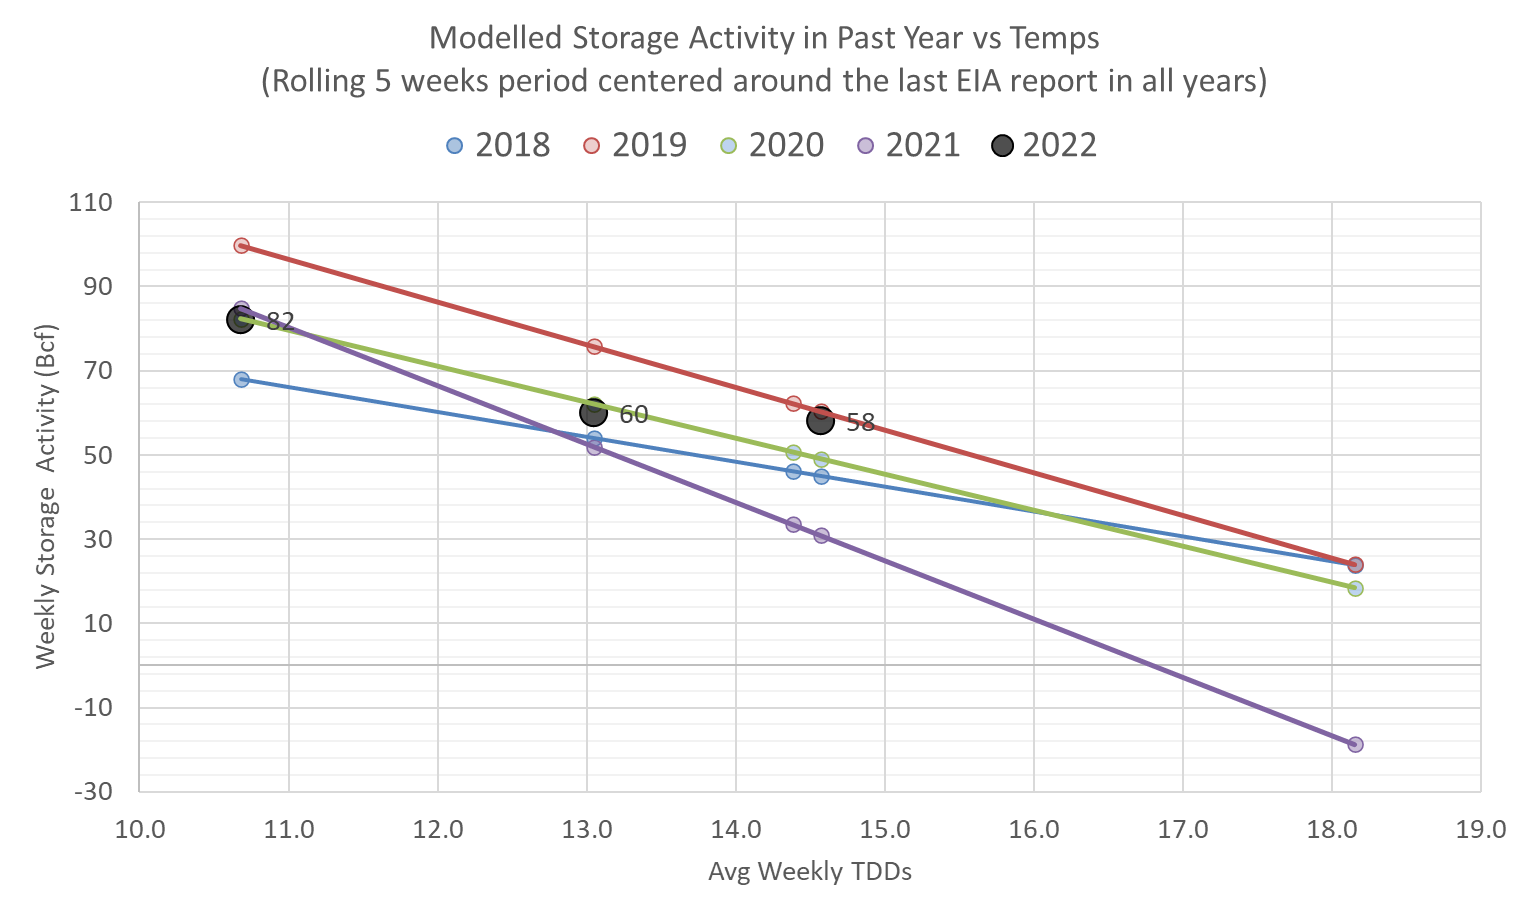
Overall, we estimate this +58 Bcf injection is ~3.9 Bcf/d loose vs the historical rolling 5-week period (wx adjusted). As we noted last week, the chart below builds in a rolling 5-week regression centered around the last EIA report – week #28 or week ending July 8th. The lines for 2018-2021 essentially show the resulting injection in those years (during week 26 through 30) if they experienced the same temps as this current summer (historicals + the 15-day forecast).
So the +3.9 Bcf/d loose comes with some caveats. This number includes the giveback from the Freeport outage (~14 Bcf) and also includes the July 4th holiday impact (~10 Bcf). So if we normalize for those two factors, then this week’s number would have been close to a +34. This injection level would have only been +0.4 Bcf/d loose.
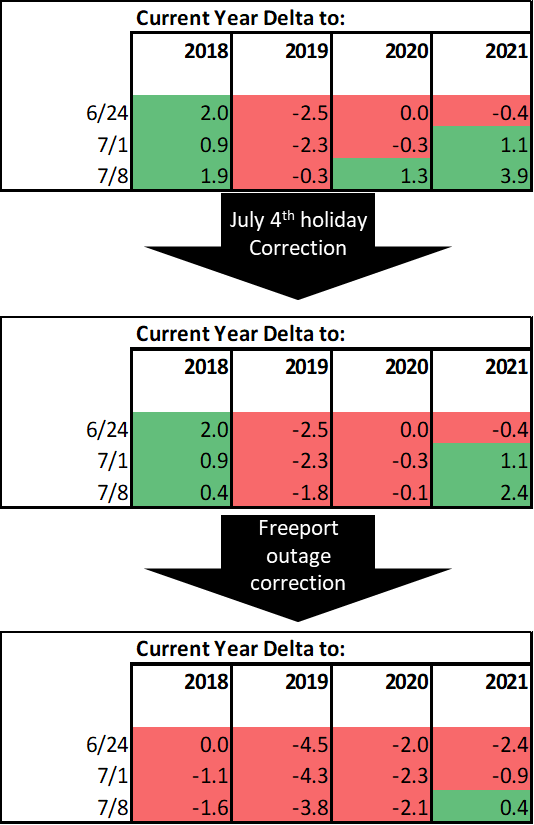
Here is how the storage report stacks up against past years on a wx adjusted bases. I’ve made the holiday correction first and then added on the freeport correction. This gives you a scope of where today’s storage numbers hit.
As we noted above, the almost flat injection week-on-week comes despite a big spread in weather. At the L48 level, CDDs jumped by 1.9 F leading but overall average power burns were flat due to the holiday.
For the week ending July 15th, our early view is +42 Bcf. This reporting period will take L48 storage level to 2,411 Bcf (-260 vs LY, -318 vs. 5Yr). This upcoming report does not help reduce the deficit vs last year. Last year we injected 50 Bcf during the same week last year.
During the past week, west of the Rockies and the South Central continued to stay extremely hot but did not have the same intensity. The net result was the L48 population wt. CDDs were on par with the previous week.
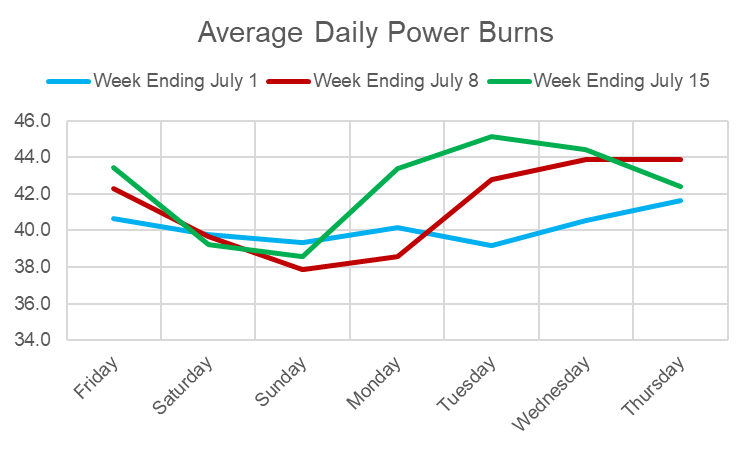
This resulted in power burns averaging 42.4 Bcf/d over the week and a new peak level of 45.2 Bcf/d on July 12th. For the week burns were higher by 1.1 Bcf/d.
With the loss of the EIA 930 data, we have been a bit blind to the impact of wind generation over the past few weeks. We were able to pull data from Genscape this week to fill in some gaps and give a better understanding of the impact of wind on this upcoming storage number. Below is the average daily wind gen performance over the last 6 storage weeks. As seen, the wind has been declining steadily since mid-June. This past week, the wind dropped by a considerable 10.6 GWh on average while gas generation rose by 15 GWh on average to make up for the lost wind and increased load.
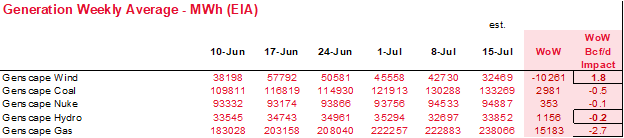
source: Genscape
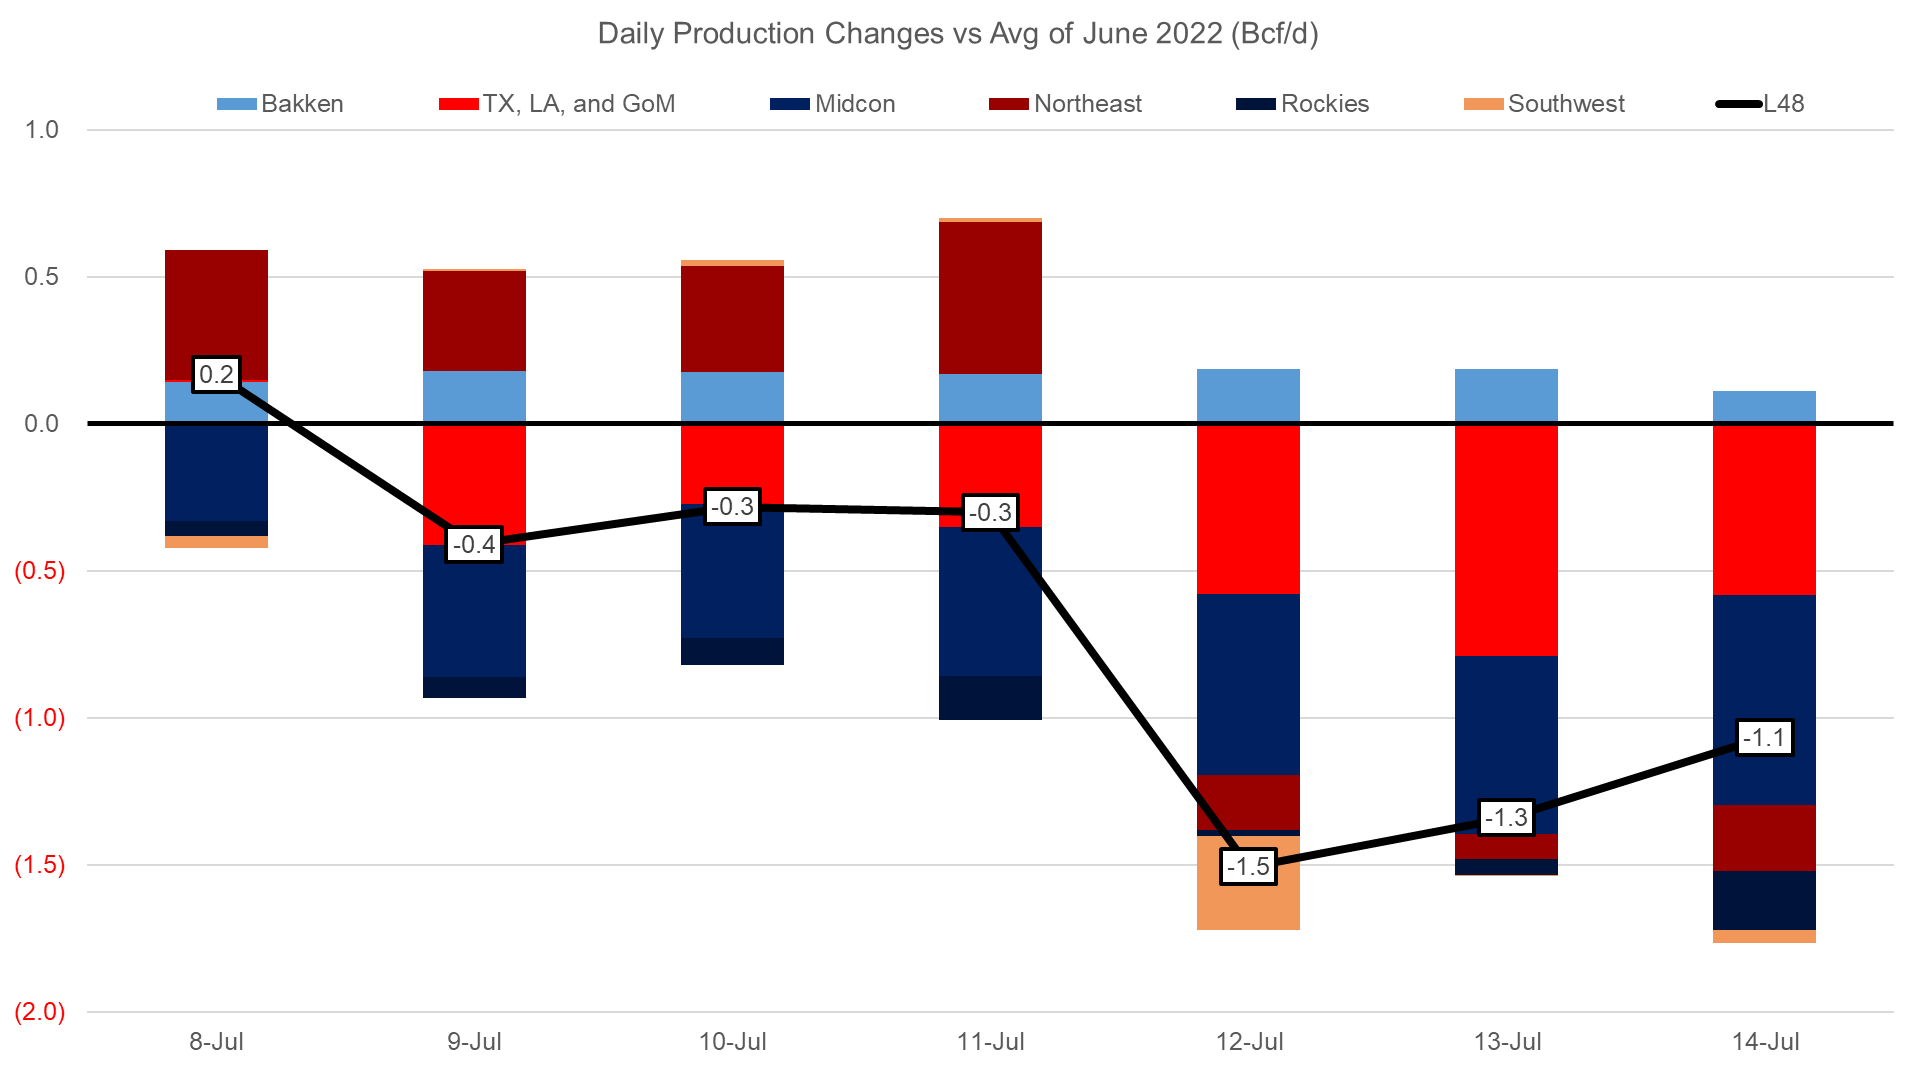
Domestic dry gas production was slightly lower week-on-week with the drop coming mainly from the Midcon to Texas. For those regions, there were no isolated events that disturbed production levels but were more widespread across many pipeline networks. It’s possible the intense heat reduced the intrastate compressor flows leading to lower production, even though much of the equipment across these regions are built to handle the heat. This week averaged 96.1 Bcf/d, or lower by 0.9 Bcf/d.
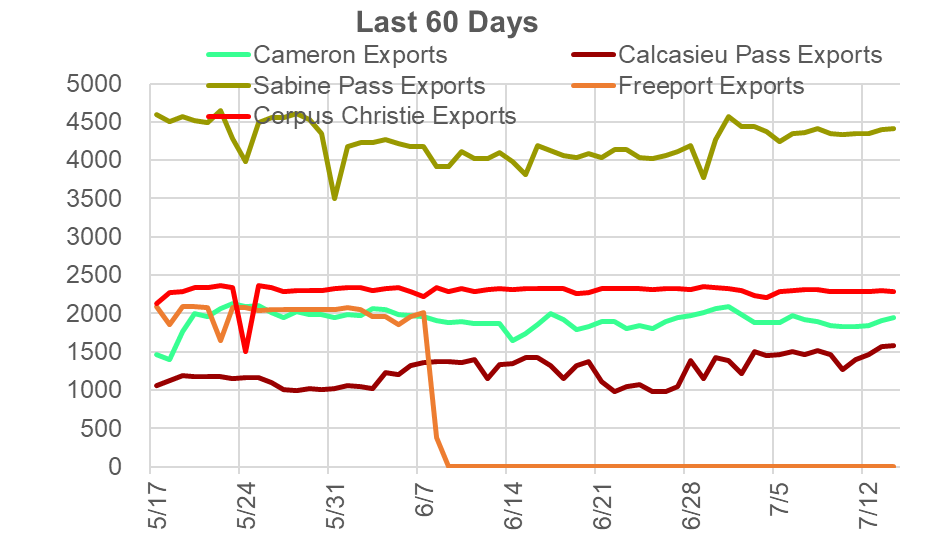
Deliveries to LNG facilities averaged 11.1 Bcf/d last week, which is 0.1 Bcf/d lower than the previous week. All facilities were relatively stable over the week.
The net balance was -1.0 Bcf/d tighter week-on-week.
This email, any information contained herein and any files transmitted with it (collectively, the Material) are the sole property of OTC Global Holdings LP and its affiliates (OTCGH); are confidential, may be legally privileged and are intended solely for the use of the individual or entity to whom they are addressed. Unauthorized disclosure, copying or distribution of the Material, is strictly prohibited and the recipient shall not redistribute the Material in any form to a third party. Please notify the sender immediately by email if you have received this email by mistake, delete this email from your system and destroy any hard copies. OTCGH waives no privilege or confidentiality due to any mistaken transmission of this email.