NatGas Storage Fundamentals:
The EIA reported a +60 Bcf injection for the week ending July 1st, which helped negate the ultra bearish view the previous two reports put in place. The market consensus was in the low-70s, which already accounted for the full impact of the Freeport outage.
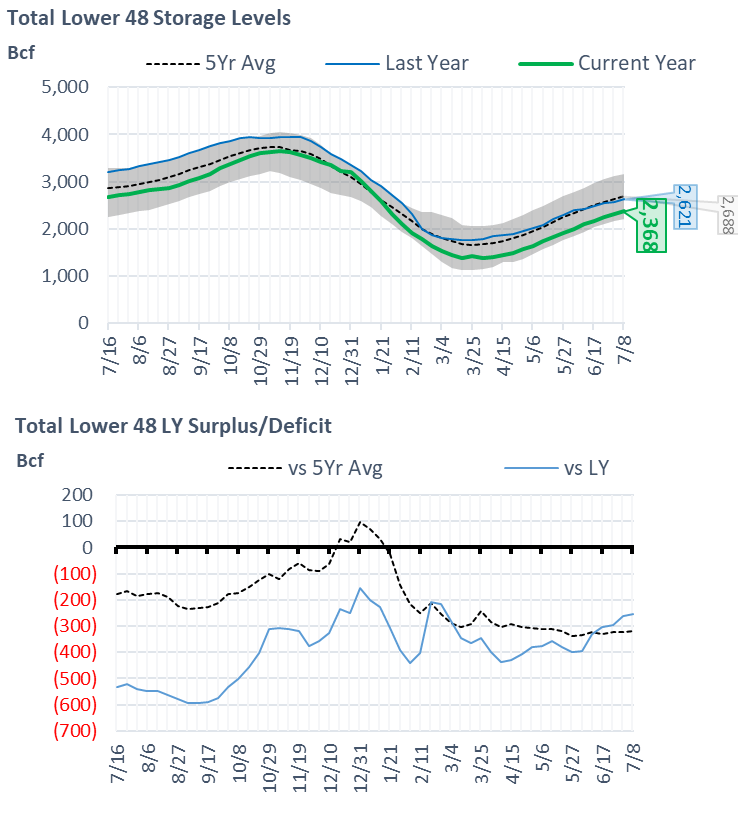
This storage report takes the total level to 2311 Bcf, which is 261 Bcf less than last year at this time and 322 Bcf below the five-year average of 2,633 Bcf. Overall, we estimate this +60 Bcf injection is ~2.4 Bcf/d loose vs last summer (wx adjusted). If we focus just on the storage injections from June through August, then this report was 2 Bcf/d loose vs last year.
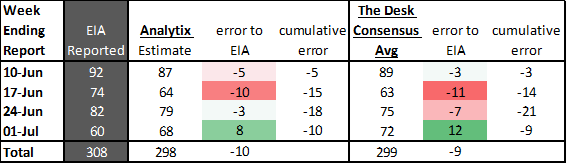
As we wrote in Friday’s daily report, we always put a little blame on the EIA or the storage operators incorrectly reporting to the EIA when the number is so far off expectations. I spoke with some people at the EIA yesterday, and they claim to receive input from 96% of working gas capacity each week – so absolutely no modeling error from their side. But there is still the possibility that the EIA gets incorrect data from the storage operators that are corrected in later weeks. If this was the case, this week’s low number would help correct the past cumulative error. Below is a table that shows the weekly error in our estimate and the market consensus for the past 4 weeks. As can be seen, this past week’s +60 Bcf does help correct some of the misses we had been seeing.
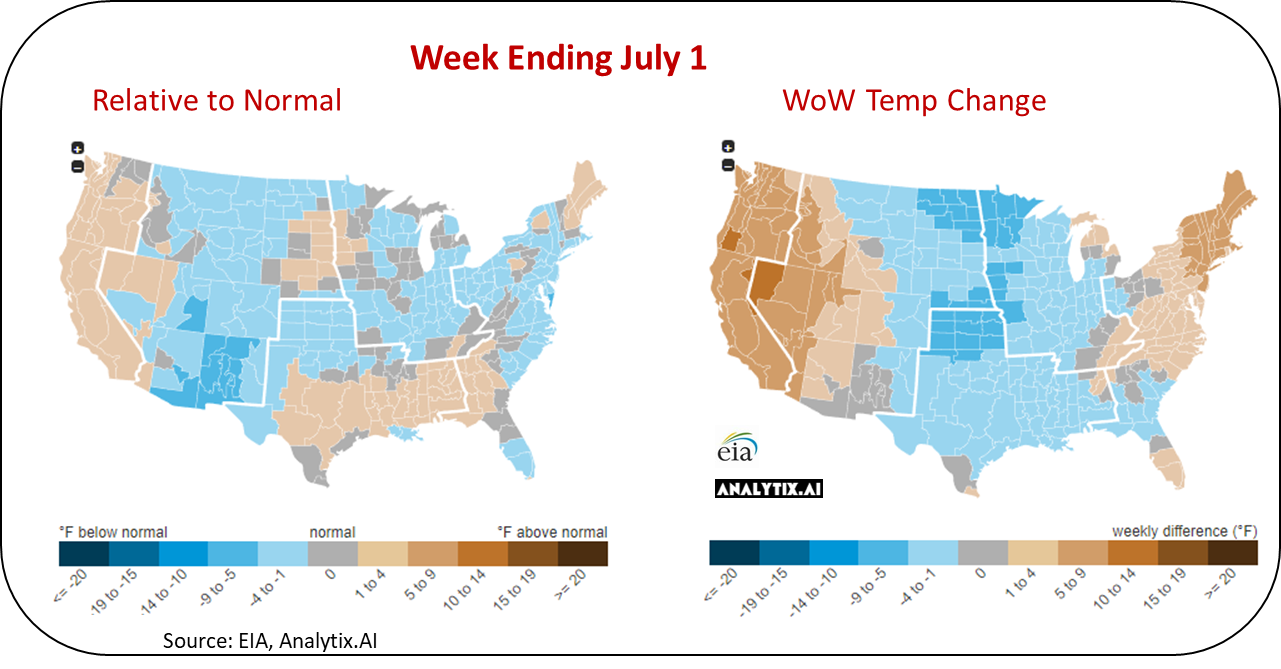
The lower injection week-on-week was primarily due to increasing gas consumption as hot weather continued across the west coast and south (TX to the SE). At the L48 level, CDDs jumped by 2.2 F leading to power burns averaging 40 Bcf/d or 2.5 Bcf/d WoW.
Overall, we estimate this +60 Bcf injection is ~1.4 Bcf/d loose vs the historical rolling 5-week period (wx adjusted). This chart builds in a rolling 5-week regression centered around the last EIA report – week #27 or week ending July 1st. The lines for 2018-2021 essentially show the resulting injection in those years (during week 25 through 29) if they experienced the same temps as this current summer (historicals + the 15-day forecast).
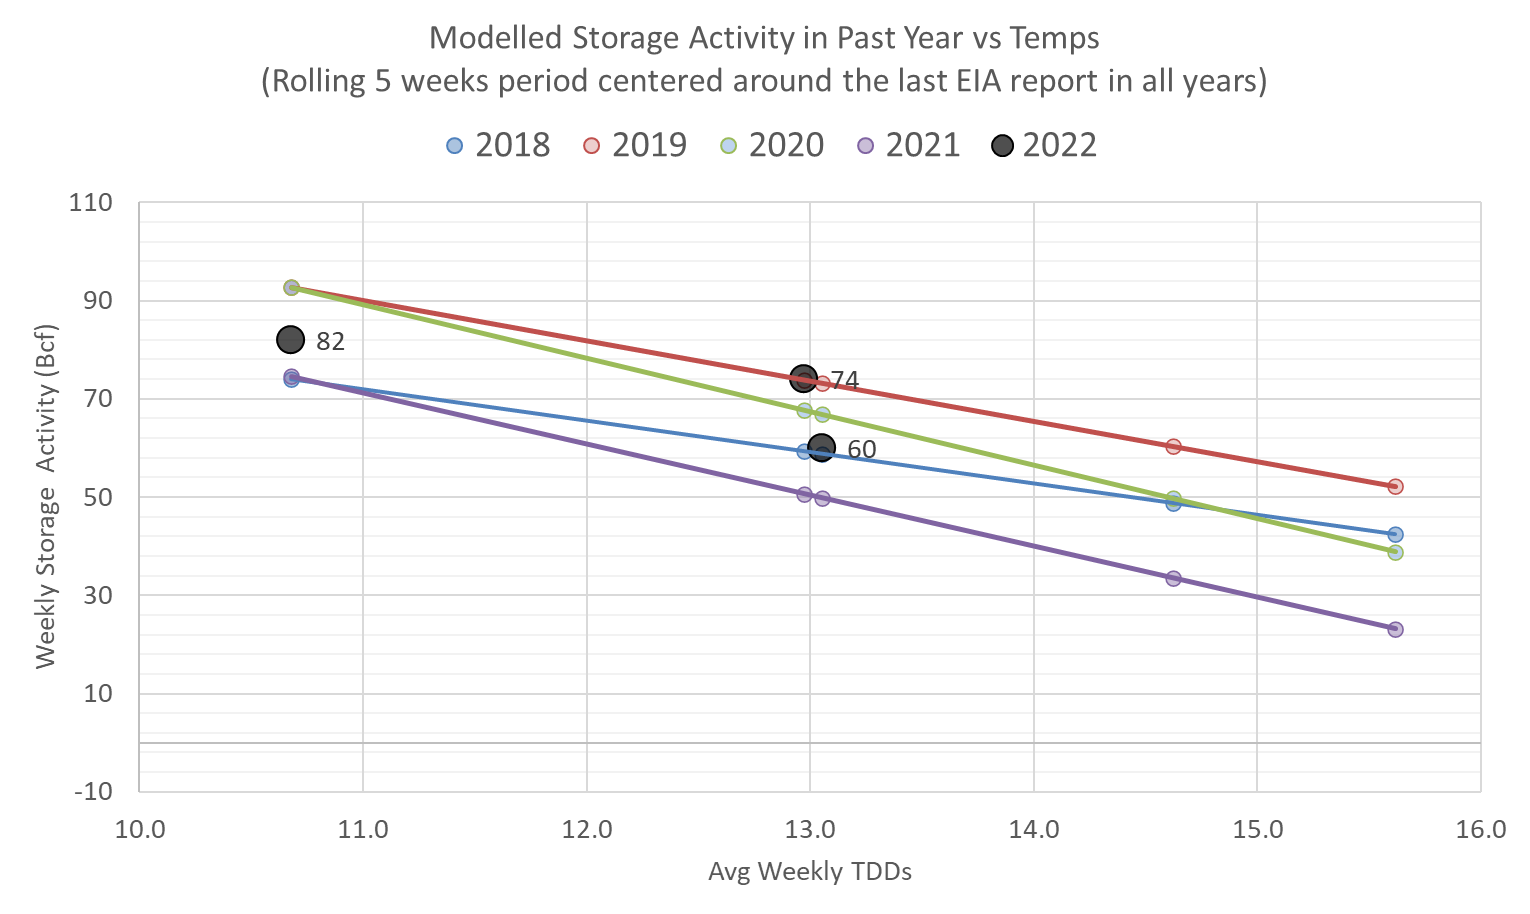
Note: these lines are essentially the linear trendlines you would have observed.
This method takes into account the changing conditions over the summer and adjusts for the weather. Here are the resulting wx adjusted deltas to past years (loose = green, tight = red).
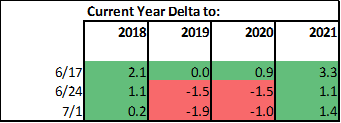
What’s concerning after looking at these figures is that if Freeport was still operational then the past two reports would have been net tight to LY, leading to a low end of season. Yes, not in that NEW comfortable range of 3.5-3.6 Tcf we are now expecting.
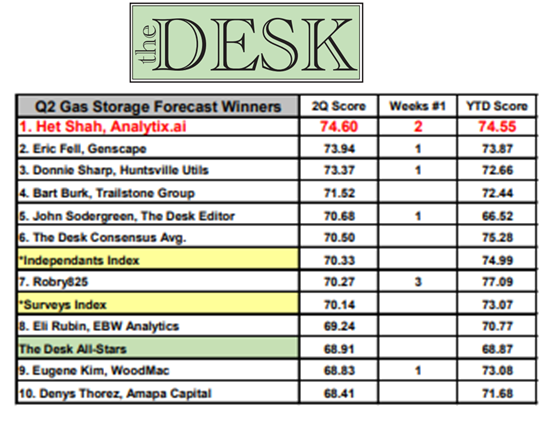
Finally, I wanted to share that our storage reports have done quite well in Q2 despite all the volatility in the storage numbers. We finished Q2 as the top forecaster for the weekly report as published in The Desk. [if you want to subscribe to the weekly scoreboard… drop me a line]
For the week ending July 8th, our early view is +53 Bcf. This reporting period will take L48 storage level to 2,364 Bcf (-257 vs LY, -324 vs. 5Yr). This upcoming report should help reduce the deficit vs last year with only 49 Bcf injected during the same week last year.
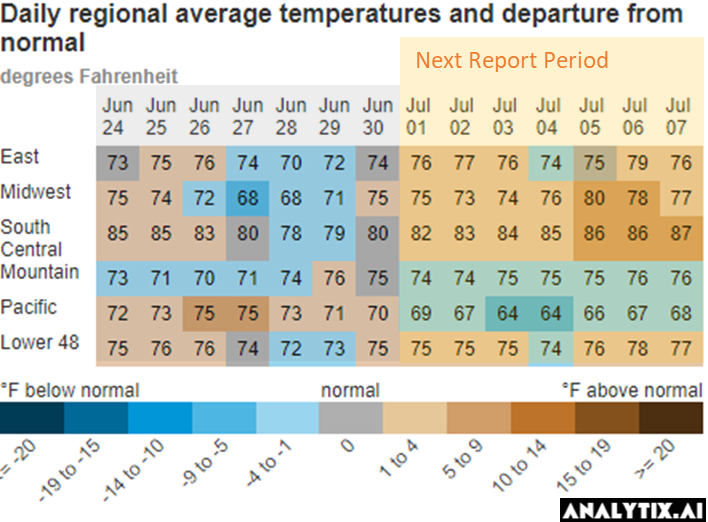
During the past week, all region East of the Rockies have been coming in much warmer than normal. The net result was the L48 population wt. CDDs increasing by 1.9 F; resulting in power burns jumping over 43 Bcf/d.
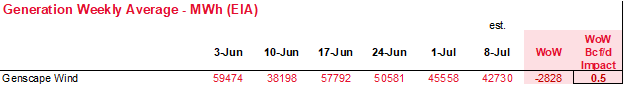
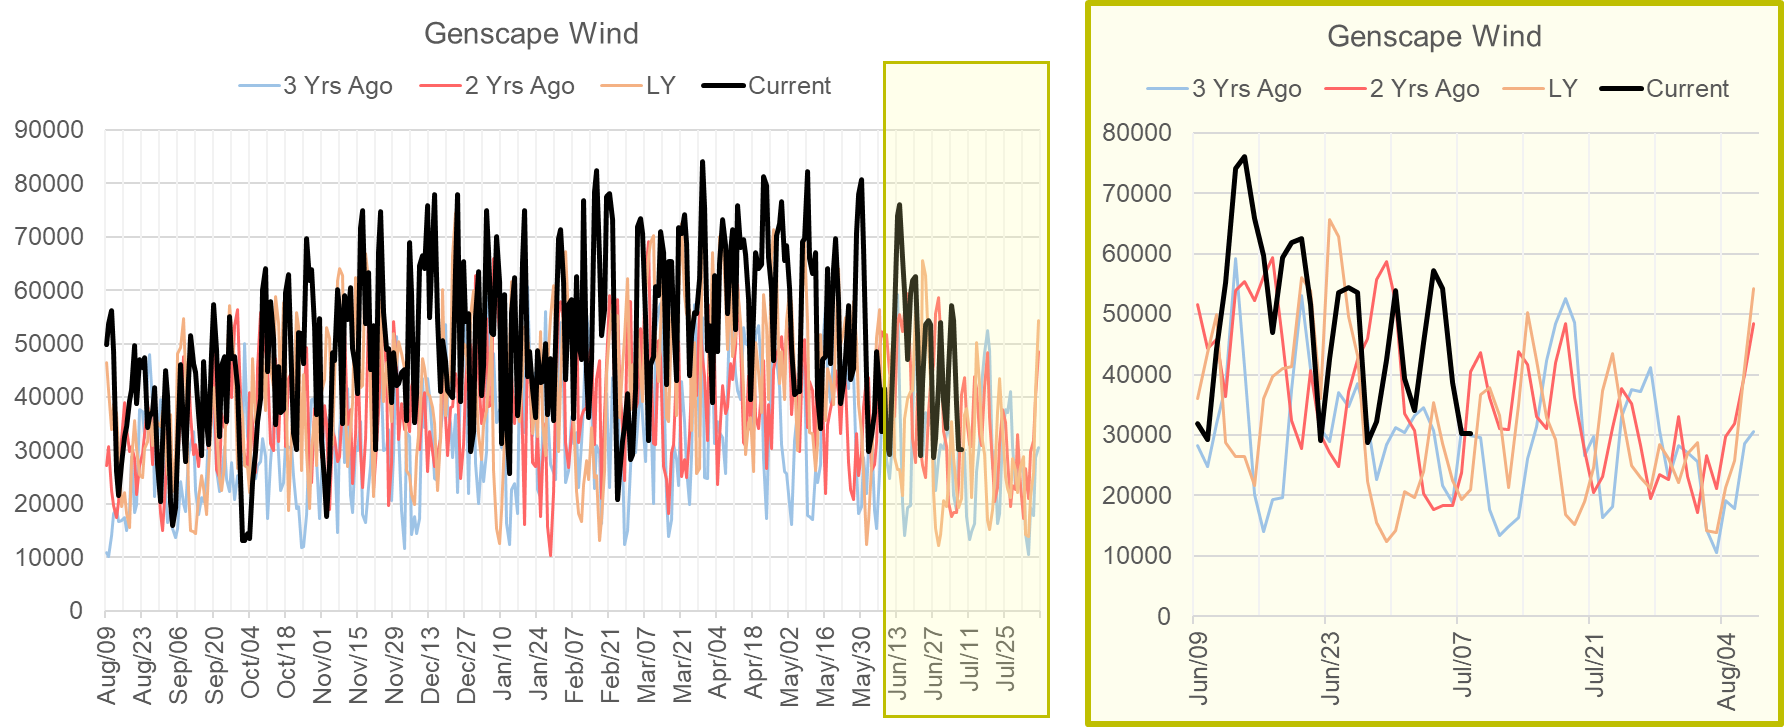
With the loss of the EIA 930 data, we have been a bit blind to the impact of wind generation over the past few weeks. We pulled data from Genscape this week to fill in some gaps and give a better understanding on the impact of wind this upcoming storage numbers. Below is the average daily wind gen performance over the last 6 storage weeks. As seen, wind has been declining steadily since mid June, which is somewhat part of the seasonality of wind. That being said, this past week performed below expected levels. We would expect wind gen for this time of the year to be around 47 GWh based on the total capacity now available.
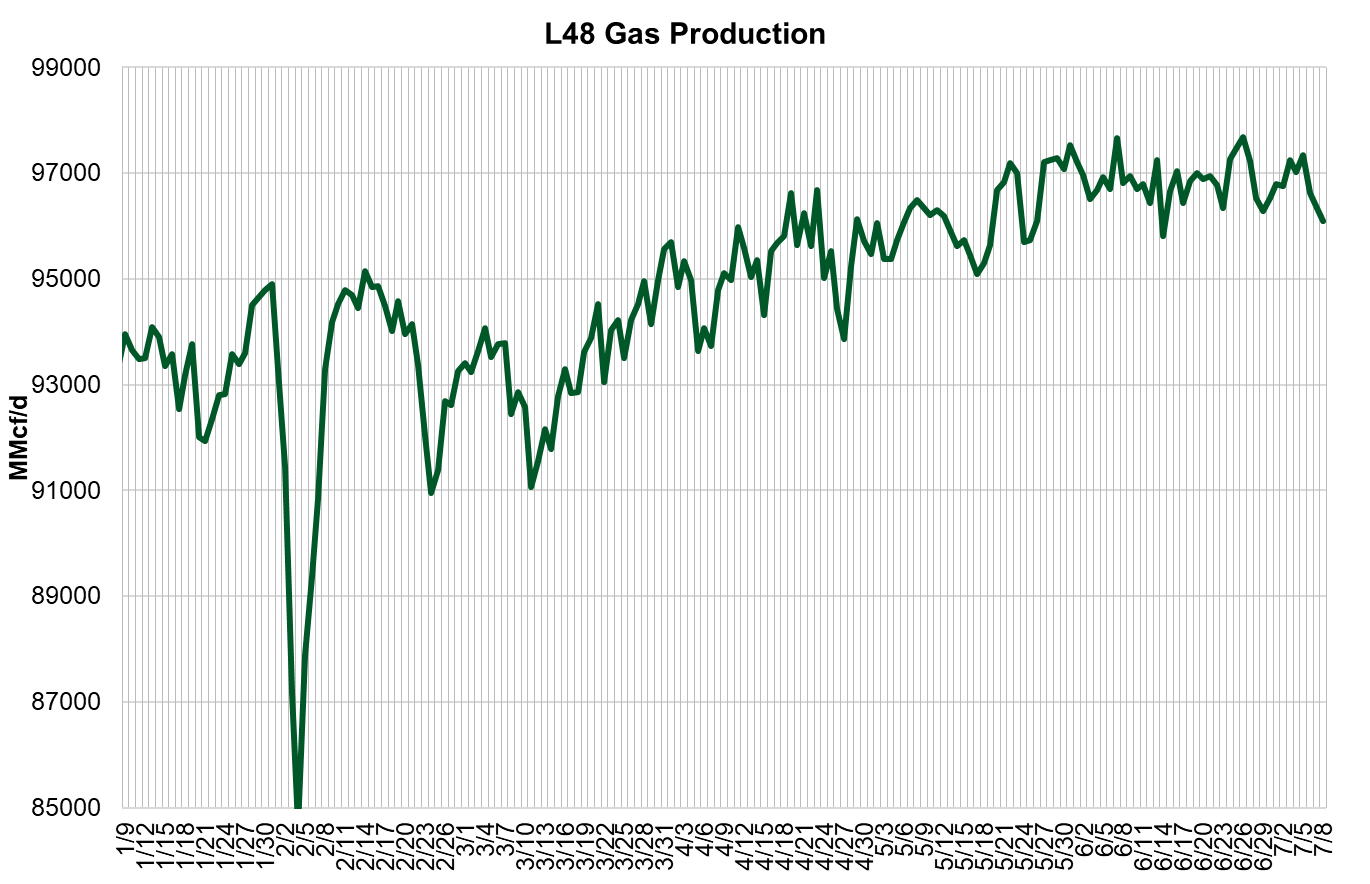
Domestic dry gas production was essentially flat to the past few weeks. This week averaged 96.9 Bcf/d, which puts production at the national level in a very tight range. That being said, we have seen volatility at the regional level.
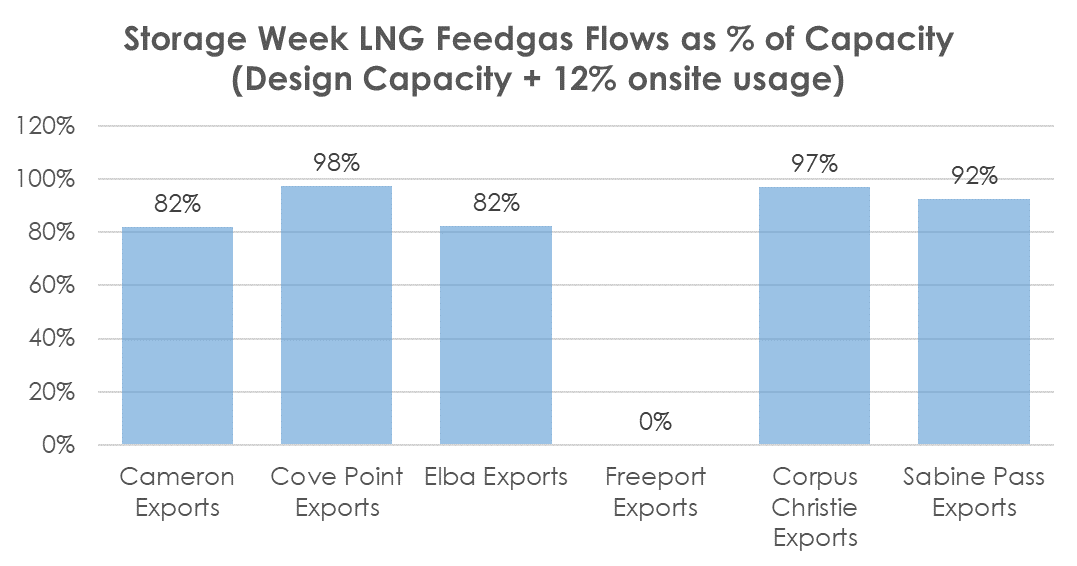
Deliveries to LNG facilities averaged 11.2 Bcf/d last week, which is 0.6 Bcf/d higher than the previous week. The growth came from Sabine Pass and Calcasieu Pass which both gained by 0.3 Bcf/d. Here is how the major facilities operated last week vs their design capacity.
The net balance was -0.8 Bcf/d tighter week-on-week.
This email, any information contained herein and any files transmitted with it (collectively, the Material) are the sole property of OTC Global Holdings LP and its affiliates (OTCGH); are confidential, may be legally privileged and are intended solely for the use of the individual or entity to whom they are addressed. Unauthorized disclosure, copying or distribution of the Material, is strictly prohibited and the recipient shall not redistribute the Material in any form to a third party. Please notify the sender immediately by email if you have received this email by mistake, delete this email from your system and destroy any hard copies. OTCGH waives no privilege or confidentiality due to any mistaken transmission of this email.