This week we start with some notes regarding the ongoing debate between Cheniere and the EPA. This got a bit of attention late in the week and seems like most are convinced it’s a non-issue.
For some background: Earlier this year the EPA announced a change to its regulatory regime for gas-fired turbines under the National Emission Standards for Hazardous Air Pollutants (NESHAP). Particularly, the EPA is looking to end an 18-year deferral in enforcing the formaldehyde criteria of the rule for two subclasses of turbines and would now force all units to show compliance with the whole rule by September 5, 2022.
This change will likely impact a wide array of natural gas infrastructure – ranging from gas-fired power generators, interstate/intrastate gas compressors, and LNG. The most vocal about this regulatory change has been Cheniere, which stated in March that this ruling would require expensive upgrades and temporarily force an outage. That being said, this change is likely to impact more than just Sabine Pass. The EPA indicates that the rule change impacts turbines directly involved in the liquefaction process at Sabine Pass, Corpus Christi, and Cameron.
Aside from the impact on LNG operations, the larger issue seems to be the potential impact on interstate gas flows. BTU Analytics out a great piece (link below), with a chart showing the pipelines impacted. As seen from the list below, these are some of the major pipeline networks running North-South.
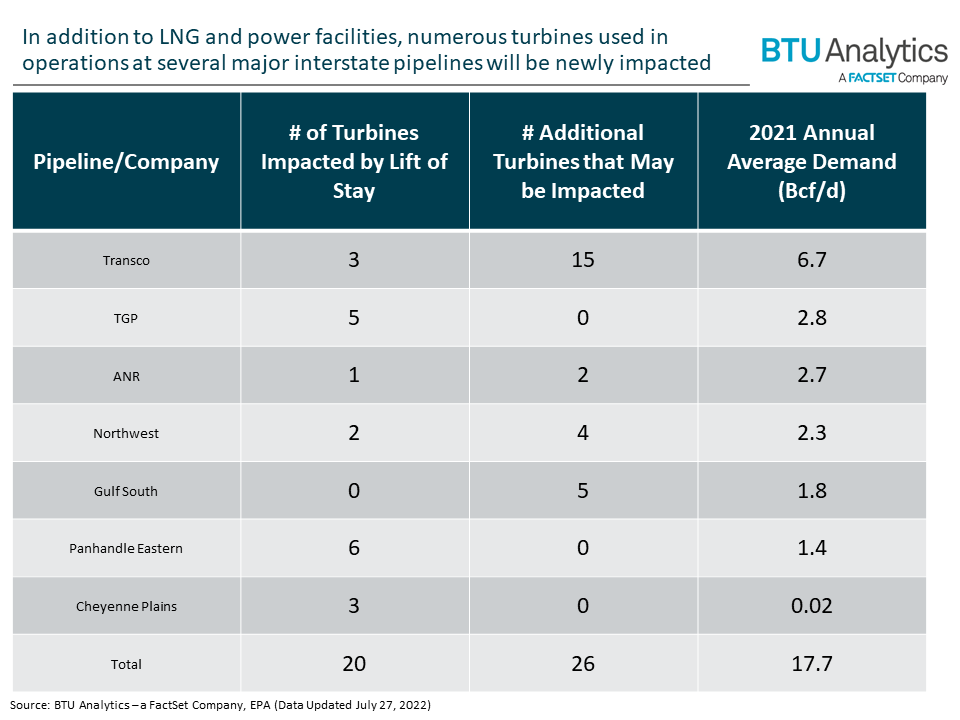
Under the EPA rules, all equipment must comply with the emissions limit of 91 parts per billion of formaldehyde. Cheniere said its turbine technology was in compliance with air quality rules in place at the time they were proposed.
It is very unclear whether the EPA will exempt Cheniere and others from these strict emissions limits. The common thought is that Cheniere will be able to evade the requirements, as this change has drastic impacts on both domestic and international gas supply.
Here is a good note from BTU Analytics to sum up their thoughts:
“First, the language of the final rule leaves the EPA with a large amount of discretion with regard to enforcement, stating, “For a source that fails to comply with the applicable requirements…the EPA will determine an appropriate response, if any, based on, among other things, the good faith effort of the source to comply.” It is entirely possible that the penalties for inaction will be minor and/or that the EPA will continue to work with operators to bring impacted units into compliance via a longer time frame that minimizes disruptions. Second, it is possible that some of the impacted units have either already been brought into compliance or were built in compliance since there has been no enforcement or testing over the last 18 years. Also, it is possible that some units could be brought into compliance without a major engineering effort. Finally, it seems likely that the Biden administration will take action to avoid disruptions, particularly to LNG assets, due to geopolitical tensions and the resulting initiatives required to provide energy security to European allies.”
So what will the Biden administration do? Everything possible to cap domestic inflation and save Europe, or otherwise?
The full BTU Analytics piece is worth the read: https://btuanalytics.com/natural-gas-pricing/epa-rule-change-could-have-wide-ranging-consequences-for-natural-gas-markets/
NatGas Storage Fundamentals:
The EIA reported a +44 Bcf injection for the week ending Aug 5th, which once again came in higher than the market consensus. This time it was in line with our final estimate of +45. Both our flow model and SnD model lined up with this estimate, giving us transparency into what changed this week. See the attachment for the weekly SnD table.
This storage report takes the total level to 2501 Bcf, which is 268 Bcf less than last year at this time and 338 Bcf below the five-year average of 2,794 Bcf.
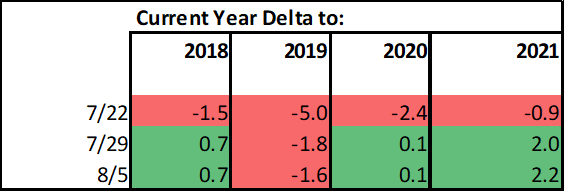
So the back-to-back loose number adds confidence to the story. We calculate the +44 Bcf injection being +2.2 Bcf/d loose vs the historical rolling 5-week period (wx adjusted).
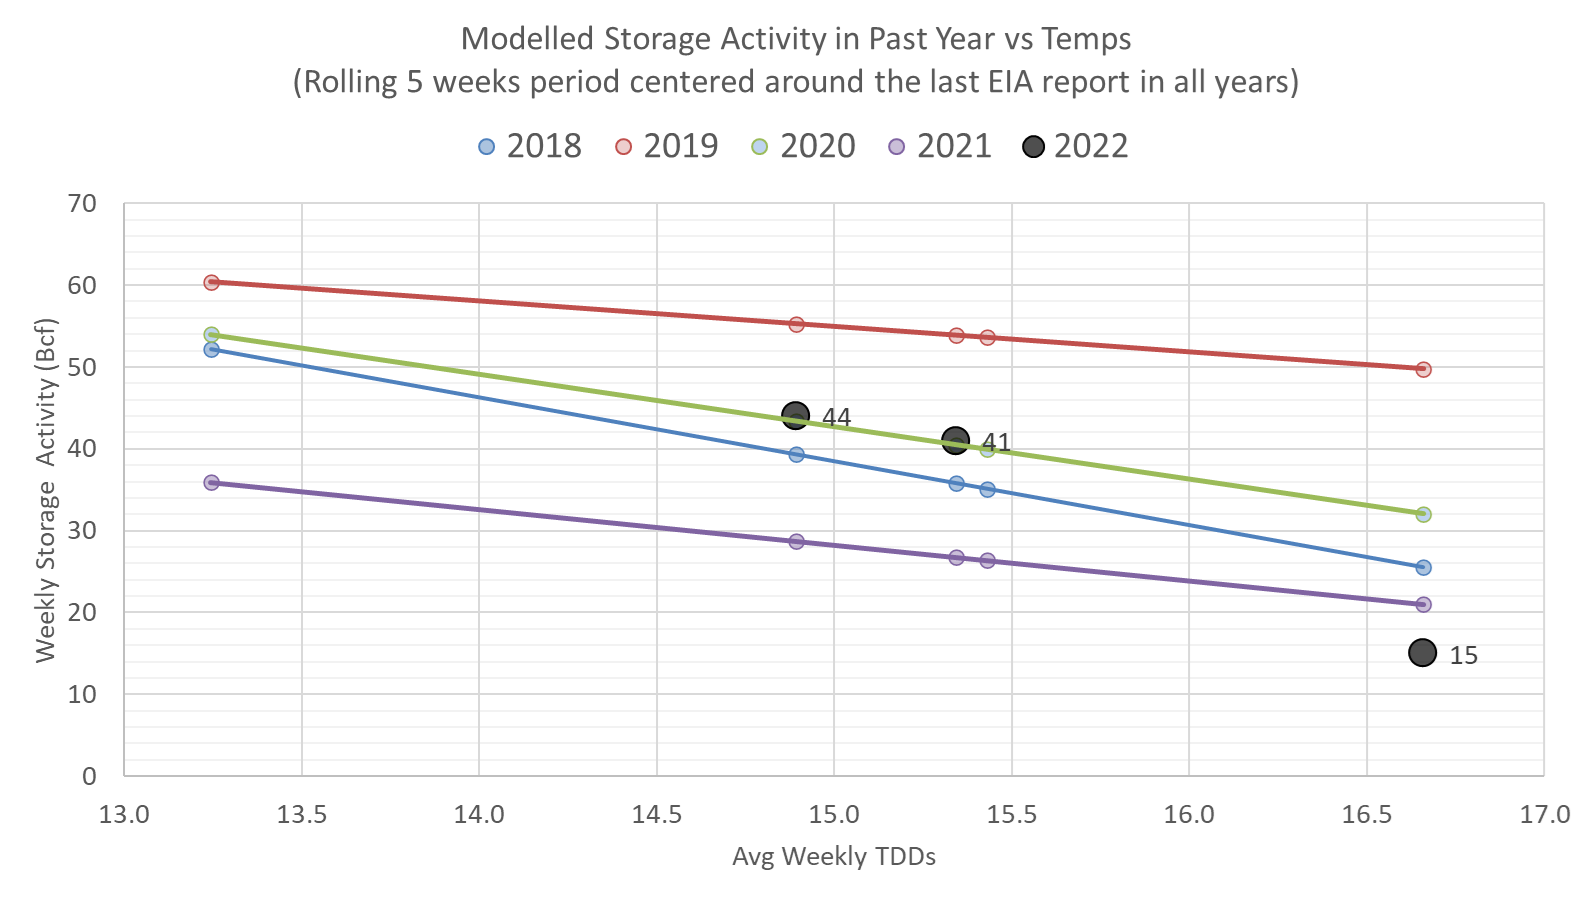
The image below shows the same data in chart format, i.e. the rolling 5-week regression centered around the last EIA report – week #32 or week ending Aug 5th. The lines for 2018-2021 essentially show the resulting injection in those years (during week 30 through 35) if they experienced the same temps as this current summer (historicals + the 15-day forecast).
Take this one step further, we now routinely wind adjust the storage number as the level of wind generation largely influences power burns. For this reporting period, the wind average was almost identical to the week prior. In both week ending July 29 and the week ending Aug 5th, wind generators produced on average 44 GWh of power. The expected level for this time of the year (adjusted for the increase in installed wind capacity ) should be 38-39 GWh according to our math; hence the additional wind generation once again reduced power burns by approximately 8 Bcf through the week. So thanks wind, otherwise the injection during the week ending August 5th would have been more like ~36 Bcf.
So in a nutshell, here is what the push behind the strong weekly injection:
1) strong production week on week, specifically out of the Texas region.
2) continued higher wind generation
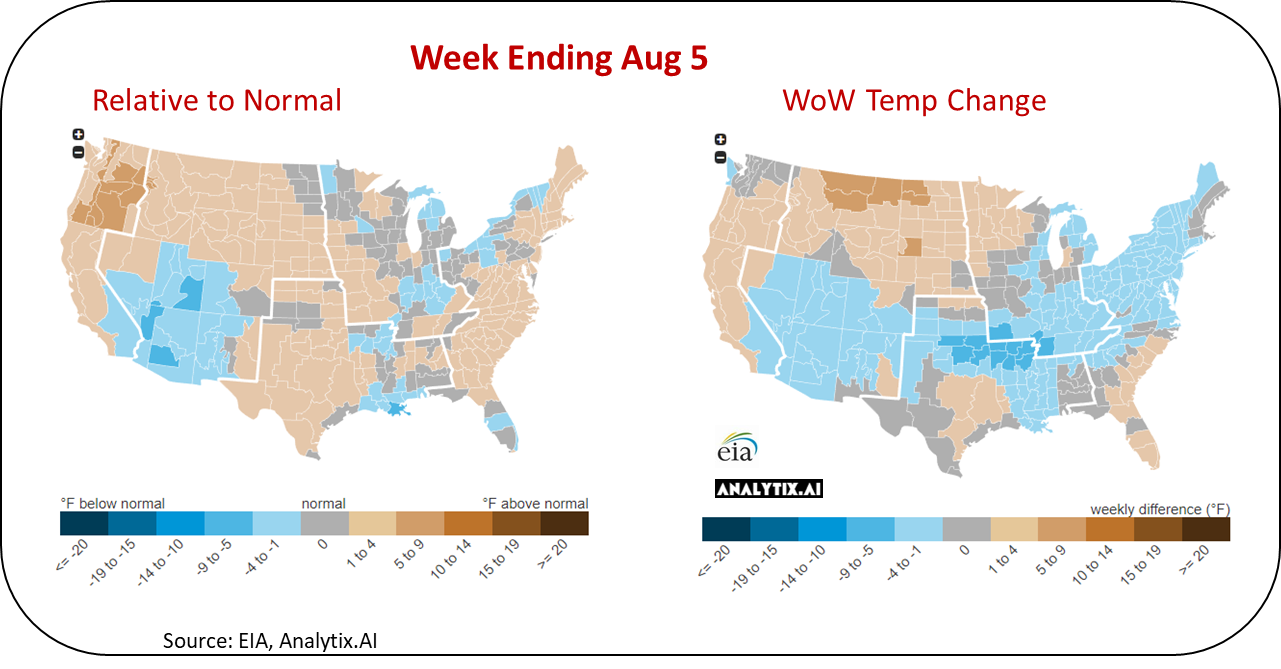
3) cooler weather week-on-week in the SW, MW, and NE
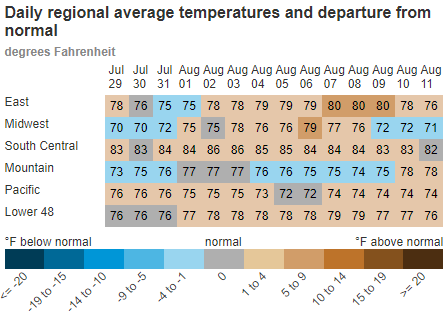
Here is a look at how the weather looked last week relative normal and the previous week:
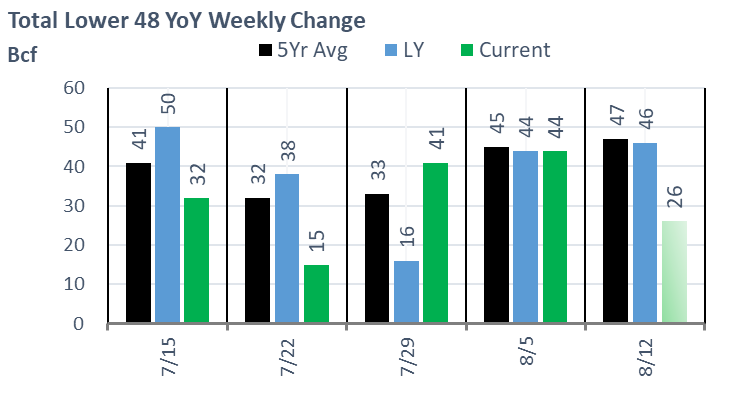
For the week ending Aug 12th, our early view is +26 Bcf. This reporting period will take L48 storage level to 2,527 Bcf (-288 vs LY, -359 vs. 5Yr). This upcoming report add to the YoY deficit. Last year we injected +46 Bcf during the same week.
During the past week, weather in most regions continued to trend well above normal. This kept the L48 population wt. CDDs higher than normal, and +0.8F versus the previous week.
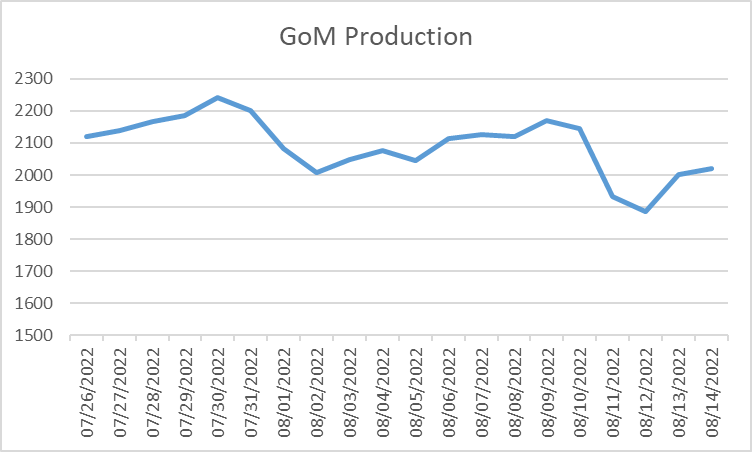
Domestic dry gas production held a high level this week after rising to record levels in late July. This despite the small drop in the Gulf of Mexico associated gas with the closure of the 7 offshore oil-producing facilities. A flange connecting two pipelines onshore in Louisiana failed and caused only 2 barrels of oil to spill, and the fix is expected to be quick (days). The spill halted the operation of the Mars and Amberjack Pipelines and impacted production at Shell’s Mars, Ursa, & Olympus platforms, Chevron’s Jack/St. Malo, Tahiti, & Big Foot platforms, and Equinor’s Titan platform. In all, there was about 600 kbbls/d of oil and approximately 300 mmcf/d of associated gas shut-in.
Overall, Gulf of Mexico production comes in at roughly 2.1-2.2 Bcf/d. The flow is quite consistent except during hurricane season when platforms can be evacuated for periods. As can be seen in the chart below, production from the Gulf of Mexico already looks to be recovering.
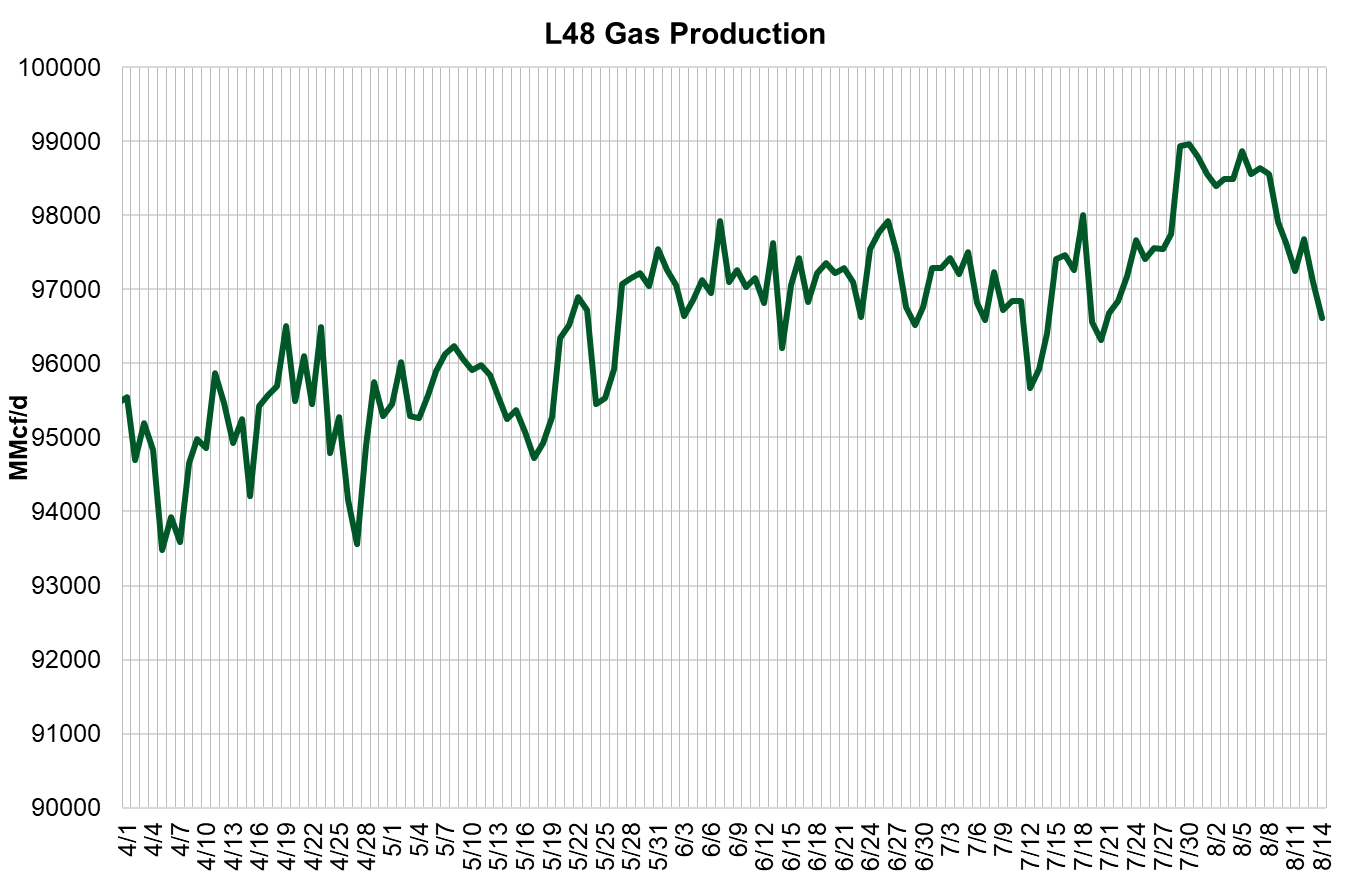
For the week, the average production was recorded at 98.4 Bcf/d or -0.2 Bcf/d week-on-week.
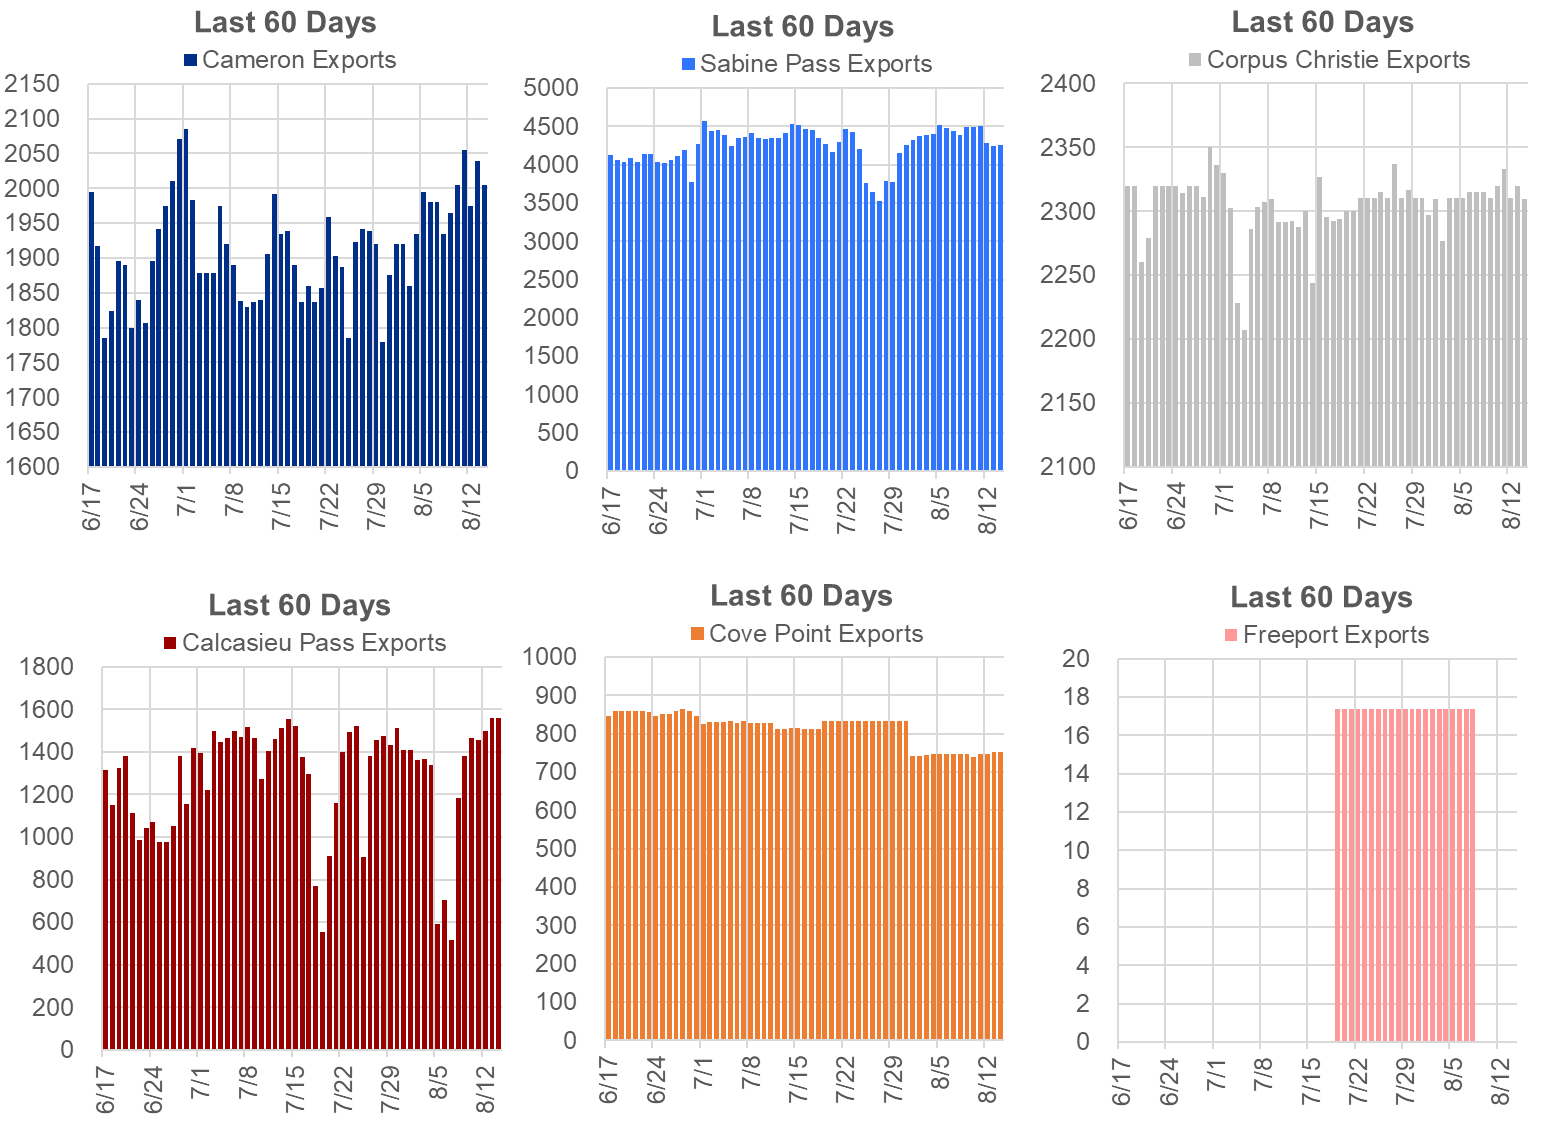
Deliveries to LNG facilities averaged 10.9 Bcf/d last week, which is flat with the previous week. Most notable was the early week drop in Calcasieu Pass and the small flows that had been going to Freeport LNG to generate power have come to a halt.
The net balance was -2.1 Bcf/d tighter week-on-week.
This email, any information contained herein and any files transmitted with it (collectively, the Material) are the sole property of OTC Global Holdings LP and its affiliates (OTCGH); are confidential, may be legally privileged and are intended solely for the use of the individual or entity to whom they are addressed. Unauthorized disclosure, copying or distribution of the Material, is strictly prohibited and the recipient shall not redistribute the Material in any form to a third party. Please notify the sender immediately by email if you have received this email by mistake, delete this email from your system and destroy any hard copies. OTCGH waives no privilege or confidentiality due to any mistaken transmission of this email.