From: Terry Reilly
Sent: Thursday, February 06, 2020 7:38:47 AM (UTC-06:00) Central Time (US & Canada)
Subject: FI Weekly USDA Export Sales Snapshot 02/06/20
PDF attached
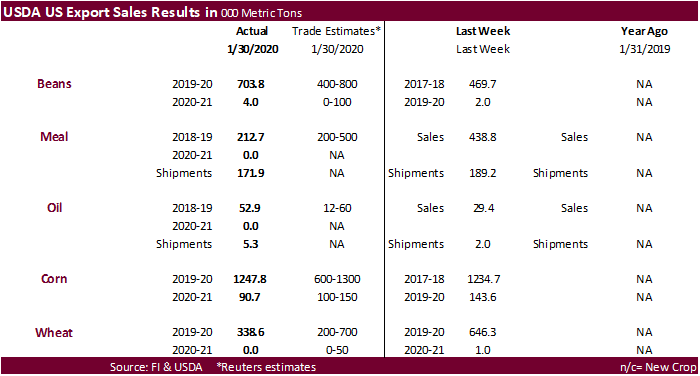
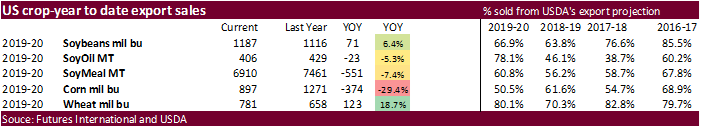
· US corn commitments have a long way to go to catch up to last year’s pace (down 29 percent yoy).
· All-wheat sales are running 19 percent above last year’s pace.
· SBO sales were very good at 52,900 tons. Remember USDA announced 30k was sold to Egypt under the 24-hour system.
U.S. EXPORT SALES FOR WEEK ENDING 1/30/2020
|
|
CURRENT MARKETING YEAR |
NEXT MARKETING YEAR |
||||||
|
COMMODITY |
NET SALES |
OUTSTANDING SALES |
WEEKLY EXPORTS |
ACCUMULATED EXPORTS |
NET SALES |
OUTSTANDING SALES |
||
|
CURRENT YEAR |
YEAR |
CURRENT YEAR |
YEAR |
|||||
|
|
THOUSAND METRIC TONS |
|||||||
|
WHEAT |
|
|
|
|
|
|
|
|
|
HRW |
149.0 |
1,814.1 |
1,808.2 |
159.4 |
6,060.9 |
3,770.6 |
0.0 |
80.9 |
|
SRW |
46.0 |
455.0 |
886.1 |
0.4 |
1,735.6 |
1,391.0 |
0.0 |
5.2 |
|
HRS |
93.6 |
1,558.8 |
1,511.3 |
124.8 |
4,552.4 |
3,992.9 |
0.0 |
59.0 |
|
WHITE |
49.9 |
1,139.2 |
1,167.2 |
120.2 |
3,135.7 |
2,961.6 |
0.0 |
20.9 |
|
DURUM |
0.0 |
190.4 |
89.9 |
0.0 |
623.8 |
330.0 |
0.0 |
61.0 |
|
TOTAL |
338.6 |
5,157.3 |
5,462.7 |
404.8 |
16,108.4 |
12,446.1 |
0.0 |
226.9 |
|
BARLEY |
0.0 |
16.7 |
30.9 |
1.2 |
32.0 |
27.4 |
21.5 |
30.5 |
|
CORN |
1,247.8 |
11,683.3 |
13,020.8 |
599.0 |
11,107.3 |
19,266.6 |
90.7 |
1,258.9 |
|
SORGHUM |
15.3 |
350.6 |
119.2 |
25.5 |
804.9 |
357.4 |
0.0 |
0.0 |
|
SOYBEANS |
703.8 |
5,471.4 |
12,517.2 |
1,448.3 |
26,836.4 |
17,851.9 |
4.0 |
310.3 |
|
SOY MEAL |
212.7 |
3,664.2 |
3,936.1 |
171.9 |
3,617.2 |
2,973.6 |
0.0 |
87.3 |
|
SOY OIL |
52.9 |
272.2 |
210.7 |
5.3 |
330.1 |
195.2 |
0.0 |
0.5 |
|
RICE |
|
|
|
|
|
|
|
|
|
L G RGH |
50.2 |
383.1 |
222.9 |
4.5 |
713.9 |
564.4 |
0.0 |
0.0 |
|
M S RGH |
0.0 |
18.5 |
4.5 |
0.3 |
16.8 |
23.1 |
0.0 |
0.0 |
|
L G BRN |
1.9 |
23.4 |
5.2 |
0.2 |
20.6 |
24.7 |
0.0 |
0.0 |
|
M&S BR |
0.3 |
67.8 |
95.2 |
1.6 |
22.7 |
45.3 |
0.0 |
0.0 |
|
L G MLD |
2.7 |
121.7 |
141.8 |
19.4 |
556.4 |
371.8 |
0.0 |
0.0 |
|
M S MLD |
21.3 |
128.8 |
217.3 |
24.7 |
328.6 |
191.2 |
0.0 |
0.0 |
|
TOTAL |
76.3 |
743.2 |
687.0 |
50.7 |
1,659.0 |
1,220.5 |
0.0 |
0.0 |
|
COTTON |
|
THOUSAND RUNNING BALES |
||||||
|
UPLAND |
332.3 |
7,379.5 |
7,305.9 |
418.8 |
5,467.1 |
3,572.9 |
4.8 |
1,085.6 |
|
PIMA |
5.5 |
224.2 |
294.6 |
5.7 |
205.3 |
172.6 |
0.0 |
35.3 |
Export Sales Highlights
This summary is based on reports from exporters for the period January 24-30, 2020.
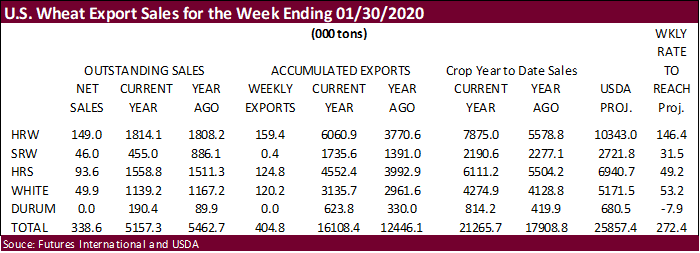
Wheat: Net sales of 338,600 metric tons for 2019/2020 were down 48 percent from the previous week and 35 percent from the prior 4-week average. Increases primarily for the Philippines (94,300 MT, including decreases of 500 MT), unknown destinations (60,500 MT), Mexico (52,100 MT, including 21,500 MT switched from unknown destinations and decreases of 900 MT), Nigeria (36,000 MT), and Italy (30,000 MT, switched from unknown destinations), were offset by reductions for South Korea (26,100 MT), Japan (13,600 MT), and Canada (1,700 MT). Exports of 404,800 MT were up 85 percent from the previous week and 4 percent from the prior 4-week average. The destinations were primarily to the Philippines (132,300 MT), Japan (90,900 MT), South Korea (53,200 MT), Mexico (38,900 MT), and Taiwan (33,700 MT).
Optional Origin Sales: For 2019/2020, the current outstanding balance of 56,000 MT is for the Philippines.
Corn: Net sales of 1,247,800 MT for 2019/2020 were up 1 percent from the previous week and 57 percent from the prior 4-week average. Increases primarily for Mexico (439,400 MT, including 38,000 MT switched from unknown destinations and decreases of 8,100 MT), Japan (234,400 MT, including 42,500 MT switched from unknown destinations and decreases of 2,100 MT), Colombia (147,300 MT, including 7,000 MT switched from unknown destinations), unknown destinations (145,500 MT), and Trinidad (95,000 MT), were offset by reductions for Nicaragua (13,800 MT). For 2020/2021, total net sales of 90,700 MT were for Japan. Exports of 599,000 MT were down 12 percent from the previous week, but up 12 percent from the prior 4-week average. The destinations were primarily to Mexico (278,400 MT), Japan (88,100 MT), Guatemala (55,700 MT), Costa Rica (54,900 MT), and Colombia (38,100 MT).
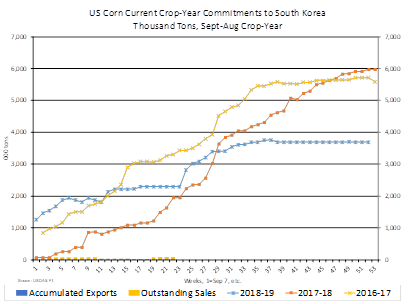
Optional Origin Sales: For 2019/2020, new optional origin sales of 199,000 MT were reported for South Korea. The current outstanding balance of 574,900 MT is for South Korea (466,000 MT), Egypt (58,900 MT), and Israel (50,000 MT).
Barley: No net sales for 2019/2020 were reported for the week. For 2020/2021, total net sales of 21,500 MT were for Japan. Exports of 1,200 MT were up 28 percent from the previous week and up noticeably from the prior 4-week average. The destinations were Japan (1,100 MT) and Taiwan (100 MT).
Sorghum: Net sales of 15,300 MT for 2019/2020 were primarily for Japan (11,400 MT, switched from unknown destinations). Exports of 25,500 MT were down 83 percent from the previous week and 61 percent from the prior 4-week average. The destinations were Mexico (14,000 MT) and Japan (11,500 MT).
Rice: Net sales of 76,300 MT for 2019/2020 were up noticeably from the previous week and up 74 percent from the prior 4-week average. Increases primarily for Colombia (28,000 MT), Guatemala (16,000 MT), Japan (15,800 MT, including decreases of 1,100 MT), Honduras (6,200 MT), and Canada (4,000 MT), were offset by reductions for Haiti (100 MT). Exports of 50,700 MT were up 23 percent from the previous week, but down 15 percent from the prior 4-week average. The destinations were primarily to Japan (15,200 MT), Haiti (15,100 MT), Mexico (5,900 MT), South Korea (4,100 MT), and Saudi Arabia (3,000 MT).
Exports for Own Account: For 2019/2020, the current exports for own account outstanding balance is 100 MT, all Canada.
Soybeans: Net sales of 703,800 MT for 2019/2020 were up 76 percent from the previous week and 29 percent from the prior 4-week average. Increases primarily for Egypt (264,400 MT), the Netherlands (205,600 MT, including 194,000 MT switched from unknown destinations and decreases of 800 MT), Taiwan (116,900 MT, including 117,000 MT switched from unknown destinations and decreases of 6,800 MT), Germany (69,100 MT), and Spain (63,500 MT, including 63,000 MT switched from unknown destinations and decreases of 3,300 MT), were offset by reductions primarily for unknown destinations (238,800 MT). For 2020/2021, total net sales of 4,000 MT were for Japan. Exports of 1,448,300 MT were up 25 percent from the previous week and 28 percent from the prior 4-week average. The destinations were primarily to China (552,500 MT), the Netherlands (205,600 MT), Taiwan (163,900 MT), Spain (118,500 MT), and Mexico (72,700 MT).
Exports for Own Account: For 2019/2020, the current exports for own account outstanding balance is 2,100 MT, all Canada.
Export Adjustments: Accumulated exports of soybeans to the Netherlands were adjusted down 69,135 MT for week ending January 23rd. The correct destination is Germany and is included in this week’s report.
Soybean Cake and Meal: Net sales of 212,700 MT for 2019/2020 were down 52 percent from the previous week and 44 percent from the prior 4-week average. Increases primarily for Spain (60,000 MT), Morocco (47,000 MT), unknown destinations (24,100 MT), Mexico (12,100 MT), and Canada (10,900 MT, including decreases of 2,000 MT), were offset by reductions primarily for Ecuador (2,000 MT), Nicaragua (1,300 MT), and Kuwait (200 MT). Exports of 171,900 MT were down 9 percent from the previous week and 16 percent from the prior 4-week average. The destinations were primarily to the Philippines (51,000 MT), Mexico (25,000 MT), Canada (21,600 MT), Guatemala (20,500 MT), and Colombia (18,900 MT).
Soybean Oil: Net sales of 52,900 MT for 2019/2020 were primarily for Egypt (30,000 MT), the Dominican Republic (8,900 MT), Venezuela (5,000 MT), South Korea (4,000 MT), and Nicaragua (2,200 MT). Exports of 5,300 MT were primarily to Jamaica (3,500 MT), Mexico (1,200 MT), Honduras (300 MT), and Canada (200 MT).
Cotton: Net sales of 332,300 RB for 2019/2020 were down 4 percent from the previous week, but up 28 percent from the prior 4-week average. Increases primarily for Turkey (156,300 RB), Vietnam (57,400 RB, including 2,000 RB switched from South Korea and decreases of 3,300 RB), Pakistan (41,000 RB), Indonesia (29,900 RB, including decreases of 4,300 RB), and Bangladesh (23,700 RB, including decreases of 800 RB), were offset by reductions primarily for South Korea (4,100 RB) and China (2,800 RB). For 2020/2021, net sales of 4,800 RB were for Pakistan (4,400 RB) and Mexico (400 RB). Exports of 418,800 RB–a marketing-year high–were up 28 percent from the previous week and 49 percent from the prior 4-week average. Exports were primarily to Vietnam (113,200 RB), Pakistan (94,900 RB), China (48,200 RB), Turkey (44,500 RB), and Bangladesh (32,100 RB). Net sales of Pima totaling 5,500 RB were down 65 percent from the previous week and 71 percent from the prior 4-week average. Increases were primarily for Pakistan (2,700 RB), Vietnam (900 RB), El Salvador (500 RB), Bangladesh (500 RB), and India (300 RB, including decreases of 100 RB). Exports of 5,700 RB were down 56 percent from the previous week and 30 percent from the prior 4-week average. The primary destinations were India (2,600 RB), Vietnam (900 RB), China (900 RB), Egypt (700 RB), and Turkey (300 RB).
Exports for Own Account: For 2019/2020, new exports for own account totaling 14,200 RB were to Vietnam (7,500 RB), Pakistan (4,400 RB), Bangladesh (1,100 RB), China (600 RB), Malaysia (400 RB), and Indonesia (200 RB). Exports for own account totaling 29,300 RB to Vietnam (22,000 RB), Bangladesh (3,000 RB), Pakistan (2,200 RB), China (1,900 RB), and Indonesia (200 RB) were applied to new or outstanding sales. Decreases were reported for India (2,400 RB). The current exports for own account outstanding balance of 25,900 RB is for Vietnam (8,300 RB), Bangladesh (6,500 RB), India (5,400 RB), China (3,100 RB), Pakistan (2,200 RB), and Malaysia (400 RB).
Hides and Skins: Net sales of 209,800 pieces were reported for 2020. Whole cattle hide sales totaling 207,700 pieces primarily for China (96,400 pieces, including decreases of 8,700 pieces), South Korea (49,000 pieces, including decreases of 1,800 pieces), Mexico (39,800 pieces, including decreases of 600 pieces), Brazil (17,200 pieces, including decreases of 700 pieces), and Thailand (2,600 pieces, including decreases of 1,500 pieces), were offset by reductions Indonesia (500 pieces). Exports of 447,500 pieces were reported for 2020. Whole cattle hide exports of 443,600 pieces were primarily to China (290,500 pieces), South Korea (56,900 pieces), Mexico (44,100 pieces), Thailand (16,400 pieces), and Indonesia (14,300 pieces).
Net sales of 33,300 wet blues for 2020 primarily for Vietnam (13,900 unsplit), China (6,600 grain splits and 6,100 unsplit), and Italy (6,700 unsplit), were offset by reductions primarily for Thailand (120 grain splits and 100 unsplit). Exports of 115,500 wet blues were to Italy (43,000 unsplit and 1,800 grain splits), China (24,100 unsplit and 7,500 grain splits), Vietnam (18,900 unsplit), Thailand (7,300 unsplit and 1,500 grain splits), and South Korea (7,100 grain splits). Total net sales of splits, 12,800 pounds for 2020, were for Vietnam. Total exports of 163,600 pounds were to Vietnam.
Beef: Net sales of 18,700 MT for 2020 were primarily for Japan (9,500 MT, including decreases of 600 MT), South Korea (4,800 MT, including decreases of 500 MT), Mexico (800 MT, including decreases of 100 MT), Canada (700 MT), and Chile (500 MT). Exports of 18,600 MT were primarily to Japan (6,100 MT), South Korea (5,800 MT), Mexico (1,800 MT), Taiwan (1,400 MT), and Hong Kong (900 MT).
Pork: Net sales of 29,500 MT for 2020 were primarily for Mexico (11,500 MT), China (5,100 MT), Japan (4,300 MT), South Korea (4,000 MT), and Canada (1,300 MT). Exports of 42,900 MT were primarily to China (16,200 MT), Mexico (12,300 MT), South Korea (3,900 MT), Japan (3,800 MT), and Canada (2,400 MT).
February 6, 2020 1 FOREIGN AGRICULTURAL SERVICE/USDA
SUMMARY OF EXPORT TRANSACTIONS
REPORTED UNDER THE DAILY SALES REPORTING SYSTEM
FOR PERIOD ENDING JANUARY 30 , 2020
COMMODITY DESTINATION QUANTITY (MT) M ARKETING
CORN MEXICO 124,355 MT 1/ 2019/2020
CORN SOUTH KOREA 134,000 MT 2/ 2019/2020
SOYBEANS EGYPT 130,000 MT 1/ 2019/2020
SOYBEAN OIL EGYPT 30,000 MT 1/ 2019/2020
1/ Export sales.
2/ An optional origin contract provides that the origin of the commodity may be the U.S. or one or more other exporting countries.
Terry Reilly
Senior Commodity Analyst – Grain and Oilseeds
Futures International │190 S LaSalle St., Suite 410│Chicago, IL 60603
W: 312.604.1366
AIM: fi_treilly
ICE IM: treilly1
Skype: fi.treilly

Trading of futures, options, swaps and other derivatives is risky and is not suitable for all persons. All of these investment products are leveraged, and you can lose more than your initial deposit. Each investment product is offered only to and from jurisdictions where solicitation and sale are lawful, and in accordance with applicable laws and regulations in such jurisdiction. The information provided here should not be relied upon as a substitute for independent research before making your investment decisions. Futures International, LLC is merely providing this information for your general information and the information does not take into account any particular individual’s investment objectives, financial situation, or needs. All investors should obtain advice based on their unique situation before making any investment decision. The contents of this communication and any attachments are for informational purposes only and under no circumstances should they be construed as an offer to buy or sell, or a solicitation to buy or sell any future, option, swap or other derivative. The sources for the information and any opinions in this communication are believed to be reliable, but Futures International, LLC does not warrant or guarantee the accuracy of such information or opinions. Futures International, LLC and its principals and employees may take positions different from any positions described in this communication. Past results are not necessarily indicative of future results.
This email, any information contained herein and any files transmitted with it (collectively, the Material) are the sole property of OTC Global Holdings LP and its affiliates (OTCGH); are confidential, may be legally privileged and are intended solely for the use of the individual or entity to whom they are addressed. Unauthorized disclosure, copying or distribution of the Material, is strictly prohibited and the recipient shall not redistribute the Material in any form to a third party. Please notify the sender immediately by email if you have received this email by mistake, delete this email from your system and destroy any hard copies. OTCGH waives no privilege or confidentiality due to any mistaken transmission of this email.