From: Terry Reilly
Sent: Thursday, February 13, 2020 2:29:05 PM (UTC-06:00) Central Time (US & Canada)
Subject: FI Evening Grain Comments 02/13/20

PDF attached. Funds will be sent later
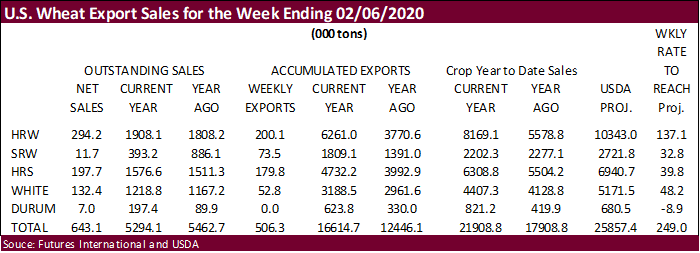
 

Attached
is our US wheat balance sheet.  Covid-19 continues to hang over the markets. 


USDA
on Friday will release its 2020:

·       
Agriculture projections at 11:00 am CT

https://www.ers.usda.gov/publications/

·       
Agriculture Baseline Database at 2:00 PM CT  

https://www.ers.usda.gov/calendar/?month=2&year=2020&day=14


Nearby
spreads             Chng

SH/K   
-10/-9.75          1.25

SMH/K  
-5.7/-5.6          0.10

BOH/K  
-0.37/-0.36        0.00

CH/K   
-5.25/-5          -0.75

WH/K   
-0.25/0            0.75

KWH/K  
-7/-6.75           -0.75

MWH/K  
-9.75/-9.5         -0.25


Weather

The
CPC looks for 60 percent chance for a neutral ENSO through the NH spring. 


MARKET
WEATHER MENTALITY FOR CORN AND SOYBEANS:
 

Not
much has changed overnight. Favorable soil moisture is present in Argentina, Brazil, South Africa, India and some eastern Australia locations which should support crop development.  There is still some concern over harvest conditions in early season soybean
areas of Brazil which may lead to more delay in second season corn planting, but progress is being made every day and it looks as though the paces is not far from the five year average even though much slower than last year.

            Too
much rain in northeastern South Africa in the past week has resulted in some flooding. Crop damage has not been assessed, but the region impacted is a minor production region in eastern Limpopo and northeastern Mpumalanga. Other areas in South Africa have
ideal crop development conditions.

More
rain will fall this week in northern and eastern Europe and from there to Ukraine and that will improve early season crop development potentials for areas that were too dry last autumn.

China’s
winter crops are still rated favorably with a big potential for improving rapeseed conditions in the early weeks of spring after recent weeks of rain.

India’s
winter crops are still poised to perform quite favorably, despite a drier biased outlook for the next ten days.

Southeast
Asia crops are still rated well, despite erratically distributed rainfall in recent weeks.

Eastern
Australia sorghum conditions have improved, but drought remains in key production areas and much more rain will be needed before winter planting of canola begins in late April. Summer crop development has improved, but it will still be a very small crop.

           
Today’s weather will have a mixed influence on market mentality.


MARKET
WEATHER MENTALITY FOR WHEAT:
 

Many
of the winter crop areas in the world that experienced poor crop establishment because of dryness last autumn have seen some timely precipitation in recent weeks. The moisture should help improve winter crop establishment prior to reproduction this spring.
There has also been very little winterkill this year and that should be supporting larger crops. With that said there may have been some damage in a few minor wheat areas in central Nebraska this morning where morning temperatures fell near slightly below
zero Fahrenheit.

            The
biggest dry concern today is in North Africa and in particular southwestern Morocco where durum wheat and barley production has been cut. There is potential for larger small grain losses from North Africa if improved rainfall does not occur soon. Spain and
Portugal are also drying out, but have adequate subsoil moisture for now.

           
Overall, weather today will continue to provide a mixed influence on market mentality.

Source:
World Weather Inc. and FI


Bloomberg
Ag Calendar

THURSDAY,
FEB. 13:

  • USDA
    weekly crop net-export sales for corn, soybeans, wheat, 8:30am
  • Giant
    pulp maker Suzano holds investor day in Sao Paulo
  • Brazil’s
    grain exporter group Anec holds conference on 2019-20 crop outlook

FRIDAY,
FEB. 14:

  • ICE
    Futures Europe weekly commitments of traders report on coffee, cocoa, sugar positions ~1:30pm (~6:30pm London)
  • CFTC
    commitments of traders weekly report on positions for various U.S. futures and options, 3:30pm
  • FranceAgriMer
    crop conditions – French crops office expected to resume crop-conditions reports after winter break
  • New
    Zealand food prices
  • Biosev
    holds analyst conference call to discuss 4Q earnings.

Source:
Bloomberg and FI


Informa
US 2020 acreage

Corn
93.44 vs 89.70 last year

Soybeans
86.50 vs 76.10 last year

All
wheat 45.53 vs 45.20 last year

OS
30.80 vs 31.20 last year

Durum
1.45 vs 1.34 last year

Cotton
13.01 vs 13.74 last year


FI
is using 92.50 for corn, 87.10 for soybeans, and all-wheat 45.6.  (table attached)

USDA
2019 Feb. outlook was 85.0 soybeans, 92.0 corn and 47.0 wheat

Source:
newswires and trade


Macros

US
CPI (M/M) Jan 0.1% (est 0.2%; prev 0.2%)


US CPI (Y/Y) Jan 2.5% (est 2.4%; prev 2.3%)

US
Core CPI (M/M) Jan 0.2% (est 0.2%; prev 0.1%)


US Core CPI (Y/Y) Jan 2.3% (est 2.2%; prev 2.3%)

US
Initial Jobless Claims Feb 8  205 K (est 210 K; prevR  203 K; prev 202 K)


US Continuing Claims Feb 1 1.698 Mln (est 1.745 Mln; prevR 1.759  Mln; prev 1.751 Mln


Corn.

·        
Corn, oats and US wheat trended lower.  March corn fell 3.50 cents on lack of fundamental bullish news, large SA crop prospects and spike in coronavirus deaths and cases.  China has been a heavy buyer of Ukraine
corn this week.  PNW fob corn was last around $15 premium to Ukraine spot fob corn.  The quality of the US corn has been in question when looking at the slow US sales for South Korea. 

·        
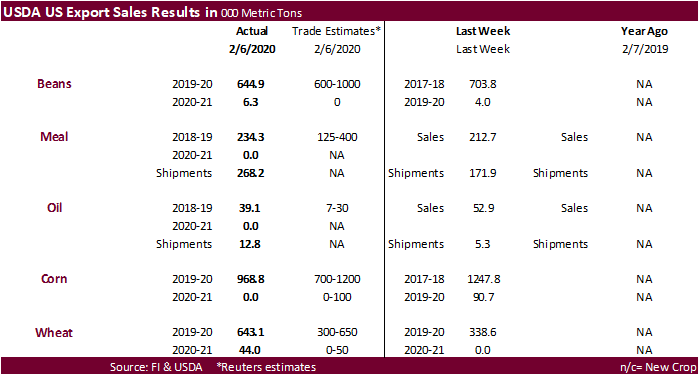
USDA corn sales of nearly 970,000 tons were within expectations. 

·        
1350+ deaths and more than 60,000 cases of coronavirus was recorded.  Click on the BBC link for charts:
https://www.bbc.com/news/world-asia-china-51482994

·        
Today was the last day of the Goldman Roll. 

·        
Argentina Buenos Aires Grain Exchange estimated the 2020 corn crop at 49 million tons.  USDA is at 50 million tons versus 51.0 million tons in 2019.  BA exchange is using a forecast of 50.6 million tons for
2019 (2019-20 local crop year).

·        
Agroconsult looks for the Brazil second corn crop to end up near 74.7 million tons, up from 74.0 from their previous projection.  USDA is using a combined crop-year production of 101.0 million tons for Brazil. 

·        
USDA pork sales last week were 28,600 (China 3.7k). 

·        
Port of Milwaukee will see a $31 million uplift to create space for handling DDGS. 

https://www.jsonline.com/story/money/2020/02/13/new-port-milwaukee-facility-ship-grain-overseas/4748713002/


Export
Developments

  • Results
    awaited: Algeria’s ONAB seeks 35,000 tons of optional origin corn on Feb. 13 for shipment in the second half of March

·        
China’s state reserve will sell 20,000 tons of frozen pork on Feb. 14.


Soybean
complex.

·        
Soybeans rallied led by the nearby contracts on lack of US producer selling and strong domestic crush rate.  China is still buying soybeans, but mainly from South America.  Purchases and shipments from the
US to China has slowed in recent weeks.  Traders will be watching what happens after February 14, the date the 30-day observation period ends for Phase One trade agreement.  We don’t expect large sales to show up immediately.  Note Monday is a US holiday. 
US interior movement of soybeans slowed this week with snow across the Midwest and heavy rain across the southeast.  Palm oil rolled over again with futures and cash falling more than 2 percent. Soybean meal basis firmed about $3.00 at three locations in Iowa. 

·        
Spreading in soybeans was active again. March soybeans closed 3.75 cents higher and May 2.50 higher. 

·        
March meal was up $0.20 at $291.90 and March soybean oil down 31 points at 30.72 points.

·        
USDA US soybean sales were near the lower end of expectations, meal was within and soybean oil above.   Reuters noted soybean shipments to China fell to their lowest level in 10 months.

·        
China soybean stocks were nearly 6 million tons, according to the CNGOIC, a comfortable level, in my opinion. 

·        
Port movement in Brazil is picking up after getting heavy rain earlier this week.  Producers have been active selling soybeans in part to the real hitting record lows earlier this week. 

·        
Brazil’s AgMin noted the value of agriculture exports during January fell 9.4 percent from the previous year to $5.8 billion.  Export volume was down 2.2%.   Brazil’s Mato Grosso soybean forward sales are
running at about 68 percent.

·        
Agroconsult looks for the Brazil soybean crop to end up near 126.3 million tons, up from 124.3 from their previous projection.  USDA is using 125.0 million tons. 

  • The
    Rosario grains exchange estimated the Argentina soybean crop at 55 million tons, up 1 million tons from their last estimate.  USDA is at 53.0 MMT versus 55.3 in 2019. 
  • The
    USDA February Outlook Forum starts a week from today. 
  • NOPA
    will issue its US January crush on Tuesday (Monday in the US is a holiday). Early estimates include around 1.725 billion pounds for soybean oil stocks and  just under 175 million bushels for soybean crush, which on a daily rate would be near December’s level. 

·        
The US$ was 23 higher as of 2 pm CT and slightly lower. The Brazilian Real was stronger at 4.3369 after hitting an all-time low during its intraday session. 

·        
SEA reported India January vegetable oil imports reached 1.196 MMT, down 6 percent from year earlier.  2019-20 Nov-Jan exports total 3.451 million tons.


Oilseeds
Export Developments

  • Egypt’s
    GASC bought 41,500 tons of local soybean oil at 12,300 Egyptian pounds ($788.44) a ton for arrival March 25-April 15.  Prices they paid are down from the $875+ shoveled out LH January for imported soybean oil. 

Reuters
breakdown of the purchase:

20,000
tons of soyoil at 12,300 Egyptian pounds($788.44) a ton

6,000
tons soyoil at 12,300 Egyptian pounds ($788.44) a ton

5,000
tons soyoil at 12,300 Egyptian pounds ($788.44) a ton

4,000
tons soyoil at 12,300 Egyptian pounds($788.44) a ton

3,500
tons soyoil at 12,300 Egyptian pounds($788.44)

3,000
tons soyoil at 12,300 Egyptian pounds($788.44) a ton


Brent
versus palm and soybean oil

Source:
Reuters and FI


Wheat

·        
US wheat futures traded lower on a strong USD and lack of daily US export developments. USDA export sales improved from the previous week but concerns over the coronavirus continued to linger over the market. 
The window to sell current crop year US wheat to China is closing. 

·        
March Chicago wheat closed down 3.25 cents, March KC down 5.00 cents and March Minn off 4.50 cents.  

·        
March Paris wheat futures finished up 0.25 euros at 192.75.

·        
USDA US all-wheat export sales were near the top end of expectations and nearly double than previous week (643,100 tons for week ending 2/6).  HRW wheat sales were 294,200 tons and HRS 197,700 tons.

·        
Strategie Grains lowered their 2020-21 EU wheat crop to 138.6MMT from 139.8 previous. See table after the export development section. 


Export
Developments.

  • South
    Korea’s MFG bought 67,000 tons of feed wheat at about $248.35/ton for May/June shipment. 
  • Turkey
    seeks 25,000 tons of barley on Feb. 18 for 2/26-3/15 loading. 
  • Jordan
    seeks 120,000 tons of wheat, optional origin, on Feb 18.
  • Jordan
    seeks 120,000 tons of feed barley.
  • Japan
    bought 110,565 tons of food wheat from the United States, Canada and Australia on Thursday.

Details
are as follows (in tons):


Rice/Other

·        
Results awaited: Mauritius has delayed the deadline for to buy up to 6,000 tons of long grain white rice to Feb. 10, for delivery between May 1 and July 31.

·        
Results awaited: Turkey’s TMO seeks 20,000 tons of rice on Feb. 12 for shipment between Feb. 19 and April 6.


U.S. EXPORT SALES FOR WEEK ENDING 2/6/2020


CURRENT MARKETING YEAR

NEXT MARKETING YEAR

COMMODITY

NET SALES

OUTSTANDING SALES

WEEKLY EXPORTS

ACCUMULATED EXPORTS

NET SALES

OUTSTANDING SALES

CURRENT YEAR

YEAR
AGO

CURRENT YEAR

YEAR
AGO


THOUSAND METRIC TONS

WHEAT


   HRW    

294.2

1,908.1

1,808.2

200.1

6,261.0

3,770.6

0.0

80.9

   SRW    

11.7

393.2

886.1

73.5

1,809.1

1,391.0

20.0

25.2

   HRS     

197.7

1,576.6

1,511.3

179.8

4,732.2

3,992.9

24.0

83.0

   WHITE   

132.4

1,218.8

1,167.2

52.8

3,188.5

2,961.6

0.0

20.9

   DURUM  

7.0

197.4

89.9

0.0

623.8

330.0

0.0

61.0

     TOTAL

643.1

5,294.1

5,462.7

506.3

16,614.7

12,446.1

44.0

270.9

BARLEY

0.0

15.8

30.9

1.0

33.0

27.4

0.0

30.5

CORN

968.8

11,869.4

13,020.8

782.8

11,890.0

19,266.6

0.0

1,258.9

SORGHUM

17.6

284.0

119.2

84.3

889.2

357.4

0.0

0.0

SOYBEANS

644.8

5,504.9

12,517.2

611.3

27,447.7

17,851.9

6.3

316.6

SOY MEAL

234.2

3,630.2

3,936.1

268.2

3,885.4

2,973.6

0.0

87.3

SOY OIL

39.1

298.6

210.7

12.8

342.9

195.2

0.0

0.5

RICE


   L G RGH

101.5

440.7

222.9

43.9

757.7

564.4

0.0

0.0

   M S RGH

25.0

43.3

4.5

0.2

17.0

23.1

0.0

0.0

   L G BRN

0.2

22.2

5.2

1.4

22.0

24.7

0.0

0.0

   M&S BR

0.1

66.0

95.2

1.9

24.5

45.3

0.0

0.0

   L G MLD

2.4

92.1

141.8

32.1

588.6

371.8

0.0

0.0

   M S MLD

6.8

129.0

217.3

6.6

335.2

191.2

0.0

0.0

     TOTAL

136.0

793.2

687.0

86.0

1,745.0

1,220.5

0.0

0.0

COTTON


THOUSAND RUNNING BALES      

   UPLAND

350.9

7,329.9

7,305.9

400.5

5,867.5

3,572.9

57.3

1,142.9

   PIMA

10.9

227.8

294.6

7.4

212.7

172.6

0.0

35.3


Export Sales Highlights   

This summary is based on reports from exporters for the period January 31-February 6, 2020.

Wheat:  Net sales of 643,100 metric tons for 2019/2020 were up 90 percent
from the previous week and 10 percent from the prior 4-week average.  Increases primarily for Nigeria (130,800 MT, including 51,700 MT switched from unknown destinations), the Philippines (104,800 MT), South Korea (91,100 MT), Vietnam (81,000 MT, including
10,000 MT switched from unknown destinations), and Mexico (79,200 MT), were offset by reductions for unknown destinations (50,900 MT), Bangladesh (3,000 MT), and Costa Rica (200 MT).  For 2020/2021, net sales of 44,000 MT were for the Philippines (24,000 MT),
unknown destinations (11,000 MT), and Peru (9,000 MT).  Exports of 506,300 MT were up 25 percent from the previous week and 26 percent from the prior 4-week average.  The destinations were primarily to Nigeria (98,800 MT), Bangladesh (87,000 MT), Mexico (69,400
MT), the Philippines (65,800 MT), and Japan (59,800 MT). 

Optional Origin Sales:  For 2019/2020, the current outstanding balance of 56,000 MT is for the Philippines. 

Corn:  Net sales of 968,800 MT for 2019/2020 were down 22 percent from the previous
week and 9 percent from the prior 4-week average.  Increases primarily for Japan (383,000 MT, including 60,300 MT switched from unknown destinations and decreases of 21,300 MT), South Korea (193,500 MT), Colombia (110,700 MT, including 75,000 MT switched from
unknown destinations and decreases of 1,400 MT), Saudi Arabia (61,700 MT, including 70,000 MT switched from unknown destinations and decreases of 8,300 MT), and Mexico (52,600 MT, including decreases of 100 MT), were offset by reductions for unknown destinations
(14,700 MT) and El Salvador (7,900 MT).  Exports of 782,800 MT–a marketing-year high–were up 31 percent from the previous week and 41 percent from the prior 4-week average.  The destinations were primarily to Mexico (228,700 MT), Japan (203,800 MT), Colombia
(189,700 MT), Saudi Arabia (61,700 MT), and El Salvador (29,600 MT). 

Optional Origin Sales:  For 2019/2020, options were exercised to export 50,000 MT to Israel from other than the United States.  The current outstanding balance of 524,900
MT is for South Korea (466,000 MT), and Egypt (58,900 MT).

Barley: No net sales for 2019/2020 were reported for the week.  Exports of 1,000 MT were down 21 percent
from the previous week, but up 14 percent from the prior 4-week average.  The destinations were Japan (900 MT) and Taiwan (100 MT).

Sorghum:  For 2019/2020, net sales of 17,600 MT resulting in increases for
China (72,600 MT, including 65,000 MT switched from unknown destinations) and Japan (10,000 MT), were offset by reductions for unknown destinations (65,000 MT).  Exports of 84,300 MT were up noticeably from the previous week and up 59 percent from the prior
4-week average.  The destinations were China (72,600 MT) and Mexico (11,700 MT). 

Rice: 
Net sales of 136,000 MT for 2019/2020 were up 78 percent from the previous week and up noticeably from the prior 4-week average.  Increases primarily for Colombia (110,800 MT, including decreases
of 82,500 MT), Turkey (25,000 MT), Honduras (6,000 MT), Guatemala (2,000 MT), and Canada (1,800 MT), were offset by reductions for Mexico (17,200 MT) and the Netherlands (100 MT). 
Exports of 86,000 MT were up 70 percent from the previous week and 94 percent from the prior 4-week average.  The destinations were primarily to Mexico (40,300 MT), Haiti (29,600 MT), El Salvador (4,500
MT), Canada (2,900 MT), and Jordan (2,900 MT).

Exports for Own Account:  For 2019/2020, the current exports for own account outstanding balance is 100
MT, all Canada.

Soybeans:  Net sales of 644,800 MT for 2019/2020 were down 8 percent from the previous week, but up 2 percent from
the prior 4-week average.  Increases primarily for China (132,000 MT), Egypt (120,000 MT), Bangladesh (60,900 MT, including 56,000 MT switched from unknown destinations and decreases of 1,100 MT), the Netherlands (56,000 MT, including 60,000 MT switched from
unknown destinations and decreases of 4,000 MT), and Japan (48,400 MT, including 29,700 MT switched from unknown destinations and decreases of 1,200 MT), were offset by reductions for Costa Rica (100 MT).  For 2020/2021, net sales of 6,300 MT were for Japan
(6,100 MT) and Hong Kong (200 MT).  Exports of 611,300 MT were down 58 percent from the previous week and 50 percent from the prior 4-week average.  The destinations were primarily to Bangladesh (85,900 MT), Mexico (73,000 MT), China (69,000 MT), the Netherlands
(56,000 MT), and Taiwan (50,800 MT). 

Exports for Own Account:  For 2019/2020, the current exports for own account outstanding balance is 2,100 MT, all
Canada.

Soybean Cake and Meal:  Net sales of 234,200 MT for 2019/2020 were up 10 percent from the previous week, but down 44 percent from the prior 4-week average.  Increases primarily for
Morocco (37,000 MT), the Philippines (35,400 MT), the Dominican Republic (25,000 MT), Canada (22,600 MT), and Ecuador (22,600 MT, including 7,000 MT switched from unknown destinations and decreases of 400 MT), were offset by reductions for Nicaragua (5,500
MT) and Belgium (900 MT).  Exports of 268,200 MT were up 56 percent from the previous week and 27 percent from the prior 4-week average.  The destinations were primarily to Spain (60,900 MT), the Philippines (50,700 MT), Mexico (45,500 MT), Libya (27,500 MT),
and Canada (17,100 MT).

Soybean Oil: 
Net sales of 39,100 MT for 2019/2020 primarily for South Korea (25,000 MT), Morocco (16,000 MT, switched from unknown destinations), Canada (3,600 MT), Jamaica (3,600 MT), and El Salvador (2,600
MT), were offset by reductions for unknown destinations (16,000 MT) and Colombia (500 MT).  Exports of 12,800 MT were primarily to Venezuela (5,500 MT), the Dominican Republic (2,900 MT), El Salvador (2,200 MT), Mexico (1,700 MT), and Canada (300 MT). 

Cotton:  Net sales of 350,900 RB for 2019/2020–a marketing-year high–were
up 6 percent from the previous week and 15 percent from the prior 4-week average.  Increases primarily for Vietnam (152,000 MT, including 2,600 RB switched from South Korea), Turkey (74,000 RB), Pakistan (49,300 RB), Bangladesh (44,200 RB), and Indonesia (20,500
RB, including 1,200 RB switched from Japan), were offset by reductions primarily for China (48,400 RB).  For 2020/2021, net sales of 57,300 RB were for Bangladesh (26,200 RB), Pakistan (18,500 RB), Malaysia (6,600 RB), Indonesia (5,300 RB), and Ecuador (700
RB).  Exports of 400,500 RB were down 4 percent from the previous week, but up 20 percent from the prior 4-week average.  Exports were primarily to Pakistan (93,400 RB), Vietnam (81,500 RB), Turkey (63,100 RB), China (52,200 RB), and Bangladesh (36,200 RB). 
Net sales of Pima totaling 10,900 RB were up 98 percent from the previous week, but down 42 percent from the prior 4-week average.  Increases primarily for India (5,200 RB), Egypt (2,200 RB), Turkey (1,200 RB), Thailand (1,000 RB), and Italy (800 RB, including
300 RB switched from China), were offset by reductions for China (500 RB).  Exports of 7,400 RB were up 28 percent from the previous week, but down 10 percent from the prior 4-week average.  The primary destinations were India (2,100 RB), Pakistan (1,500 RB),
El Salvador (900 RB), Peru (900 RB), and Bangladesh (800 RB). 

Exports for Own Account:  For 2019/2020, new exports for own account totaling
25,000 RB were primarily to Indonesia (17,900 RB), Vietnam (3,900 RB), Pakistan (1,000 RB), South Korea (1,000 RB), and Bangladesh (900 RB).  Exports for own account totaling 9,900 RB to Vietnam (4,700 RB), Pakistan (3,200 RB), Bangladesh (1,100 RB), China
(600 RB), and Japan (200 RB) were applied to new or outstanding sales.  Decreases were reported for India (1,100 RB).  The current exports for own account outstanding balance of 40,000 RB is for Indonesia (17,900 RB), Vietnam (7,500 RB), Bangladesh (6,200
RB), India (4,300 RB), China (2,700 RB), South Korea (1,000 RB), and Malaysia (400 RB). 

Hides and Skins:
Net sales of 236,900 pieces for 2020 primarily for China (87,700 whole cattle hides, including decreases of 16,400 pieces), South Korea (48,900 whole cattle hides, including decreases of 2,500 pieces), Mexico (44,500 whole cattle hides, including decreases
of 2,300 pieces), Thailand (21,700 whole cattle hides, including decreases of 2,800 pieces), Italy (19,100 whole calf skins, including decreases of 100 pieces), and Indonesia (14,000 pieces, including decreases of 200 pieces), were offset by reductions for
Belgium (1,400 whole kip skins), Brazil (300 whole cattle hides) and Japan (100 whole cattle hides).  Exports of 481,300 pieces were reported for 2020.  Whole cattle hide exports of 479,300 pieces were primarily to China (273,100 pieces), South Korea (98,600
pieces), Mexico (51,600 pieces), Thailand (25,500 pieces), and Taiwan (14,700 pieces).  Whole calf skin exports of 2,000 pieces were to Italy.

Net sales of 92,600 wet blues for 2020 primarily for Italy (30,400 unsplit and 23,000 grain splits), Vietnam (18,900 unsplit and 200
grain splits), China (8,800 grain splits and 8,800 unsplit), and the Dominican Republic (2,600 unsplit), were offset by reductions primarily for Thailand (100 unsplit).  Exports of 137,200 wet blues were to Italy (34,900 unsplit and 10,300 grain splits), China
(34,900 unsplit and 5,100 grain splits), Vietnam (32,100 unsplit), Thailand (15,700 unsplit), and Taiwan (2,400 unsplit).

Net sales of splits, 1,012,000 pounds for 2020, were for Vietnam (1,000,000 pounds) and China (12,000 pounds).  Exports of 172,000 pounds were to Vietnam
(160,000 pounds) and China (12,000 pounds).


Beef:
Net sales of 17,500 MT for 2020 were primarily for Japan (6,900 MT, including decreases of 800 MT), South Korea (4,300 MT, including decreases of 400 MT), Mexico (2,700 MT,
including decreases of 100 MT), Taiwan (1,000 MT, including decreases of 100 MT), and Canada (500 MT, including decreases of 100 MT).  Exports of 16,900 MT were primarily

to Japan (6,300 MT), South Korea (4,700 MT), Mexico (1,900 MT), Taiwan (1,000 MT), and Canada (1,000 MT). 

Pork:
Net sales of 28,600 MT for 2020 were primarily for Mexico (6,800 MT), Japan (4,400 MT), China (3,700 MT), South Korea (3,600 MT), and Canada (3,100 MT).  Exports of 42,900 MT
were primarily to Mexico (13,100 MT), China (13,000 MT), Japan (6,000 MT), South Korea (3,600 MT), and Canada (2,200 MT).


Terry Reilly

Senior Commodity Analyst – Grain and Oilseeds

Futures International │190 S LaSalle St., Suite 410│Chicago, IL  60603

W: 312.604.1366

treilly@futures-int.com

AIM: fi_treilly

ICE IM: 
treilly1

Skype: fi.treilly


Description: Description: Description: Description: FImail


Trading of futures, options, swaps and other derivatives is risky and is not suitable for all persons.  All of these investment products are leveraged, and you can lose more than your initial deposit.  Each investment product is offered
only to and from jurisdictions where solicitation and sale are lawful, and in accordance with applicable laws and regulations in such jurisdiction.  The information provided here should not be relied upon as a substitute for independent research before making
your investment decisions.  Futures International, LLC is merely providing this information for your general information and the information does not take into account any particular individual’s investment objectives, financial situation, or needs.  All investors
should obtain advice based on their unique situation before making any investment decision.  The contents of this communication and any attachments are for informational purposes only and under no circumstances should they be construed as an offer to buy or
sell, or a solicitation to buy or sell any future, option, swap or other derivative.  The sources for the information and any opinions in this communication are believed to be reliable, but Futures International, LLC does not warrant or guarantee the accuracy
of such information or opinions.  Futures International, LLC and its principals and employees may take positions different from any positions described in this communication.  Past results are not necessarily indicative of future results.


This email, any information contained herein and any files transmitted with it (collectively, the Material) are the sole property of OTC Global Holdings LP and its affiliates (OTCGH); are confidential, may be legally privileged and are intended solely for
the use of the individual or entity to whom they are addressed. Unauthorized disclosure, copying or distribution of the Material, is strictly prohibited and the recipient shall not redistribute the Material in any form to a third party. Please notify the sender
immediately by email if you have received this email by mistake, delete this email from your system and destroy any hard copies. OTCGH waives no privilege or confidentiality due to any mistaken transmission of this email.